Transcription
Poverty in the CommonwealthTheCommonwealthInstituteApril 2011Executive SummaryDuring the recent recession, as Virginia—and the nation as a whole—faced theworst economic crisis in a generation, the number of Virginians living below thefederal poverty threshold significantly increased. In 2009, more than 750,000Virginians lived in poverty. Even more disturbing, the state’s children are now morelikely to live in poverty than adults. As the effects of the recession linger, moreVirginians will face the prospect of living below the poverty threshold. More than one in 10 Virginians lived under the federal poverty level in 2009.This rate has been increasing since 2006. About 157,000 Virginians have joined the ranks of the poor since therecession began. In 2009, more people fell into deep poverty. About 5 percent of Virginia’spopulation was living on less than half of what is defined by the federalpoverty line in 2009. Virginia’s children are 47 percent more likely than adults to live in poverty. A lthough poverty disproportionately affects Virginia’s racial minorities, morethan half of Virginians living in poverty are white. M ore Virginians with college degrees are joining the impoverished.Virginians with a bachelor’s degree or higher showed the most growth inpoverty levels from 2007 to 2009. P overty exists across Virginia, but certain metropolitan statistical areas(MSAs) have far higher poverty rates than the statewide average. In six MSAsin the southern and western parts of the state, poverty rates are higher thanthe national average. In 2009, the Danville-MSA overall poverty rate was 21percent, 6 percentage points more than the national rate and three times thepoverty rate in Northern Virginia. A lmost 23 percent of Virginia’s workers earned wages too low to support afamily of four above the 2009 poverty threshold.More Virginians Living in PovertyIn 2009, more than one in 10 Virginians were living in poverty and almost one in 20were living in “deep poverty.” Unfortunately, based on recovery models from priorrecessions, poverty rates will continue rising through 2010 and possibly 2011, as joband wage growth lag behind the official end of the recession. Furthermore, whileoverall poverty in Virginia remains relatively low compared to other states, this reportshows that in some of Virginia’s metropolitan areas poverty rates are substantially higherthan in the United States as a whole and that Virginia’s children are more likely to livein poverty than adults.The Commonwealth InstituteAs the effects of the recessionlinger, more Virginians willface the prospect of livingbelow the poverty threshold.
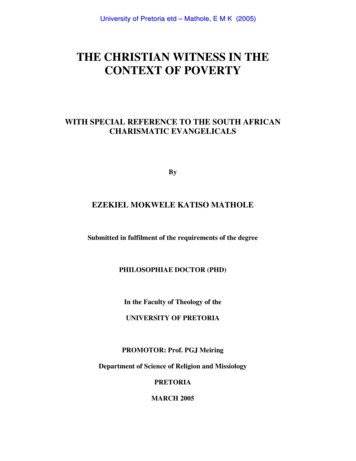
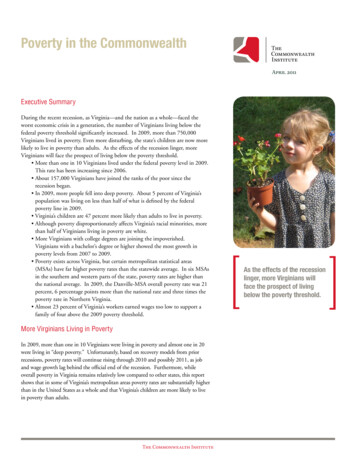
Right Back Where We Started FromFigure 1: Virginia's Poverty Rate, 1989-200913%Poverty Rate Despite making progress in the late 1990sand early 2000s, Virginia’s poverty rate hascrept back up and beyond where it was20 years ago. In 2009, Virginia’s povertyrate hit 10.5 percent—for a family offour, this means living with an incomebelow 22,050. As shown in Figure 1,Virginia’s poverty rate has been on therise since 2006. Yet, compared to otherstates, Virginia ranks relatively well on thismeasure of economic well-being; Virginiahas the ninth lowest overall poverty rate inthe nation. The national poverty rate in2009 was 14.3 percent.Source: BLS and ACS.More Virginians in Deep Poverty&"# %Figure 2: Share of Virginians Living under Half the PovertyThreshold, 2000-2009'"& %'"# %!"& %!"# %(###%(##)%(##(%(##!%(##'%(##&%(##*%(## %(##,%(##-%Source: American Community Survey.Not only did poverty rates increase in2009, but more and more of those belowthe poverty threshold fell further, into“deep” poverty. The poverty rate providesa picture of the share of the populationthat is considered poor, the “deep poverty”rate provides a picture of the share of thepopulation that is extremely poor. The term“deep poverty” typically refers to an incomelevel that is half of the federal poverty level.For a family of four, this meant living withan income below 11,025 in 2009. Asshown in Figure 2, just under 5 percent ofVirginia’s population—or one in every 20Virginians—lived in deep poverty. This is anincrease from the beginning of the decade,when 3.6 percent of Virginians were livingin deep poverty. Nationally, 6.3 percent ofAmericans lived in deep poverty in 2009.Virginia’s child poverty rate is particularlytroubling. Despite Virginia’s childrenalready being 39 percent more likely to livein poverty than Virginia’s adults before therecession, the child poverty rate in Virginiahas been on the rise since 2006 (Figure 3).Furthermore, the gap between Virginia’schildren and adults has been widening.In 2009, almost 14 percent of Virginia’schildren lived below the federal povertythreshold. This is an estimated increase ofroughly 41,200 children since 2001 androughly 19,200 children since the startof the recession. Children in Virginia arenow 47 percent more likely than adultsto live in poverty. Virginia’ child poverty2The Commonwealth Institute
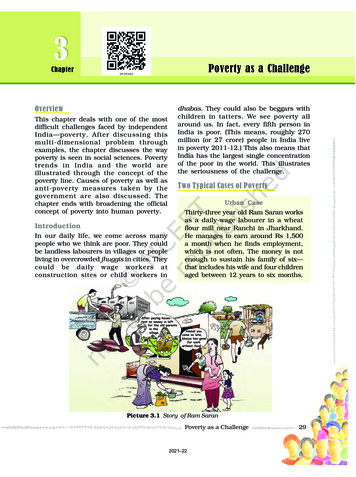
increase, however, is not unique. In fact,the Commonwealth ranks fairly wellnationally: Only 11 other states had lowerchild poverty rates than Virginia in 2009.Losing GroundFigure 3: Virginia's Child Poverty Rate, 1989-2009!"# %&'()*& ( ,-(' "## %Poverty by Race andEducational LevelAlthough the poverty rate among whiteVirginians is about 2 percentage pointsbelow the overall poverty rate, more thanhalf of the total number of Virginiansliving in poverty are white. Another thirdare African American. Figure 5 illustratesthe breakdown of total Virginias in povertyin 2009 by race.Just under 5 percent ofVirginia’s population — orone in every 20 Virginians —lived in deep poverty in 2009.')"## %'("## %''"## %'#"## %&"## %(##&%(##!%(##-%(##,%(## %(##*%(##)%(##(%(##'%(###%'&&&%!"## %Source: SAIPEPoverty Level by Race/EthnicityFigure 4: Percent Living Below Poverty, 2009' "# &"#'("#C0D-?,E#F6,-#G"H#Children are not the only group ofVirginians disproportionately affected bypoverty. Figure 4 shows that the povertyrate varies substantially by race in Virginia,with the lowest poverty rate amongVirginia’s Asian population (8 percent), andhighest among Virginia’s American Indianpopulation (21 percent). In 2009, just aboutone in five American Indian Virginians livedbelow the poverty threshold. This comparesto just under one in five African AmericanVirginians, roughly one in seven HispanicVirginians, and roughly one in 13 White orAsian Virginians.'*"## % %"# %"# ("#!"#!"#%"#("#)* ,-.#/0123 4561 7#3 4561 7896, 10#:;67 8 ? 761# @-? 761# 4 61# @-? 761#A1B 61#Source: American Community Survey.Half of Virginians in Poverty Are WhiteFigure 5: Share of Total Poverty by Race, 2009(#*' % #() %White, Non-Hispanic((#!) %The Commonwealth’s poverty rate alsovaries in important ways according toeducation level. As shown in Figure 6,education plays a key role in reducing thelikelihood of poverty. In 2009, the povertyrate was highest among those Virginianswith less than a high school degree. Ofthis group of Virginians, just about 22percent lived in poverty. The attainment ofa high school diploma, however, reducedthe likelihood of living in poverty byHispanic/LatinoBlack/African AmericanAsianAmerican Indian!"#!! %&#'! %The Commonwealth InstituteSource: American Community Survey.3
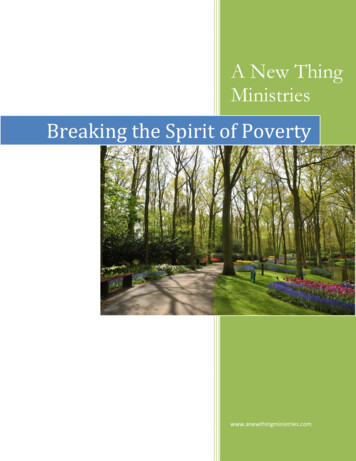
half, bringing the poverty rate among thisgroup of Virginians down to 9.4 percent.Some college, or an associate’s degree,further reduced the rate to 6.6 percent.A bachelor’s degree or higher brought thepoverty rate down to 2.7 percent.Poverty by Education Level in the Great RecessionFigure 6: Percentage Living Below Poverty, 2007 and 2009Poverty Rate (%)25%Although poverty rates across educationgroups did not change substantially betweentheir pre-recession levels in 2007 and their2009 levels, the greatest growth occurredamong Virginians with higher levels ofeducational attainment. As shown in Figure7, the change in poverty rates between 2007and 2009 was larger among Virginians withsome college or higher than among thosewith only a high school degree or less.2007200920%15%10%5%0%less than highschoolhigh schoolgraduatesome college,bachelor'sassociate's degree or higherdegreeSource: American Community Survey.Highly Educated See Biggest Jump in Poverty RateFigure 7: Percent Increase in Poverty Rate, 2007 to 200925%Increase in Poverty Rate (%)Poverty by Geographic RegionVirginia’s concentration of povertyvaries dramatically from one region toanother. Figure 8 displays Virginia’s 11metropolitan statistical areas according totheir overall poverty rates in 2009, whichranged from as low as 7.53 percent to as ahigh as 21.19 percent.20%15%10%5%0%less than high school high school graduate4Poverty Across the CommonwealthFigure 8: Poverty and Deep Poverty Rates by Virginia Metropolitan StatiscalArea, 2009'%"!!# '!"!!# K0C53/E &%"!!# J55? K0C53/E &!"!!# %"!!# The Commonwealth InstituteJ)-C,445 I)33,*0-FG3. H,-.*?03/193,*/04193,*/04 (,-: 5*/53 DE-: FG3. 94): *FG3.1B 3,*/,)-*FG3.1@)7 037 Source: American Community SurveyB )340//5*C,445 @0)-0 5 @,: A0-7 8,3.,-,) 95): 1;03 04 1;5 ?03/ ;5 * !"!!# ()* ,-./0-1234,-./0-12456)-73,) In addition to overall poverty rates,Figure 8 shows the share of individualsin “deep poverty” in each of the state’s11 metropolitan statistical areas. Theserates range from a low of 3.76 percentin Washington-Arlington-Alexandria toa high of 11.94 percent in BlacksburgChristiansburg-Radford. While it is notsurprising that the Washington-ArlingtonAlexandria MSA, with its low overallpoverty rate, has the lowest concentrationSource: American Community Survey.!"# %&'()*& ( ,-(Residents of the Danville MSA werealmost three times more likely to live inpoverty than residents of the WashingtonArlington-Alexandria MSA. DespiteVirginia’s relatively low overall povertyrate, six MSAs (Lynchburg, Winchester,Kingsport-Bristol, Harrisonburg,Blacksburg-Christiansburg-Radford, andDanville) had a poverty rate above thenational poverty rate in 2009.some college,bachelor's degree orassociate's degreehigher
of the very poor, the reverse is not the casewith the Danville MSA. Danville has thehighest concentration of poor, but onlythe third highest share of extremely poor.Both Blacksburg-Christiansburg-Radfordand Harrisonburg had higher rates of deeppoverty than Danville in 2009.Not EnoughShare of Workers (%)25%Figure 9: Share of Virginia Workers Earning Below a PovertyWage, 2001-200923%21%19%Poverty Wages for Virginia ource: EPI analysis of CPS.-ORGAlthough poverty is often thought of asprimarily affecting jobless adults and theirchildren, an increasing share of Virginiaworkers earn wages that are too low tosupport a family of four above the federalpoverty line. In 2009, more than one infive working Virginians earned wages lowenough to place them below the povertylevel (see Figure 9). For full-time workers,this meant earning 10.55 or less an hour.Virginia workers are still less likely thanworkers in the United States as a whole toearn below-poverty-level wages, but theincreasing prevalence of “poverty wages”points to a troubling trend.More than 1 in 5 Virginiaworkers earns a poverty wageConclusionTheCommonwealthInstituteThe Commonwealth Institute for Fiscal Analysis provides credible, independent and accessibleinformation and analyses of fiscal and economic policies with particular attention to the impacts onlow- and moderate-income persons. Our products inform state economic, fiscal, and budget policydebates and contribute to sound decisions that improve the well being of individuals, communitiesand Virginia as a whole. For more information go to www.thecommonwealthinstitute.org.P.O. Box 12516 Richmond, VA 23241 804-643-2474 www.thecommonwealthinstitute.orgThe Commonwealth InstituteAlthough Virginia’s economy entered therecession stronger than many other states’economies, many Virginia families arefinding they are unable to make ends meet.This is particularly true in regions of thestate that have been the most economicallyhard-hit. The upward creep in Virginiapoverty rates since 2001—and the largejump in those rates since the start of therecession—reveals a troubling trend, onethat is unlikely to be reversed for a numberof years. Significant action would berequired to expand the middle class throughthe (re-)creation of good jobs—those payingsufficient wages to support a family—and acommitment to ensure all Virginians have achance to share in the recovery.5
Blacksburg-Christiansburg-Radford, and Danville) had a poverty rate above the national poverty rate in 2009. In addition to overall poverty rates, Figure 8 shows the share of individuals in "deep poverty" in each of the state's 11 metropolitan statistical areas. These rates range from a low of 3.76 percent in Washington-Arlington .