Transcription
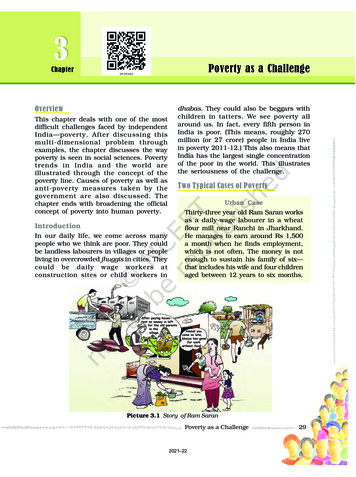
3Poverty as a ChallengeChapterOverviewThis chapter deals with one of the mostdifficult challenges faced by independentIndia—poverty. After discussing thismulti-dimensional problem throughexamples, the chapter discusses the waypoverty is seen in social sciences. Povertytrends in India and the world areillustrated through the concept of thepoverty line. Causes of poverty as well asanti-poverty measures taken by thegovernment are also discussed. Thechapter ends with broadening the officialconcept of poverty into human poverty.IntroductionIn our daily life, we come across manypeople who we think are poor. They couldbe landless labourers in villages or peopleliving in overcrowded jhuggis in cities. Theycould be daily wage workers atconstruction sites or child workers indhabas. They could also be beggars withchildren in tatters. We see poverty allaround us. In fact, every fifth person inIndia is poor. (This means, roughly 270million (or 27 crore) people in India livein poverty 2011-12.) This also means thatIndia has the largest single concentrationof the poor in the world. This illustratesthe seriousness of the challenge.Two Typical Cases of PovertyUrban CaseThirty-three year old Ram Saran worksas a daily-wage labourer in a wheatflour mill near Ranchi in Jharkhand.He manages to earn around Rs 1,500a month when he finds employment,which is not often. The money is notenough to sustain his family of six—that includes his wife and four childrenaged between 12 years to six months.Picture 3.1 Story of Ram SaranPoverty as a Challenge2021–2229
He has to send money home to his oldparents who live in a village nearRamgarh. His father a landlesslabourer, depends on Ram Saran andhis brother who lives in Hazaribagh,for sustenance. Ram Saran lives in aone-room rented house in a crowdedbasti in the outskirts of the city. It’s atemporary shack built of bricks andclay tiles. His wife Santa Devi, worksas a part time maid in a few housesand manages to earn another Rs 800.They manage a meagre meal of dal andrice twice a day, but there’s neverenough for all of them. His elder sonworks as a helper in a tea shop tosupplement the family income andearns another Rs 300, while his 10year-old daughter takes care of theyounger siblings. None of the childrengo to school. They have only two pairsof hand-me-down clothes each. Newones are bought only when the oldclothes become unwearable. Shoes area luxury. The younger kids areundernourished. They have no accessto healthcare when they fall ill.Rural caseLakha Singh belongs to a small villagenear Meerut in Uttar Pradesh. Hisfamily doesn’t own any land, so theydo odd jobs for the big farmers. Workis erratic and so is income. At timesthey get paid Rs 50 for a hard day’swork. But often it’s in kind like a fewkilograms of wheat or dal or evenvegetables for toiling in the farmthrough the day. The family of eightcannot always manage two squaremeals a day. Lakha lives in a kuchhahut on the outskirts of the village.The women of the family spend theday chopping fodder and collectingfirewood in the fields. His father aTB patient, passed away two yearsago due to lack of medication. Hismother now suffers from the samedisease and life is slowly ebbing away.Although, the village has a primaryschool, Lakha never went there. Hehad to start earning when he was 10years old. New clothes happen oncein a few years. Even soap and oil area luxury for the family.Study the above cases of povertyand discuss the following issuesrelated to poverty:Picture 3.2 Story of Lakha Singh30Economics2021–22 Landlessness Unemployment Size of families Illiteracy Poor health/malnutrition Child labour Helplessness
These two typical cases illustrate manydimensions of poverty. They show thatpoverty means hunger and lack of shelter.It also is a situation in which parents arenot able to send their children to schoolor a situation where sick people cannotafford treatment. Poverty also means lackof clean water and sanitation facilities. Italso means lack of a regular job at aminimum decent level. Above all it meansliving with a sense of helplessness. Poorpeople are in a situation in which theyare ill-treated at almost every place, infarms, factories, government offices,hospitals, railway stations etc. Obviously,nobody would like to live in poverty.One of the biggest challenges ofindependent India has been to bringmillions of its people out of abject poverty.Mahatama Gandhi always insisted thatIndia would be truly independent onlywhen the poorest of its people become freeof human suffering.Poverty as seen by social scientistsSince poverty has many facets, socialscientists look at it through a variety ofindicators. Usually the indicators usedrelate to the levels of income andconsumption. But now poverty is lookedthrough other social indicators likeilliteracy level, lack of general resistancedue to malnutrition, lack of access tohealthcare, lack of job opportunities, lackof access to safe drinking water,sanitation etc. Analysis of poverty basedon social exclusion and vulnerability isnow becoming very common (see box).Social exclusionAccording to this concept, povertymust be seen in terms of the poorhaving to live only in a poorsurrounding with other poor people,excluded from enjoying social equalityof better-of f people in bettersurroundings. Social exclusion can beboth a cause as well as aconsequence of poverty in the usualsense. Broadly, it is a process throughwhich individuals or groups areexcluded from facilities, benefits andopportunities that others (their“betters”) enjoy. A typical example isthe working of the caste system inIndia in which people belonging tocertain castes are excluded fromequal opportunities. Social exclusionthus may lead to, but can cause moredamage than, having a very lowincome.VulnerabilityVulnerability to poverty is a measure,which describes the greaterprobability of certain communities(say, members of a backward caste)or individuals (such as a widow or aphysically handicapped person) ofbecoming, or remaining, poor in thecoming years. Vulnerability isdetermined by the options availableto different communities for findingan alternative living in terms ofassets, education, health and jobopportunities. Further, it is analysedon the basis of the greater risks thesegroups face at the time of naturaldisasters (earthquakes, tsunami),terrorism etc. Additional analysis ismade of their social and economicability to handle these risks. In fact,vulnerability describes the greaterprobability of being more adverselyaffected than other people when badtime comes for everybody, whether aflood or an earthquake or simply afall in the availability of jobs!Poverty LineAt the centre of the discussion on povertyis usually the concept of the “poverty line”.A common method used to measurepoverty is based on the income orPoverty as a challenge2021–2231
consumption levels. A person isconsidered poor if his or her income orconsumption level falls below a given“minimum level” necessary to fulfill thebasic needs. What is necessary to satisfythe basic needs is different at differenttimes and in different countries.Therefore, poverty line may vary with timeand place. Each country uses animaginary line that is consideredappropriate for its existing level ofdevelopment and its accepted minimumsocial norms. For example, a person nothaving a car in the United States may beconsidered poor. In India, owning of a caris still considered a luxury.While determining the poverty line inIndia, a minimum level of food requirement,clothing, fo otwear, fuel and light,educational and medical requirement, etc.,are determined for subsistence. Thesephysical quantities are multiplied by theirprices in rupees. The present formula forfood requirement while estimating thepoverty line is based on the desiredcalorie requirement. Food items, such ascereals, pulses, vegetable, milk, oil, sugar,etc., together provide these neededcalories. The calorie needs vary dependingon age, sex and the type of work that aperson does. The accepted average calorierequirement in India is 2400 calories perperson per day in rural areas and 2100calories per person per day in urbanareas. Since people living in rural areasengage themselves in more physical work,calorie requirements in rural areas areconsidered to be higher than in urbanareas. The monetary expenditure percapita needed for buying these calorierequirements in terms of food grains, etc.,is revised periodically taking intoconsideration the rise in prices.On the basis of these calculations, forthe year 2011–12, the poverty line for aperson was fixed at Rs 816 per month forrural areas and Rs 1000 for urban areas.Despite less calorie requirement,the32Economics2021–22higher amount for urban areas has beenfixed because of high prices of manyessential products in urban centres. Inthis way in the year 2011-12, a family offive members living in rural areas andearning less than about Rs 4,080 permonth will be below the poverty line. Asimilar family in the urban areas wouldneed a minimum of Rs 5,000 per monthto meet their basic requirements. Thepoverty line is estimated periodically(normally every five years) by conductingsample surveys. These surveys arecarried out by the National Sample SurveyO rganisation (NSSO). However, formaking comparisons between developingcountries,manyinternationalorganisations like the World Bank use auniform standard for the poverty line:minimum availability of the equivalent of 1.90 per person per day (2011, ppp).Let’s DiscussDiscuss the following: Why do different countries use differentpoverty lines? What do you think would be the“minimum necessary level” in yourlocality?Poverty EstimatesIt is clear from Table 3.1 that there is asubstantial decline in poverty ratios inIndia from about 45 per cent in 1993-94to 37.2 per cent in 2004–05. Theproportion of people below poverty linefurther came down to about 22 per centin 2011–12. If the trend continues, peoplebelow poverty line may come down to lessthan 20 per cent in the next few years.Although the percentage of people livingunder poverty declined in the earlier twodecades (1973–1993), the number of poordeclined from 407 million in 2004–05 to270 million in 2011–12 with an averageannual decline of 2.2 percentage pointsduring 2004–05 to 2011–12.
Table 3.1: Estimates of Poverty in India (Tendulkar Methodology)Poverty ratio (%)Number of poor (in 37302232932627821775817653404407355270Source: India in figures, 2018, Government of India Central Statistics office.Let’s DiscussStudy Table 3.1 and answer the followingquestions: Even if poverty ratio declined between1993–94 and 2004–05, why did thenumber of poor remain at about 407million? Are the dynamics of poverty reductionthe same in rural and urban India?Vulnerable GroupsThe proportion of people below poverty lineis also not same for all social groups andeconomic categories in India. Socialgroups, which are most vulnerable topoverty are Scheduled Caste andScheduled Tribe households. Similarly,among the economic groups, the mostvulnerable groups are the ruralagricultural labour households and theurban casual labour households. Graph3.1 shows the percentage of poor peoplein all these groups. Although the averagefor people below poverty line for all groupsin India is 22, 43 out of 100 peoplebelonging to Scheduled Tribes are notable to meet their basic needs. Similarly,34 per cent of casual workers in urbanareas are below poverty line. About 34per cent of casual labour farm (in ruralareas) and 29 per cent of ScheduledC a s t e s a r e a l s o p o o r. The doubledisadvantage of being a landless casualwage labour household in the sociallydisadvantaged social groups of theGraph 3.1: Poverty in India 2011–12: Most Vulnerable GroupsSource: rty as a Challenge2021–2233
Picture 3.3 Story of Sivaramanscheduled caste or the scheduled tribepopulation highlights the seriousness ofthe problem. Some recent studies haveshown that except for the scheduled tribehouseholds, all the other three groups (i.e.scheduled castes, rural agriculturallabourers and the urban casual labourhouseholds) have seen a decline in povertyin the 1990s.Apart from these social groups, thereis also inequality of incomes within afamily. In poor families all suffer, but somesuffer more than others. In some caseswomen, elderly people and female infantsare denied equal access to resourcesavailable to the family.34Economics2021–22Story of SivaramanSivaraman lives in a small villagenear Karur town in Tamil Nadu. Karuris famous for its handloom andpowerloom fabrics. There are a 100families in the village. Sivaraman anAryunthathiyar (cobbler) by caste nowworks as an agricultural labourer forRs 160 per day. But that’s only forfive to six months in a year. At othertimes, he does odd jobs in the town.His wife Sasikala too works with him.But she can rarely find work thesedays, and even if she does, she’s paidRs 100 per day for the same work thatSivaraman does. There are eightmembers in the family. Sivaraman’s65 year old widowed mother is ill and
needs to be helped with her dailychores. He has a 25-year -oldunmarried sister and four childrenaged between 1 year to 16 years.Three of them are girls, the youngestis a son. None of the girls go to school.Buying books and other things forschool-going girls is a luxury hecannot afford. Also, he has to get themmarried at some point of time so hedoesn’t want to spend on theireducation now. His mother has lostinterest in life and is just waiting todie someday. His sister and elderdaughter take care of the household.Sivaraman plans to send his son toschool when he comes of age. Hisunmarried sister does not get alongwith his wife. Sasikala finds her aburden but Sivaraman can’t find asuitable groom due to lack of money.Although the family has difficulty inarranging two meals a day,Sivaraman manages to buy milk oncein a while, but only for his son.Let’s DiscussObserve some of the poor familiesaround you and try to find the following: Which social and economic group dothey belong to?Who are the earning members in thefamily?What is the condition of the old peoplein the family?Are all the children (boys and girls)attending schools?Inter-State DisparitiesPoverty in India also has another aspector dimension. The proportion of poorpeople is not the same in every state.Although state level poverty has witnesseda secular decline from the levels of earlyseventies, the success rate of reducingpoverty varies from state to state. Recentestimates show while the all India HeadCount Ratio (HCR) was 21.9 per cent in2011-12 states like Madhya Pradesh,Assam, Uttar Pardesh, Bihar and Odishahad above all India poverty level. As theGraph 3.2 shows, Bihar and Odishacontinue to be the two poorest states withpoverty ratios of 33.7 and 32.6 per centrespectively. Along with rural poverty,urban poverty is also high in Odisha,Madhya Pradesh, Bihar and Uttar Pradesh.In comparison, there has been asignificant decline in poverty in Kerala,Maharashtra, Andhra Pradesh, TamilNadu, Gujarat and West Bengal. Stateslike Punjab and Haryana havetraditionally succeeded in reducingpoverty with the help of high agriculturalgrowth rates. Kerala has focused more onhuman resource development. In WestBengal, land reform measures havehelped in reducing poverty. In AndhraPradesh and Tamil Nadu publicdistribution of food grains could have beenresponsible for the improvement.Global Poverty ScenarioThe proportion of people in differentcountries living in extreme economicpoverty— defined by the World Bank asliving on less than 1.90 per day—hasfallen from 36 per cent in 1990 to 10 per centin 2015. Although there has been asubstantial reduction in global poverty, itis marked with great regional differences.Poverty declined substantially in Chinaand Southeast Asian countries as a resultof rapid economic growth and massiveinvestments in human resourcedevelopment. Number of poors in Chinahas come down from 88.3 per cent in 1981to 14.7 per cent in 2008 to 0.6 per centin 2019. In the countries of South Asia(India, Pakistan, Sri Lanka, Nepal,Bangladesh, Bhutan) the decline has alsoPoverty as a challenge2021–2235
Graph 3.2: Poverty Ratio in Selected Indian States, (As per 2011 Census)Source: Economic Survey 2018–19, Government of India, 2019.Let’s DiscussStudy the Graph 3.2 and do the following: Identify the three states where thepoverty ratio is the highest. Identify the three states where povertyratio is the lowest.been rapid 34 per cent in 2005 to 15.2per cent in 2014. With decline in thepercentage of the poor, the number ofpoor has also declined significantly from510.4 million in 2005 to 274.5 million in2013. Because of different poverty linedefinition, poverty in India is also shownhigher than the national estimates.In Sub-Saharan Africa, poverty in factdeclined from 51 per cent in 2005 to 40.2per cent in 2018 (see graph 3.3). In LatinAmerica, the ratio of poverty has alsodeclined from 10 per cent in 2005 to 4per cent in 2018 (see graph 3.3). Povertyhas also resurfaced in some of the formersocialist countries like Russia, whereofficially it was non-existent earlier. Table3.2 shows the proportion of people livingunder poverty in different countries asdefined by the international poverty line(means population below 1.90 a day).36Economics2021–22The new sustainable development goalsof the United Nations (UN) proposesending poverty of all types by 2030.Let’s DiscussStudy the Graph 3.4 and do the following: Identify the areas of the world, wherepoverty ratios have declined. Identify the area of the globe which hasthe largest concentration of the poor.Table 3.2: Poverty: Head Count RatioComparison among Some Selected CountriesCountry1. Nigeria2. Bangladesh3. India4. Pakistan5. China6. Brazil7. Indonesia8. Sri Lanka% of Population below 1.90 a day (2011ppp)39.1 (2018)14.5 (2016)22.5 (2011)4.0 (2015)0.5 (2016)4.4 (2018)3.6 (2018)0.9 (2016)Source: Poverty and Equity Database, WorldBank Data; (databank.worldbank.org)
Graph 3.3: Share of people living on 1.90 a day, 2005–2019140120100PercentageSouth Asia80La!n merica and CarribeanSub-sharan Africa60East asia and PacificChina4020020052010201320152019YearSource: Poverty and Equity Database; World px?source poverty-and-equity-database)Graph 3.4: Number of poor by region ( 1.90 per day) in millionsBy 2030, forecasts indicate that nearly 9 in10 of the extreme poor will live in Sub-Saharan Africa.Source: World Bank PovcalNet and Poverty & Equity Data aspx?source poverty-and-equity-database)Poverty as a Challenge2021–2237
Causes of PovertyThere were a number of causes for thewidespread poverty in India. Onehistorical reason is the low level ofeconomic development under the Britishcolonial administration. The policies ofthe colonial government ruined traditionalhandicrafts and discouraged developmentof industries like textiles. The low rate ofgrowth persisted until the nineteeneighties. This resulted in less jobopportunities and low growth rate ofincomes. This was accompanied by a highgrowth rate of population. The twocombined to make the growth rate of percapita income very low. The failure at boththe fronts: promotion of economic growthand population control perpetuated thecycle of poverty.With the spread of irrigation and theGreen revolution, many job opportunitieswere created in the agriculture sector. Butthe effects were limited to some parts ofIndia. The industries, both in the publicand the private sector, did provide somejobs. But these were not enough to absorball the job seekers. Unable to find properjobs in cities, many people started workingasrickshawpullers,vendors,construction workers, domestic servantsetc. With irregular small incomes, thesepeople could not afford expensive housing.They started living in slums on theoutskirts of the cities and the problemsof poverty, largely a rural phenomenonalso became the feature of the urbansector.Another feature of high poverty rateshas been the huge income inequalities.One of the major reasons for this is theunequal distribution of land and otherresources. Despite many policies, we havenot been able to tackle the issue in ameaningful manner. Major policyinitiatives like land reforms which aimedat redistribution of assets in rural areashave not been implemented properly and38Economics2021–22effectively by most of the stategovernments. Since lack of land resourceshas been one of the major causes ofpoverty in India, proper implementationof policy could have improved the life ofmillions of rural poor.Many other socio-cultural andeconomic factors also are responsible forpoverty. In order to fulfil social obligationsand observe religious ceremonies, peoplein India, including the very poor, spend alot of money. Small farmers need moneyto buy agricultural inputs like seeds,fertilizer, pesticides etc. Since poor peoplehardly have any savings, they borrow.Unable to repay because of poverty, theybecome victims of indebtedness. So thehigh level of indebtedness is both thecause and effect of poverty.Anti-Poverty MeasuresRemoval of poverty has been one of themajor objectives of Indian developmentalstrategy. The current anti-povertystrategy of the government is basedbroadly on two planks (1) promotion ofeconomic growth (2) targeted anti-povertyprogrammes.Over a period of thirty years lastingup to the early eighties, there were littleper capita income growth and not muchreduction in poverty. Official povertyestimates which were about 45 per centin the early 1950s remained the same evenin the early eighties. Since the eighties,India’s economic growth has been one ofthe fastest in the world. The growth ratejumped from the average of about 3.5 percent a year in the 1970s to about 6 percent during the 1980s and 1990s. Thehigher growth rates have helpedsignificantly in the reduction of poverty.Therefore, it is becoming clear that thereis a strong link between economic growthand poverty reduction. Economic growthwidens opportunities and provides theresources needed to invest in humandevelopment. This also encourages people
to send their children, including the girlchild, to schools in the hope of gettingbetter economic returns from investingin education. However, the poor may notbe able to take direct advantage from theopportunities created by economicgrowth. Moreover, growth in theagriculture sector is much belowexpectations. This has a direct bearingon poverty as a large number of poorpeople live in villages and are dependenton agriculture.In these circumstances, there is aclear need for targeted anti-povertyprogrammes. Although there are so manyschemes which are formulated to affectpoverty directly or indirectly, some ofthem are worth mentioning. MahatmaGandhi National Rural EmploymentGuarantee Act, 2005 aims to provide 100days of wage employment to everyhousehold to ensure livelihood securityin rural areas. It also aimed at sustainabledevelopment to address the cause ofdraught, deforestration and soil erosion.One-third of the proposed jobs have beenreserved for women. The scheme providedemployment to 220 crores person days ofemployment to 4.78 crore households.The share of SC, ST, Women person daysin the scheme are 23 per cent, 17 percent and 53 per cent respectively. Theaverage wage has increased from 65 in2006–07 to 132 in 2013–14. Recently, inMarch 2018, the wage rate for unskilledmanual workers has been revised, statewise, the range of wage rate for differentstates and union territories lies inbetween 281 per day (for the workers inHaryana) to 168 per day (for the workersof Bihar and Jharkhand).Prime Minister Rozgar Yozana (PMRY)is another scheme which was started in1993. The aim of the programme is tocreate self-employment opportunitiesfor educated unemployed youth in ruralareas and small towns. They are helped insetting up small business and industries.Rural Employment Generation Programme(REGP) was launched in 1995. The aim ofthe programme is to create selfemployment opportunities in rural areasand small towns. A target for creating 25lakh new jobs has been set for theprogramme under the Tenth Five Yearplan. Swarnajayanti Gram SwarozgarYojana (SGSY) was launched in 1999. Theprogramme aims at bringing the assistedpoor families above the poverty line byorganising them into self help groupsthrough a mix of bank credit andgovernment subsidy. Under the PradhanMantri Gramodaya Yozana (PMGY)launched in 2000, additional centralassistance is given to states for basicservices such as primary health, primaryeducation, rural shelter, rural drinkingwater and rural electrification. A notherimportant scheme is Antyodaya AnnaYozana (A AY) about which you will bereading more in the next chapter.The results of these programmes havebeen mixed. One of the major reasonsfor less effectiveness is the lack of properimplementation and right targeting.Moreover, there has be en a lot ofoverlapping of schemes. Despite goodintentions, the benefits of these schemesare not fully reached to the deservingpoor. Therefore, the major emphasis inrecent years is on proper monitoring ofall the poverty alleviation programmes.The Challenges AheadPoverty has certainly declined in India.But despite the progress, povertyreductionremainsI ndia’smostcompelling challenge. Wide disparities inpoverty are visible between rural andurban areas and among different states.Poverty as a challenge2021–2239
Certain social and economic groups aremore vulnerable to poverty. Povertyreduction is expected to make betterprogress in the next ten to fifteen years.This would be possible mainly due tohigher economic growth, increasing stresson universal free elementary education,declining population growth, increasingempowerment of the women and theeconomically weaker sections of society.The of ficial definition of poverty,however, captures only a limited part ofwhat poverty really means to people. It isabout a “minimum” subsistence level ofliving rather than a “reasonable” level ofliving. Many scholars advocate that wemust broaden the concept into humanpoverty. A large number of people mayhave been able to feed themselves. Butdo they have education? Or shelter? Orhealth care? Or job security? Or selfconfidence? Are they free from caste andgender discrimination? Is the practice ofchild labour still common? Worldwideexperience shows that with development,the definition of what constitutes povertyalso changes. Eradication of poverty isalways a moving target. Hopefully we willbe able to provide the minimum“necessary” in terms of only income toall people by the end of the next decade.But the target will move on for many ofthe bigger challenges that still remain:providing health care, education and jobsecurity for all, and achieving genderequality and dignity for the poor. Thesewill be even bigger tasks.SummaryYou have seen in this chapter that poverty has many dimensions. Normally, thisis measured through the concept of “poverty line”. Through this concept weanalysed main global and national trends in poverty. But in recent years, analysisof poverty is becoming rich through a variety of new concepts like social exclusion.Similarly, the challenge is becoming bigger as scholars are broadening the conceptinto human poverty.Exercises1.2.3.4.5.6.7.8.9.40Describe how the poverty line is estimated in India?Do you think that present methodology of poverty estimation is appropriate?Describe poverty trends in India since 1973?Discuss the major reasons for poverty in India?Identify the social and economic groups which are most vulnerable to povertyin India.Give an account of interstate disparities of poverty in India.Describe global poverty trends.Describe current government strategy of poverty alleviation?Answer the following questions briefly(i) What do you understand by human poverty?(ii) Who are the poorest of the poor?(iii) What are the main features of the National Rural EmploymentGuarantee Act 2005?Economics2021–22
ReferencesDEATON, ANGUS AND VALERIE KOZEL (Eds.) 2005. The Great Indian Poverty Debate.MacMillan India Limited, New Delhi.Economic Survey 2015–2016. Ministry of Finance, Government of India, New Delhi.(Chapter on social sectors, [Online web] URL: http://indiabudget.nic.in/es 2004–05/social.htm)Mid-Term Appraisal of the Tenth Five Year Plan 2002–2007. Planning Commission,New Delhi. Part II, Chapter 7: Poverty Elimination and Rural Employment,[Online web] URL: shpdf/chapter-07.pdfNational Rural Employment Guarantee Act 2005. [Online web] URL: http://rural.nic.in/rajaswa.pdfPANAGRIYA ARVIND AND VISHAL MORE ‘Poverty by social, religious and economic groups inIndia and its largest state’, working paper no. 2013-14, Programme on Indianeconomic policies, Columbia University.Tenth Five Year Plan 2002–2007. Planning Commission, New Delhi. (Chapter 3.2,Poverty Alleviation in Rural India: Strategy and Programmes, [Online web] nrel/fiveyr/10th/volume2/v2 ch3 2.pdfWorld Development Indicators 2016. Featuring the Suistainable Development Goals,The World Bank.Poverty as a Challenge2021–2241
Poverty as a challenge 31 These two typical cases illustrate many dimensions of poverty. They show that poverty means hunger and lack of shelter . It also is a situation in which parents are not able to send their children to school or a situation where sick people cannot afford treatment. Poverty