Transcription
Vol-5 Issue-6 2019IJARIIE-ISSN(O)-2395-4396EMPLOYEES DATA ANALYSIS BYAPPLIED SPSSAuthor1, Author212Aung Cho, Application Department,University of Computer Studies (Maubin) ,Ayeyarwady,MyanmarAung Si Thu, Hardware Department,University of Computer Studies (Maubin) ,Ayeyarwady,MyanmarABSTRACTSPSS is powerful to analyze employee data. This paper intends to support business leaders the benefits of dataanalyzing with applied SPSS. This paper shows whether facility rates is harmony on each employee rank or not. Itshowed the data analysis of employee facilities such as care, support, workplace, meaningful, salary and happinessgiven rates between 1 to 10. As SPSS’s background algorithms, it showed the mean algorithm for the tables. Andthen Sample data ‘bank clean.sav’ was downloaded from Google free share and was analyzed and viewed. It usedIBM SPSS statistics version 23 and PYTHON version 3.7.Keyword : - SPSS is powerful to analyze employee data1. IntroductionNowadays businesses are competing with others not to lose their market places in local and external regions. Thispaper shows whether facility rates is harmony on each employee rank or not. Business leaders can get theiremployees with good quality and can avoid the loss of good employees of his business by using SPSS software. Thispaper used SPSS integrated with Python software. It showed the data analysis of employee facilities such as care,support, workplace, meaningful, salary and happiness that includes 7 tables, two graphs and data analytical views.1.1 SPSSSPSS, standing for Statistical Package for the Social Sciences, is a powerful, user-friendly software package for themanipulation and statistical analysis of data. The package is particularly useful for students and researchers inpsychology, sociology, psychiatry, and other behavioral sciences, containing as it does an extensive range of bothunivariate and multivariate procedures. Data analysis generally begins with the calculation of a number of summarystatistics such as the mean, median, standard deviation, etc., and by creating informative graphical displays of thedata such as histograms, box plots, and stem-and-leaf plots.[2]1.2 SPSS CrosstabsCross tabulation tables, or contingency tables are frequently employed to examine the relationship between twovariables (usually nominal or ordinal) that have a small number of categories.[4]1.3 SPSS GraphSPSS can display your data in a bar chart, a line graph, an area graph, a pie chart, a scatterplot, a histogram, acollection of high-low indicators, a box plot, or a dual-axis graph. Adding to the flexibility, each of these basicforms can have multiple appearances. For example, a bar chart can have a two- or three-dimensional appearance,represent data in different colors, or contain simple lines or I-beams for bars. The choice of layouts is almostendless.[3]2.AlgorithmMEANS Algorithms[1]Cases are cross-classified on the basis of multiple independent variables, and for each cell of the10566www.ijariie.com1034
Vol-5 Issue-6 2019IJARIIE-ISSN(O)-2395-4396resulting cross-classification, basic statistics are calculated for a dependent variable.NotationDescription𝑋𝑖𝑝Value for the pth independent variable for case i𝑌𝑖Value for the dependent variable for case i𝑤𝑖Weight for case iPNumber of independent variablesNNumber of casesStatisticsFor each value of the first independent variable (𝑋1 ),for each value of the pair (𝑋1 , 𝑋2 ), for thetriple (𝑋1 , 𝑋2 , 𝑋3 ), and similarly for the P-tuple , the following are computed:Sum of Case Weights for the Cell𝑊 𝑁𝑖 1 𝑤𝑖 𝑙𝑖where 𝑙𝑖 1 if the ith case is in the cell 𝑙𝑖 0, otherwise.The Mean𝑌ℎ 𝑁𝑖 1 𝑤𝑖 𝑙𝑖 𝑌𝑖𝑊3. Testing3.1. Calculate mean valuesA. Calculate mean values for care facilitySPSS Code: MEANS TABLES q1 BY jtype /CELLS MEANTable-1: care facilityB. Calculate mean values for support facilitySPSS Code:MEANS TABLES q2 BY jtype /CELLS MEAN10566www.ijariie.com1035
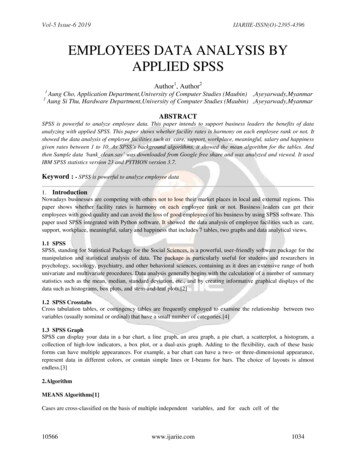
Vol-5 Issue-6 2019IJARIIE-ISSN(O)-2395-4396Table-2: support facilityContinue to Calculate mean values for workplace, meaningful, salary, happyness , facilities as the above way.And got the mean values for all facilitiesTable-3: mean values for all facilitiesH. Drawing GraphBar Graph-1: mean values for all facilities10566www.ijariie.com1036
Vol-5 Issue-6 2019IJARIIE-ISSN(O)-2395-4396Bar Graph-2: average values for total facilities3.2 Data analytical view:As a result of table-3 and bar graph-1,o In happy, salary, meaningful and workplace rates, upper management level is maximum and sales level isminimum.These facilities should be given to upper manager because he is key player for decision making to successplan.o In support and care rates, middle management level is maximum and sales level is minimum.These facilities should be given to middle manager because he is joker to interface between upper and loweremployee levels.o In salary rates, IT level got more than middle management.This facility should be given to IT technician because he is a very important person for data processing, datasecurity and data distribution in internal and external of the business.As a result of table-3 and bar graph-2,the important rank levels by facilities sequence are1.2.3.4.5.Upper level management.Middle level managementITMarketingSalesSo you can see that higher rank was, higher rate got. Minimum rate is more than 5. Different rates amongcontinuous levels are nearly same amout.The business has good harmony in facilities and ranks.10566www.ijariie.com1037
Vol-5 Issue-6 2019IJARIIE-ISSN(O)-2395-4396I think this business leader shared the voters or auto voter machine the information to know the standardskills of each employee level for the giving facilities rates before giving.If data is more true, information is more actuate and reliable for other actions.4.ConclusionSPSS data analysis tools are valuable in social science, business and marketing fields. It is very good forpresentation report by graphical design. This paper shows whether facility rates is harmony on each employee rankor not. Business leaders can get their employees with good quality and can avoid the loss of good employees of hisbusiness by using SPSS software.References[1] IBM SPSS Statistics 22 Algorithms pdf book[book style][2] A handbook of statistical analyses using SPSS / Sabine, Landau, Brian S. Everitt, ISBN 1-58488-369-3 [bookstyle][3] SPSS For Dummies , 2nd Edition, ISBN: 978-0-470-48764-8[book style][4] SPSS for Social Scientists Robert L. Miller, Ciaran Acton, Deirdre A. Fullerton and John Maltby, ISBN 0–333–92286–7[book style]Aung Cho received the B.A.(Eco) degree from Yangon University in 1987 andM.I.Sc.(Information Science) degree from University of Computer Studies, Yangon in2001. After got Master degree, I served as a teacher at the software, information scienceand application departments of the computer universities. I am now with University ofComputer Studies, Maubin.Aung Si Thu received the B.Sc.(Hons)(Chemistry) degree from MagweUniversity in 2003 and M.I.Sc.(Information Science) degree from University of ComputerStudies, Yangon in 2009. After got Master degree, I served as a teacher at the software,information science and hardware departments of the computer universities. I am nowwith University of Computer Studies, Maubin, Myanmar.10566www.ijariie.com1038
1.3 SPSS Graph SPSS can display your data in a bar chart, a line graph, an area graph, a pie chart, a scatterplot, a histogram, a collection of high-low indicators, a box plot, or a dual-axis graph. Adding to the flexibility, each of these basic forms can have multiple appearances. For example, a bar chart can have a two- or three-dimensional .