Transcription
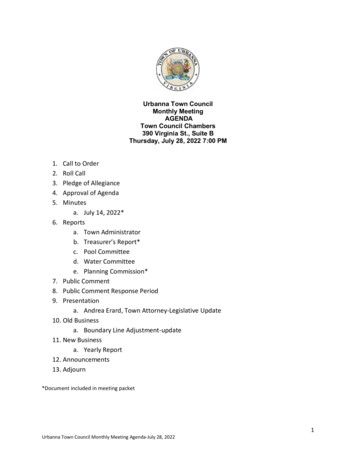
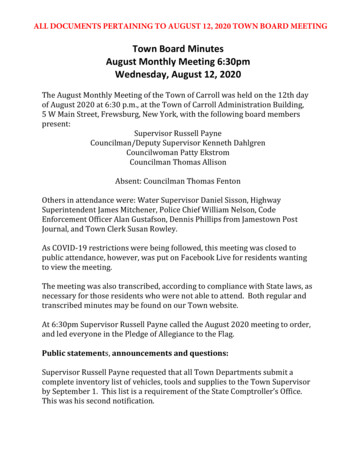
URBAN ACTION AGENDA 2015TOWN OFSAUGERTIES19,419 Population64% of units are owner occupied22% of units are renter occupied14% of units are vacantresidents receive food8% ofassistancebenefits40%of households pay greater than30% of their household incometowards housingresidents have a bachelor’s26% ofdegreeor higher 61,117 is the median household incomeMunicipality Boundaryresidents work within the12% ofmunicipalityPoints of InterestShare of Population by Age and SexPopulation by Race and Ethnicitysource: 2009-13 American Community Surveysource: 2009-13 American Community Survey, 2000 Decennial CensusFemaleMaleSaugerties0 to 45 to 910 to 1415 to 1920 to 2425 to 2930 to 3435 to 3940 to 4445 to 4950 to 5455 to 5960 to 6465 to 6970 to 7475 to 7980 to 8485 10%5%SaugertiesUlster CountyUlster County89%87%White*3%2%4%Hispanic or Latino6%0%Asian* 1%1%Other* 2%Black*5%10%* not Hispanic or LatinoSaugerties 1 OF 885%81%5%5%6%9%1%1%2%2%25% 50% 75% 100%25% 50% 75% 100%20002013
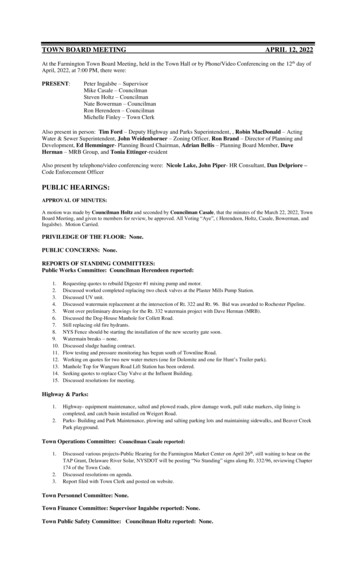
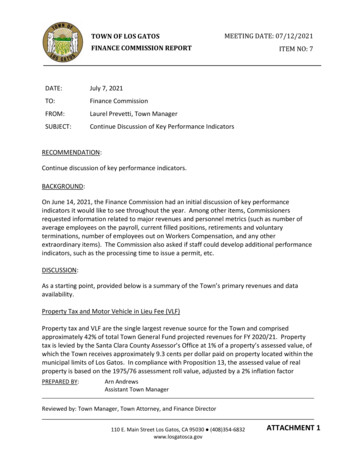
URBAN ACTION AGENDA 2015SAUGERTIESHOUSINGHousing Wagesource: National Low Income Housing CoalitionThe metrics on this page provide information about housing in thecommunity - the number of owner-occupied, renter-occupied, and vacantunits as compared to the county overall; the change in home valuessince 2000; and the age of the housing stock. Housing wage looksat the amount of money a person working a full-time job would haveto make in order to afford rental housing (in this case a one or twobedroom unit) without having to pay more than 30% of their income.Finally, housing cost as a percent of income shows the percentageof renters and owners in the community whose housing costs areconsidered affordable, unaffordable, and severely unaffordable.Housing wage for a one bedroomapartment in Ulster County:17.77 35,538per hourper yearHousing wage for a two bedroomapartment in Ulster County:23.02 46,038per hourper yearHousing TenureAge of Housing Stocksource: 2009-13 American Community Surveysource: 2009-13 American Community Survey1,283 / 14%13,697 / 16%1,924 / 22%21,084 / 25%Built 2010 or later18 / 0%2000 to 2009877 / 10%1990 to 1999672 / 8%1980 to 1989986 / 11%1970 to 19795,708 / 64%48,778 / 58%Vacant1960 to 1969Renter Occupied1950 to 19591,072 / 12%1,439 / 16%1940 to 1949Owner OccupiedSaugerties777 / 9%784 / 9%1939 or earlierUlster County2,290 / 26%Changing Home ValuesHousing Cost as Percent of Incomesource: 2009-13 American Community Survey, 2000 Censussource: 2008-2012 HUD CHAS0- 99,9995% 100,000- 199,999 200,000- 299,9993% 300,000- 399,999 0% 13% 400,000 to 499,999 0%3% 500,000 to 749,999 0%3% 750,000 to 999,999 0%0% 1,000,000 or more 0%0%51%44%34%200010 20 30 40 50 60 70 80 90 1002013Renters49%28%23%38%OwnersRenters & Owners64%60%22%24%14%16%Affordable (pays less than 30% income toward housing)Unaffordable (pays 30-50% income toward housing)Severely Unaffordable (pays more than 50% income toward housing)Saugerties 2 OF 8
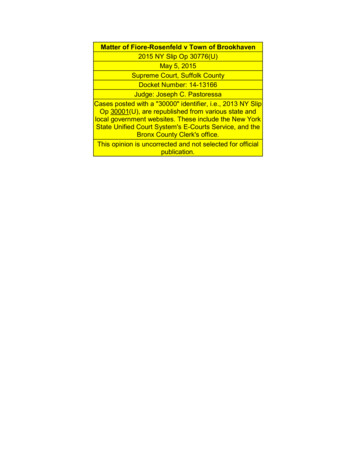
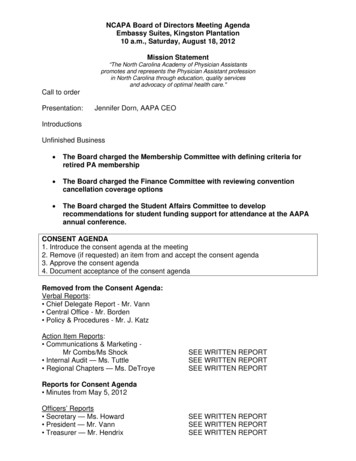
URBAN ACTION AGENDA 2015SAUGERTIESINCOME ANDPOVERTYLabor Force ParticipationThe metrics on this page provide information about income and povertyin the community. Median household income, income distribution,and the percentage of households in poverty in 2000 and 2013 forthe community and the county are shown. The employment rate, thepercentage of residents not in the labor force, and the unemploymentrate in 2000 and 2013 for the community and the county are alsoshown. Finally, the percentage of households receiving food assistancefor the community and the county is based on the distribution of USDASupplemental Nutrition Assistance Program (SNAP) benefits.60%Median Household IncomeIncome Distributionsource: 2009-13 American Community Survey, Census 2000 (adjusted to 2013 dollars)source: 2009-13 American Community Survey, 2000 Censussource: 2009-13 American Community Survey, 2000 CensusPercent of Residents Ages 16 and 4%20002013Ulster CountySaugerties 75,000 57,564 58,59020002013Ulster CountyHouseholds in Poverty 150,000 to 199,99922%22%20%21%19%11% 75,000 to 99,999 100,000 to 150,00029%20% 50,000- 75,00020002013Saugerties20%32% 25,000- 50,000 61,11728%17% 50,000 57,361Ulster County25% 0- 25,000 25,000Not in Labor forceEmployedUnemployment Rate10%14%13%5%7%14%14%0%1%5%5%source: 2009-13 American Community Survey, Census 2000Source: LI Real Estate 200,000 or moreSuffolk %10.8%6.5%Melville20002013 353,100 in 2013Saugerties 169,000 in 2000Households Receiving Food Assistancesource: 2009-13 American Community Survey, Snap BenefitsSuffolk County20002013 383,400in 2013UlsterCounty 183,500 in 2000Town of SaugertiesUlster CountySaugerties 3 OF 820138%11%
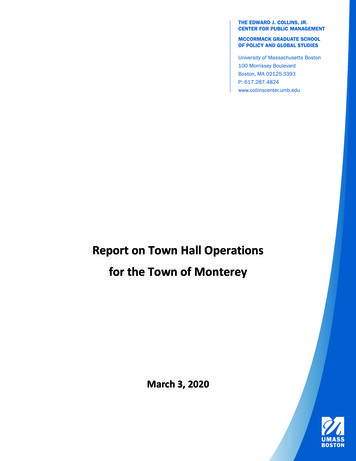
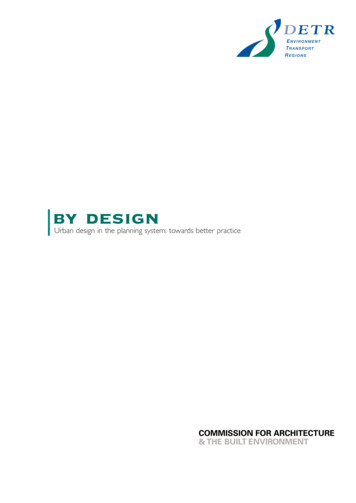
URBAN ACTION AGENDA 2015SAUGERTIESEDUCATIONEmployment and Educationsource: 2009-2013 American Community SurveyThe metrics on this page provide information about education inthe community. The school district or districts that are located inthe community are illustrated on the map; and annual spending perpupil for years 2005-2013 is shown for each of the school districts.Communitywide educational attainment and its relation to employmentfor those aged 25-64 is shown. Select demographics for each schooldistrict – enrollment, the percentage of students who are eligible forfree or reduced lunch, and the number of students with limited Englishproficiency – are shown. Finally, annual school performance for eachdistrict is demonstrated by the graduation rate and a college and careerreadiness measure established by the NYS Department of Educationstarting in 2010.Number of Residents Between Ages 25 & 6401000200030004000Less than High SchoolHigh School21%72%Associate's Degree 16%79%Bachelor's Degree Not in labor forceUnemployedEmployed80%Percentages show the proportion of residents within each levelof educational attainment who are employed, unemployed, ornot in the laborforceExpenditures Per PupilSchool District Student Characteristicssource: New York State Department of Educationsource: New York State Department of EducationSaugerties Central 25,000 2010Total EnrollmentEligible for Free or Reduced LunchLimited English ProficiencyExpenditures Per PupilGraduation Rate & Career Readinesssource: New York State Department of Educationnote: College and career readiness data only available for 2010-2014School District BoundarySaugerties 4 OF 8Graduation RateCollege & Career Readiness Rate2014201320122011201020082006Municipality Boundary2009Saugerties 2006 5,0002008755025 10,0002005Saugerties Central4,0003,0002,0001,000 20,0005000
URBAN ACTION AGENDA 2015SAUGERTIESQUALITY OF LIFEAccess to Parkssource: open space data from The Nature ConservancyIndicators on this page provide information about the quality of lifein the community. The annual number of reported crimes going backto 1990 is broken down into two categories – violent and propertycrimes. Obesity prevalence by zip code in comparison to the countyprovides an indicator of public health. The percent of the populationthat lives within walking distance of a park as well as the total acres ofparks in close proximity of the municipality are expressed. And finally,access to quality food looks at the proximity of people in low-incomeneighborhoods to the nearest supermarket, supercenter, or largegrocery store. Areas that are highlighted demonstrate poor access toquality food.Access To Parks41% of Saugerties Residents live within 1/2 mile of a parkAcres of ParksSaugerties has 20,197 acres of parkland within 1/2 mile of themunicipal boundary** The full area for all parks was counted here even if some portion of the park lies further than1/2 mile from the municipalityNumber of CrimesAccess to Quality Foodsource: New York State Division of Criminal Justice Servicesagency: Saugerties Town Police Departmentsource: USDA, Food Environment Atlas. Low-income tracts with at least 500 people or 33 percent of the population living more than 1 mile (urban areas) or more than 10 miles (rural areas)from the nearest supermarket, supercenter, or large grocery 011201220132014100ViolentPropertyObesity Prevalencesource: D-Atlas with data from the 2000-2010 Centers for Disease Control Behavioral RiskFactor Surveillance System Survey30%1247720%Zip 0%Municipality BoundaryUlster CountyFood Desert Census TractsSaugerties 5 OF 8
URBAN ACTION AGENDA 2015SAUGERTIESECONOMYTaxes based on 220,500 Homesource: New York State Office of Real Property Tax Services 2013note: Excludes local fire and other special taxing districts.The metrics on this page provide information about the local economy.The estimated amount and distribution of property taxes among taxingjurisdictions (local, county, and school district) is shown for a home withthe community’s median home value. Employment by industry is shownfor the years 2000 and 2013. The annual number of residential buildingpermits (in terms of both buildings and units) from 2000 to 2014, andthe total annual value of residential building permits is provided. Andfinally, the top five places of employment for residents of the communityare listed along with the primary modes of transportation to work andthe average commute time for all workers who live in the community.100908070605040302010 3,980 / 63% 977 / 15% 1,380 / 22%Saugerties CentralCounty TaxSchool TaxTown or City TaxEmployment by IndustryAnnual Residential Building Permitssource: 2000 Census, 2009-13 American Community Surveysource: Census, 2000-2014 Building Permits SurveyBuilding permits and expenditures for new residential constructionAgriculture, forestry, fishingand hunting, and mining836420002002013175 20,000,000150125720965Construction 25,000,000 15,000,000100Transportation andwarehousing, and utilitiesFinance, insurance, realestate, and rental andProfessional, scientific,management, and wasteOther services (exceptpublic administration)Public 72006200520042003BuildingsValue454368361Place of Work & Mode of Travel94445683source: 2014 CTPP, 2009-13 American Community Survey677796Educational, health andsocial servicesArts, entertainment,recreation, accommodation 5,000,0001,2731,601Retail tradeInformation 10,000,00050252001340245752000Wholesale 0360563464Top 5 Places of EmploymentUlster County, New YorkDutchess County, New YorkGreene County, New YorkNew York City, New YorkOrange County, New YorkPercent of Total Workers82.0%5.8%4.2%3.3%1.1%Mode of Travel to WorkDrove Alone in a Car, Truck or VanCarpooled in a Car, Truck or VanUsed Public TransportationPercent of Total Workers79.9%7.9%2.2%Average Commute TimeSaugerties 6 OF 825 minutes
ABOUT THIS PROJECTThe Urban Action Agenda (UAA) is a three-year initiative led by HudsonValley Pattern for Progress (Pattern) to promote the revitalizationof urban centers throughout the nine-county Hudson Valley Region.Though it is part of the larger NYC Metropolitan Region, the HudsonValley does not have a single urban center that acts as the region’sheart but instead consists of a constellation of urban centers, large andsmall, located along the Hudson River and other historic transportationcorridors. Today, these places face a number of challenges; but someof the Hudson Valley’s urban centers are starting to turn the corner.Nationally, trends show a renewed interest in urban living. Vibrantdowntowns and waterfronts, walkable neighborhoods, access to highquality public spaces and other amenities are bringing people back tocities and other urban places.Hudson Valley Pattern for Progress sees this as an historic momentto focus attention on the revitalization of the region’s urban centers.With their existing infrastructure, these communities are best suitedto accommodate the region’s future growth. A focus on urban centersis consistent with our region’s environmental ethos and also serves toaid in the preservation of the Valley’s special landscape.York Region; and educate stakeholders through UAA reports and byperiodically hosting urban experts to speak on a variety of topics facingour communities.Twenty-five communities in the Hudson Valley have agreed to participatedirectly in the UAA initiative. As part of the project we developedthese data profiles for each of the UAA communities. Pattern isalso collaborating with each UAA community to identify revitalizationstrategies that are working and which may be transferable, uniqueamenities and assets that should be promoted, and transformativeprojects that can be advocated for under the UAA banner.The UAA is funded in part through a grant from the Ford Foundation inpartnership with the Regional Plan Association (RPA) as part of RPA’sFourth Regional Plan initiative.The UAA seeks to place the revitalization of our urban centers squarelyat the forefront of the region’s policy and investment priorities at thelocal, regional and state level. Through the UAA we will assess thestate of the region and monitor progress; convene and collaboratewith local officials, regional agencies, and organizations; use publicengagement to solicit ideas; prepare a regional strategy based onlocal and national best practices that can guide revitalization efforts;integrate UAA research with complementary activities in the larger NewAbout Hudson Valley Pattern for ProgressAbout Regional Plan AssociationCelebrating our 50th Anniversary in 2015, Hudson Valley Pattern forProgress is a not-for-profit policy, planning, advocacy and researchorganization whose mission is to promote regional, balanced andsustainable solutions that enhance the growth and vitality of theHudson Valley. Pattern brings together business, nonprofit, academicand government leaders from across as many as nine counties tocollaborate on regional issues. For more information, please visitwww.pattern-for-progress.orgRegional Plan Association is America’s most distinguished independenturban research and advocacy organization. RPA improves the New Yorkmetropolitan region’s economic health, environmental sustainabilityand quality of life through research, planning and advocacy. Since the1920s, RPA has produced three landmark plans for the region and isworking on a fourth plan that will tackle challenges related to sustainedeconomic growth and opportunity, climate change, infrastructureand the fiscal health of our state and local governments. For moreinformation, please visit www.rpa.org.CitationRegional Plan Association and Hudson Valley Pattern for Progress. November 2015. “Urban Action Agenda 2015: Municipal Profiles.”Saugerties 7 OF 8
URBAN ACTION AGENDA 2015URBAN ACTION AGENDA COMMUNITIESUrban Action Agenda CommunitiesSaugerties 8 OF 8
30% of their household income towards housing 26% of residents have a bachelor's degree or higher 61,117 is the median household income 12% of residents work within the municipality Municipality Boundary Points of Interest. Housing cost as Percent of Income source: 2008-2012 HUD CHAS Housing Wage source: National Low Income Housing Coalition changing Home Values source: 2009-13 American .