Transcription
Proceedings: The Second International Conference on Building Energy and Environment 2012Topic 3. Indoor and outdoor air quality, thermal comfort and health impact related to builtenvironmentApplication of CFD Predictions to Quantify Thermal Comfort for IndoorEnvironmentsTateh Wu1,*, Andrew D. Clark1, Gary L. Mitchell2, Chao-Hsin Lin1, and Raymond H.Horstman112*Environmental Control Systems, Boeing Commercial Airplanes, Seattle, WAFight Operation, Boeing Test & Evaluation, Seattle, WACorresponding email: ted.wu@boeing.comKeywords: CFD, Thermal Comfort, Indoor EnvironmentsSUMMARYA CFD simulation with thermal comfort calculations on a mechanically ventilated test roomis conducted. Within the CFD-simulated indoor environment, thermal comfort across thevolume was visualized. Special arrangements of the computational mesh around the bodysurface are used to investigate the effect of the local air velocity near the human body onthermal comfort. To obtain the overall thermal comfort indices for the human subject,weighting factors for the body segments were applied based on the skin blood flow. Theeffect of local air flow and heat transfer on the human body thermal comfort calculation isdemonstrated. The local PPD of the back and pelvis is much higher for the 25.4 mm shell.With the given uniform ventilation inside the test room, the effect of local air flow and heattransfer on the overall thermal comfort is not significant. More applications of using themethodology outlined in this paper are needed.INTRODUCTIONThe HVAC system to achieve thermal comfort for indoor environments can be verycomplicated due to the variation of the intended function, energy consideration, and definitionof thermal comfort, etc. To provide a thermally comfortable indoor environment, certainranges of air temperature and air velocity magnitude are the most common parameters usedby engineers when setting up the design requirements. Nevertheless, the factors, such as themetabolic rate of human activities, clothing level, thermal radiation, humidity, local air flow,local air temperature, etc., that could affect thermal comfort in indoor environments, asreported by numerous studies in the past (Fanger 1967; Fanger and Christensen 1986; Fangeret al. 1988; Fanger et al. 1985). Furthermore, the interactions among those factors toinfluence human’s thermal sensation have been continuously studied for more than half acentury (Schälin and Nielsen 2004; Hanzawa et al. 1987). As a result, various theories on thequantifying of thermal comfort in indoor environments based on human thermal regulatorymechanisms and the heat transfer between human bodies and their surroundings have beendeveloped. Among them, Fanger’s thermal comfort theory (Fanger 1967; Fanger 1982) hasbeen widely applied to various indoor environments.Computational Fluid Dynamics (CFD) has been utilized to provide the temperature andvelocity fields for various indoor environments such as buildings, and surface and air347
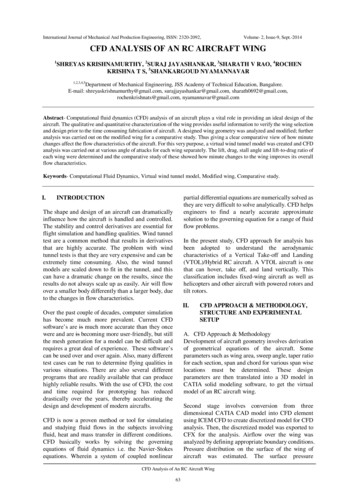
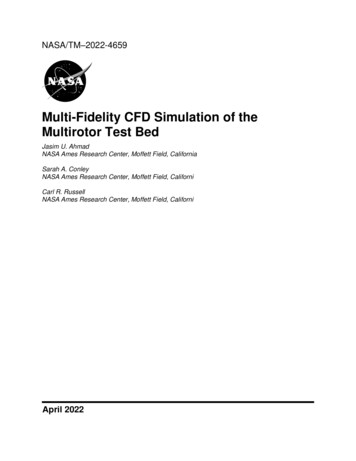
Proceedings: The Second International Conference on Building Energy and Environment 2012transportation vehicles. Those CFD predicted data can be readily applied to the quantificationof thermal comfort and hence, drive design requirements that account for the manyinteractions (Lin et al. 1992). In this study, a CFD simulation with a thermal comfort moduleon a mechanically ventilated test room was conducted. Thermal comfort within the test roomwas presented in terms of the Predicted Mean Vote (PMV) and Predicted Percentage ofDissatisfied (PPD), based on Fanger’s theory (Fanger 1967; Fanger 1982). Specialarrangements of the computational mesh around the numerical human subject in the test roomwere used to investigate the effect of the local air velocity near the human body on thermalcomfort. Due to human physiology and thermoregulation which result in the non-uniformityof a human’s skin temperature, theories on the related mechanisms have been proposed byresearchers (Parsons 1993). To take the effect of skin temperature into consideration, a locallyweighted PMV and PPD based on the blood flow at various portions of the human body toobtain the overall thermal comfort indices for the human subject is presented in this study.METHODSDescription of CFD modelingThe CFD analysis was conducted using the commercial CFD code, FLUENT. The ComputerSimulated Person (CSP, i.e. manikin) geometry was generated using a 3D scanned stereolithography (STL) geometry file of Comfortina, a thermal manikin belonging to the AalborgUniversity (Nielsen et al. 2003). The model was split into 20 zones so that each could beindividually assessed. The zones are shown in Figure 1 and based on the benchmark test forthermal comfort evaluation conducted by Aalborg University and Gävle University (Nilssonet al. 2007) with the exception for the additional neck zone.Figure 1. Various Portions of the Simulated Manikin(a) Side View(b) 3D ViewFigure 2. CFD Model of the Test Room with the Simulated Manikin inside348
Proceedings: The Second International Conference on Building Energy and Environment 2012The manikin was placed in a box defined in the benchmark test (Nilsson et al. 2007) whichhad the dimensions 2.44 m x 2.46 m x 1.2 m, where Figure 2(a) shows a cross-section andFigure 2(b) shows a 3D view. The manikin was placed 0.7m from the front of the box whenmeasured from the knee. The front of the box was defined as a uniform velocity inlet, whichis considered similar to the flow field a person is exposed to in a mixing ventilated room(Nilsson et al. 2007). Centered on the aft wall are two 0.25 m diameter exhausts located 0.6 mfrom the floor and ceiling for which all the air is assumed to exhaust (i.e. no leakage).The computational mesh for the manikin was generated using the ANSYS meshing package.The total volume mesh count for the model was 2.7 million cells. A cross-section of the meshcan be seen in Figure 3 and shows the cell count is highly concentrated around the manikin.Figure 3 also shows the magnified cross-section of the mesh where the boundary layer meshcan be seen with the surface mesh of the manikin. The boundary layer mesh has a totalthickness of 25.4 mm and eight layers. Two surface mesh shells that are 12.7 mm (0.5 inch)and 25.4 mm (1 inch) away from the body surface are created for the body thermal comfortcalculation. The surface mesh shells were separated so that each zone of the manikin wasuniquely defined.Figure 3. A Cross-Section of the CFD Volume Mesh (gray) and Surface Mesh of the Manikin(black)With the exception of the knee, all surfaces of the manikin are set to a constant heat flux sothat total heat load is 76W. All walls were set to a radiation emissivity of 0.85. The ceiling,sidewall and floor were defined as adiabatic walls. The forward face of the box was set to auniform inlet of 0.2 m/s at 22 C. Turbulence was modeled using the two equation turbulencemodel, k-ω SST, which in previous studies using the same benchmark model was found tolead to better agreement with the experimental data than the k-ε model (Martinho et al. 2008).Thermal comfort calculationAs mentioned above, one method of evaluating thermal comfort is to use the predicted meanvote (PMV) and predicted percent dissatisfied (PPD) equations based on Fanger’s theory(Fanger 1967; Fanger 1982). In this study, the calculation of thermal comfort within the testroom and thermal comfort around the computer simulated person is demonstrated by usingFanger’s theory with local air velocity magnitude, local air temperature, and local static airpressure predicted by the CFD simulation.For the thermal comfort calculation on the body surface, special meshing arrangements wereset up in the CFD model. Two of 12.7 mm (0.5 inch) thick volume meshes (prism layers)away from the manikin surface were created so that in addition to the body surface349
Proceedings: The Second International Conference on Building Energy and Environment 2012temperature, the local air velocity magnitude on the surfaces that are 12.7 mm (0.5 inch) and25.4 mm (1 inch) away from the body surface are available for the body thermal comfortcalculation. The effect of the local air velocity near the body on thermal comfort will bediscussed in the next section.RESULTSIn the CFD model, the sedentary numerical manikin is facing the inlet, where the incoming airwith a uniform air velocity magnitude of 0.2 m/s at a temperature of 22 C. On the back sideof the test room, there are two exhaust openings. Figure 4 is a streamline plot showing thegeneral airflow pattern around the manikin. The streamlines are colored by velocitymagnitude ranged from 0 to 0.5 m/s. The airflow upstream of the manikin is very uniform asexpected. The streamlines behind the manikin illustrate turbulent wakes that usually occursdownstream of a bluff body.Figure 4. Streamlines inside the Test Room and Around the Simulated Manikin(Colored by velocity magnitude with a unit of m/s)Air velocity and temperature contours are plotted on a vertical mid plane (at Z 0.6 m) andshown in Figure 5 (a) and (b). The airflow between the two legs is moving faster and then hassignificant accelerations before exiting the two outlets. Within the test room, the temperaturedistribution is quite uniform in most of area. The air behind the manikin is a slightly warmerbecause the heat dissipated from the body is moving downstream. The temperature contourson the vertical mid plane (Figure 5(b)) also show high temperature gradients on the upperback of the head and below the pelvis due to the airflow is separated at the location of theformer case and stagnant at the location of the latter case.(a) Air Velocity Magnitude (m/s)(b) Static Temperature ( C)Figure 5. Contours of Air Velocity and Temperature on the Vertical Mid Plane at Z 0.6 m350
Proceedings: The Second International Conference on Building Energy and Environment 2012As shown in Figure 6, the body surface temperatures excluding the knees are higher than thesurrounding air temperatures. It can be seen from the side view that the front surfaces of themanikin are cooler than the rear body surfaces caused by the convective effect of the supplyair direction. Similarly, the back the body surface temperature contours indicate a muchhigher temperature, around 32 C, is predicted near the armpit area, as shown in Figure 6(b).Figure 6. Contours of Body Surface Temperature ( C)With the air velocity, air temperature, and radiation temperature predicted by the CFDsimulation, a thermal comfort module implemented in the CFD post-processing was utilizedto calculate the PMV and PPD thermal comfort indices within the test room. A clothing valueof 1.0 representing typical business suit (Fanger 1982) is used. The physical activity level isassumed at a metabolic rate of 0.88 met that is equivalent to 43.741 kcal/(hr-m2). The relativehumidity is set at 50%. Figure 7 show the PMV contours on the vertical mid plane (Y 0.6 m)and the horizontal plane at 0.66 m above the floor (approximate at elbow height),respectively. The PMV plots indicate that the predicted mean vote around the manikin isbetween -1 and 0, which indicates the existence of a slightly cool thermal environment.Similarly, the PPD contours plots shown in Figure 8 indicate that most of area around themanikin is less than 15%, again an indication of the thermally comfort condition in the testroom.(a) Vertical Mid Plane at Z 0.6 m(b) Horizontal Plane at Y 0.66 m(approximate elbow height)Figure 7. Predicted Mean Vote (PMV)351
Proceedings: The Second International Conference on Building Energy and Environment 2012(a) Vertical Mid Plane at Z 0.6 m(b) Horizontal Plane at Y 0.66 m(approximate elbow height)Figure 8. Predicted Percent Dissatisfied (PPD)To further quantify the overall thermal comfort of the human body, the body surfacetemperature and the adjacent air velocity magnitude are output from the CFD model. Table 1lists the average body surface temperature, the average air velocity magnitude at 12.7 mm (0.5inch) and 25.4 mm (1 inch) away from the body surface for each of the human body portionsindentified in Figure 1.Table 1. Body Surface Temperature and Adjacent Air Velocity Magnitudes for VariousPortions of the Simulated ManikinComputer SimulatedPerson (CSP)Body ZoneBody SurfaceTemperature[C]Air Velocity at 12.7 mm Air Velocity at 25.4 mmaway from Body Surface away from Body Surface[m/s][m/s]Top of t25.70.2010.217Local and overall comfort calculation352
Proceedings: The Second International Conference on Building Energy and Environment 2012The comfort calculation from Fanger was used to evaluate the local heat balance using thefollowing: PMV 0.352e 0.042M M 0.35 43 0.061M Pa 0.032 0.42( M 50 ) 0.0023M 44 Pa 0.0014M 34 Ta 44 8 3.4 x10 f cl Tb 273 Ta 273 f cl h Tb Ta (1)whereM metabolic rate 43.741 kcal/m2-hrPa (RH/100)(11.106-0.4174Ta 0.03696(Ta)2) vapor pressure [mmHg]Ta air temperature near surface [oC]Tb body surface temperature [oC]fcl clothing area factor 1.15h 8.95V1/2 heat transfer coefficient [kcal/hr-m2-oC]V Local air velocity [m/s]PPD 100 95e 0.03353PMV4 0.2179PMV 2 (2)Weighting factors for the body segments were applied based on the skin blood flow fromParsons (Parsons 1993). The PMV for the 12.7 mm (0.5 inch) “shell” was slightly warm,toward neutral at PMV 0.043 with a predicted dissatisfied equal to about PPD 5.5 %. ThePMV for the 25.4 mm (1.0 inch) shell was slightly cooler at PMV -0.213 than that at the 12.7mm (0.5 inch) shell and consequently, with a bit more predicted dissatisfaction equal to aboutPPD 6.8 %. With the given fairly uniform air flow pattern inside the test room, the PPDbased on the 25.4 mm shell is slightly higher than the 12.7 mm shell. However, it’sinteresting to note that the local PPD for the back and pelvis is significantly higher than otherbody portions for the 25.4 mm shell due to the local airflow and heat transfer. The completecomfort tabulation is shown in Table 2.TABLE 2. Body Segment Comfort Calculation Using Comfort Equations with the Values Shownin Table 1.ComputerSimulatedPerson (CSP)Body ZoneTop of 400.0400.0400.0400.0400.1260.1261.000PMV(12.7 040.1180.1510.023PMVweighted(12.7 080.0150.0190.043PPD %(12.7 4715.445353PPDweighted %(12.7 6905.463PMV(25.4 0.0010.007-0.209-0.176-0.213PMVweighted(25.4 000.000-0.026-0.022-0.213PPD %(25.4 5.6456.860PPDweighted %(25.4 7126.796
Proceedings: The Second International Conference on Building Energy and Environment 2012DISCUSSIONUsing the CFD predictions on quantifying the thermal comfort level within the test room andfor the human body is demonstrated. The first set of thermal comfort calculations within thetest room is useful information for evaluating ventilation of indoor environments. Forexample, within a CFD-simulated indoor environment, thermal comfort across the volumecan be visualized and indicate the area of concern. For the second set of thermal comfortcalculations, the locally weighted PMV and PPD based on various portions of the manikinrepresents a more realistic human thermal sensation. The effect of local air flow and heattransfer on the human body thermal comfort calculation is demonstrated. Especially the localPPD of the back and pelvis is much higher for the 25.4 mm shell.CONCLUSIONSIn this analysis, with the given uniform ventilation inside the test room, the effect of local airflow and heat transfer on the overall thermal comfort is not significant. More applications ofusing the methodology outlined in this paper are needed. It’s recommended to use the sameapproach to evaluate thermal comfort for occupants in other CFD-simulated indoorenvironments that have a more complicated ventilation configuration.REFERENCESFanger P.O. 1967. “Calculation of thermal comfort: Introduction of a basic comfort equation,”ASHRAE Transactions, 73, Part II.Fanger P.O. and Christensen N.K. 1986. “Perception of draught in ventilated spaces,”Ergonomics, 29:2, pp. 215-235.Fanger P.O., Melikov A.K., Hanzawa H., and Ring J. 1988. “Air turbulence and sensation ofdraught,” Energy and Buildings, 12, pp. 21-39.Fanger P.O., Ipsen B.M., Langkilde G., Olesen B.W., Christensen N.K., and Tanabe S. 1985.“Comfort limits for asymmetric thermal radiation,“ Energy and Buildings, 8, pp. 225-236.Fanger P.O. 1982. Thermal Comfort. Robert E. Krieger Publishing Co.Hanzawa H., Melikov A.K., and Fanger P.O. 1987. “Airflow characteristics in the occupiedzone of ventilated spaces,” ASHRAE Transactions, 93:1, pp. 524-539.Lin C.H., Han T., and Koromilas C.A. 1992. “Effects of HVAC Design Parameters onPassenger Thermal Comfort,” SAE Technical Paper Series 920264.Martinho N., Lopes A. and Silva M. 2008. “CFD Modeling of Benchmark Tests for FlowAround a Detailed Computer Simulated Person,” The 7th International Thermal Manikinand Modeling Meeting – University of Coimbra, Portugal.Nielsen P.V., Murakami S., Kato S., Topp C., and Yang J.-H. 2003. Benchmark Tests for aComputer Simulated Person. ISSN 1395-7953 R0307. Indoor Environmental Engineering,Aalborg University.Nilsson H.O., Brohus H. and Nielsen P.V. 2007. Benchmark Test for Computer SimulatedPerson – Manikin Heat Loss for Thermal Comfort Evaluation. Aalborg University andGävle University.Parsons K.C. 1993. Human Thermal Environments. Taylor & Francis, London, pp. 23-26.Schälin A. and Nielsen P.V. 2004. “Impact of turbulence anisotropy near walls in roomairflow,” Indoor Air, Vol. 14, Issue 3, pp. 159-168.354
With the air velocity, air temperature, and radiation temperature predicted by the CFD simulation, a thermal comfort module implemented in the CFD post-processing was utilized to calculate the PMV and PPD thermal comfort indices within the test room. A clothing value of 1.0 representing typical business suit (Fanger 1982) is used.