Transcription
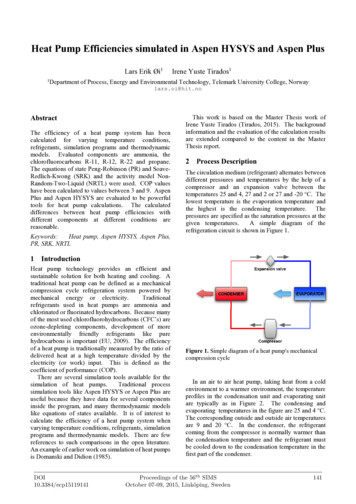
Heat Pump Efficiencies simulated in Aspen HYSYS and Aspen PlusLars Erik Øi11Irene Yuste Tirados1Department of Process, Energy and Environmental Technology, Telemark University College, Norwaylars.oi@hit.noAbstractThe efficiency of a heat pump system has beencalculated for varying temperature conditions,refrigerants, simulation programs and thermodynamicmodels. Evaluated components are ammonia, thechlorofluorocarbons R-11, R-12, R-22 and propane.The equations of state Peng-Robinson (PR) and SoaveRedlich-Kwong (SRK) and the activity model NonRandom-Two-Liquid (NRTL) were used. COP valueshave been calculated to values between 3 and 9. AspenPlus and Aspen HYSYS are evaluated to be powerfultools for heat pump calculations. The calculateddifferences between heat pump efficiencies withdifferent components at different conditions arereasonable.This work is based on the Master Thesis work ofIrene Yuste Tirados (Tirados, 2015). The backgroundinformation and the evaluation of the calculation resultsare extended compared to the content in the MasterThesis report.2 Process DescriptionThe circulation medium (refrigerant) alternates betweendifferent pressures and temperatures by the help of acompressor and an expansion valve between thetemperatures 25 and 4, 27 and 2 or 27 and -20 C. Thelowest temperature is the evaporation temperature andthe highest is the condensing temperature. Thepressures are specified as the saturation pressures at thegiven temperatures.A simple diagram of therefrigeration circuit is shown in Figure 1.Keywords:Heat pump, Aspen HYSYS, Aspen Plus,PR, SRK, NRTL1 IntroductionHeat pump technology provides an efficient andsustainable solution for both heating and cooling. Atraditional heat pump can be defined as a mechanicalcompression cycle refrigeration system powered bymechanical energy or electricity.Traditionalrefrigerants used in heat pumps are ammonia andchlorinated or fluorinated hydrocarbons. Because manyof the most used chlorofluorohydrocarbons (CFC’s) areozone-depleting components, development of moreenvironmentally friendly refrigerants like purehydrocarbons is important (EU, 2009). The efficiencyof a heat pump is traditionally measured by the ratio ofdelivered heat at a high temperature divided by theelectricity (or work) input. This is defined as thecoefficient of performance (COP).There are several simulation tools available for thesimulation of heat pumps.Traditional processsimulation tools like Aspen HYSYS or Aspen Plus areuseful because they have data for several componentsinside the program, and many thermodynamic modelslike equations of states available. It is of interest tocalculate the efficiency of a heat pump system whenvarying temperature conditions, refrigerants, simulationprograms and thermodynamic models. There are fewreferences to such comparisons in the open literature.An example of earlier work on simulation of heat pumpsis Domanski and Didion (1985).DOI10.3384/ecp15119141Figure 1. Simple diagram of a heat pump's mechanicalcompression cycleIn an air to air heat pump, taking heat from a coldenvironment to a warmer environment, the temperatureprofiles in the condensation unit and evaporating unitare typically as in Figure 2. The condensing andevaporating temperatures in the figure are 25 and 4 C.The corresponding outside and outside air temperaturesare 9 and 20 C. In the condenser, the refrigerantcoming from the compressor is normally warmer thanthe condensation temperature and the refrigerant mustbe cooled down to the condensation temperature in thefirst part of the condenser.Proceedings of the 56th SIMSOctober 07-09, 2015, Linköping, Sweden141
Heat pump efficiencies simulated with Aspen HYSYS and Aspen Plus3 Thermodynamic ModelsFigure 2. Temperature profiles in the evaporator andcondenser for low difference temperature conditions.The evaluated components are ammonia, R-11, R-12,R-22 and propane. The CFC components are notaccepted as refrigerants in heat pumps any longer, butthey are relevant because they have been used in manyheat pump applications, and new refrigerantscomponents will be compared against the CFCcomponents. The explanations for the abbreviations forthe different refrigerant components (the R-numbers)can be found e.g. in an EU report on ozone layerdepletion (EU, 2009). The equations of state PengRobinson (PR) and Soave-Redlich-Kwong (SRK) andthe activity model Non-Random-Two-Liquid (NRTL)were used in the process simulation programs AspenHYSYS and Aspen Plus.The coefficient of performance (COP) is anexpression of the efficiency of a heat pump. Thecoefficient of performance for a heat pump is the ratioof the energy transferred for heating to the input energyused in the process. (1)In equation (1) QC is the heat output from the condenser,QE is the heat input from the evaporator and W is thepower supplied to the compressor. If there is no heatloss the work added equals the difference between theheat output and the heat input.In this work, it is assumed that the refrigerant loopoperates at a specified condensation and evaporationtemperature. Because pure components are used in thiswork, the evaporating and condensing pressures are thesaturation pressures. The expansion valve is assumed tooperate adiabatically and except of that it is assumed nopressure drops in the circulation loop. The compressoris assumed to have the default adiabatic efficiency of0.75. A motor or motor efficiency is not included in thecalculations, and if a motor efficiency should beincluded, this would reduce the COP slightly. Version8.0 of Aspen Plus and Aspen HYSYS have been used.1423.1 General about Property CalculationsTo calculate the temperature (T), pressure (P or p),specific volume (v), heat (Q) or work (W) for differentconditions in process simulation programs like AspenPlus and Aspen HYSYS, there are thermodynamicmodels, model parameters and calculation proceduresavailable. In other tools for heat pump calculations,thermodynamic property data for the components aredirectly available as correlations in data banks. Thesedata can be based on direct measurements or they can bebased on thermodynamic models.In the addition to the calculation of energy functionsas enthalpy (H) and entropy (S), the key thermodynamicproperty calculation performed in a simulation is thephase equilibrium. Phase equilibrium is calculated usingthe fugacity (which is a measure of the tendency of acomponent to leave its phase). Equilibrium is achievedwhen the fugacity of the component is equal in allphases. In this work only pure components are treated,so φi is the fugacity of the actual component.There are two common methods for representing thefugacity coefficients from the phase equilibriumrelationship in terms of measurable state variables, theequation of state method and the activity coefficientmethod as explained in Smith et al. (2005).Equation of state methods use the various equationsof state from chemical engineering thermodynamics tocalculate the equilibrium conditions. The two mostfamiliar are PR (Peng and Robinson, 1976) and SRK orSoave-Redlich-Kwong (Soave, 1972). Both of them arecubic equations of state and they only need criticalproperties and ideal gas enthalpies for each componentto calculate all the necessary thermodynamic propertiesfor equilibrium calculations.An activity coefficient method is a more empiricalapproach to calculate the equilibrium. This method usesvarious relationships to calculate the liquid phaseactivity coefficient and then the fugacity coefficient. Acommon activity model is NRTL or Non-Random TwoLiquid (Renon and Prausnitz, 1968). In Aspen Plusideal gas enthalpy and heat of vaporization correlationsare used to calculate enthalpies. The NRTL model is thesame in Aspen HYSYS and Aspen Plus as in the originalpaper. The results from an activity model are dependenton the parameter values for the components andenthalpy correlations. These parameter values may bedifferent in different program versions.3.2 General about Equations of StateEquation of states are often expressed by critical orreduced temperatures and pressures. The criticaltemperature (Tc) and pressure (Pc) for a pure componentare component characteristics. Reduced properties (Trand Pr) are defined as the property divided by the criticalProceedings of the 56th SIMSOctober 07-09, 2015, Linköping, SwedenDOI10.3384/ecp15119141
Session 4B: Session Bproperty. R is the gas constant. The acentric factor ω isalso a component characteristic which is defined inequation (2). 1 [ 10 ] 0,7(2)A widely used equation of state is the SRK model(Soave, 1972). This model is described by equation (3)with a (the pressure correction parameter), b (thevolume correction parameter), α and m defined below. ( ) 0,42748 2 2 (3)3.3 Aspen HYSYS Property DocumentationThe equations used in Aspen HYSYS are shown inequations (5) to (10). They are from the documentationof an earlier version of the Aspen HYSYS program(Hyprotech, 2003). This documentation is morecomplete than for the later versions. It is assumed thatthe equations used are the same also in Aspen HYSYSversion 8.0. The equations include mole fractions (xivalues) and kij parameters (component interactioncoefficients) which are not used in this work with onlypure components.SRK:0,08664 1 2 1 1 2 , 1 0.48508 1.55171 0.15613 2 1 121 2 0.37464 1.54226 0.26992 2The coefficients in the m equation are from the originalwork of Peng and Robinson.There are numerous of other equation of state andactivity coefficient models, and some of them areavailable in the Aspen HYSYS and Aspen Plusprograms. The PR, SRK and NRTL models are usedbecause they are well-known to be simple and efficient.There are some equations of state which are furtherdevelopments of the SRK and PR equations of state.One variation is from Peneloux (1982) where a volumecorrection c is added to every volume in the SRK or PRequations. This is used in the SRK and PR versions inthe program Aspen Plus.In this work, the default parameter values from theAspen HYSYS and Aspen Plus programs for the PR,SRK and NRTL models are used. There are some smalldifferences between the two programs in the modelequations and the parameter values.DOI10.3384/ecp15119141 1 1 ,(5)0,08664 0,5 1 1 0,42748 2 2 2 1 1 2 0,48 1,574 0,176 2(4)0,45724 2 20,07780 These coefficients in the m equation are from theoriginal work of Soave and can be different in otherversions.A similar equation of state shown in equation (4) wasdeveloped by Peng & Robinson (1976) with moreaccurate liquid density predictions. PR: , 1 1 1 ,(6)0,077796 0,5 1 1 0,457235 2 2 2 1 1 2 0,37464 1,54226 0,26992 2It can be noted that the m coefficients in equation (6)are equal to the original PR coefficients in equation (4).The coefficients in equation (5) are not equal to theoriginal SRK coefficients in equation (3).Enthalpy and entropy departure calculationsThe principles for the numerical calculation of theenthalpy and entropy calculation (based on residualproperties) can be found in Smith et al. (2005). TheseProceedings of the 56th SIMSOctober 07-09, 2015, Linköping, Sweden143
Heat pump efficiencies simulated with Aspen HYSYS and Aspen Plusnumerical calculations (and also fugacity calculations)may be different in Aspen Plus and Aspen HYSYS.The enthalpy and entropy departure calculations usedin Aspen HYSYS are shown in equations (7) and (8). Zis the compression factor (defined by RT/Pv).Superscript ID is for ideal gas, and subscript 0 is areference state. 0 1 1 0 Fugacity coefficient 1 1 (7)(8) ( PR: 1 ,0,5 · 2 0,5 1 1 ( )( ) 1 1 1 144 1 ,(11)0,08664 0,42747 2 2 1 1 1 2 2 0,48508 1,5517 0,15613 2 , 10,50,07780 0,5 1 1 0,45724 2 2 2 0,37464 1,54226 0,26992 2 , 1 0,40768 (0,29441 ) 0,5 2 1 (10)0,5 2 1 SRK: (12) 1 1 2 1,5 ( 1) · 2 , 1 1 ( 1) 1 3.4 Aspen Plus Property DocumentationThe equations used in Aspen Plus are shown in equation(11) to (14). The equations are taken from thedocumentation of an earlier version of the Aspen Plusprogram (Aspentech, 2001). As for Aspen HYSYS it isassumed that these are the equations used also for AspenPlus version 8.0. , 10,5 2 0,5 1 1 1 (9) ( ) ) SRK: PR: These versions of SRK and PR are not equal to theoriginal versions. A volume translation concept and thec parameter introduced by Peneloux and Rauzy (1982)is used to improve the molar liquid volume calculatedfrom the cubic equation of state. (0,29441 ) 0,40768 Enthalpy and entropy departure calculationsThe enthalpy and entropy departure calculations use thefollowing equations (13) and (14). Subscript m is formixture conditions and superscript ig is for ideal gasconditions. ( 1) (13)(14)4 Specifications and Calculation Principle4.1 SpecificationsWhen calculating the COP for a process as in Figure 1in Aspen HYSYS or Aspen Plus, only a fewspecifications are necessary. A circulation flow must bespecified, but can be specified arbitrarily as e.g. 1 kg/h.If it assumed that the evaporation and condensing is atsaturation conditions, the only necessary specificationsProceedings of the 56th SIMSOctober 07-09, 2015, Linköping, SwedenDOI10.3384/ecp15119141
Session 4B: Session Bare the evaporating temperature and condensingtemperature.It is not necessary to calculate the conditions outsidethe refrigeration circuit to calculate the COP. The airamounts in Figure 2 can be calculated if all the airtemperatures are specified. Including an efficiency lossin the compressor motor and including the power neededfor air flow in Figure 2 would reduce the calculated COPvalues slightly.4.2 Calculation PrincipleThe calculation starts with a pure component flow at thelowest (evaporating) temperature at saturated vapourconditions. Then the vapour is compressed with adefault adiabatic efficiency to the pressure which givescondensation at the highest (condensing) pressure. Thecompressed gas is cooled in a condenser to saturatedliquid. Then the liquid is expanded in an expansionvalve at adiabatic conditions. The expanded gas/liquidmixture is heated in the evaporator to the original stateof saturated vapour. The COP is calculated as thecondenser heat divided by the power consumption in thecompressor.Ammonia is the component with the highest COP(together with R-12) for the lowest temperaturedifference. As can be seen in Figure 3, all the models inAspen Plus gave similar COP results for the lowesttemperature difference, while Aspen HYSYS gavehigher COP values (about 8.2) than Aspen Plus (about7.5) when using the models PR and SRK.Figure 4. Calculated COP values for R-11 for differenttemperature conditions, programs and models.5 ResultsThe results are shown in Figures 3 to 7, one figure foreach component. In all the figures the results are shownfor 3 temperature differences using 3 models and 2simulation tools.All the models in both simulation programs show asexpected a decrease in COP with increase in temperaturedifference for all the cases.For some of the components, the deviations in COPare large for the same model in different programs.These differences are larger than expected.For R-11 there were very few deviations between themodels, as seen in Figure 4, but there were slightdeviations between COP values calculated with AspenPlus and Aspen HYSYS. Aspen HYSYS calculatedslightly higher COP values for most of the cases.Figure 5. Calculated COP values for R-12 for differenttemperature conditions, programs and models.Figure 3. Calculated COP values for ammonia fordifferent temperature conditions, programs and models.DOI10.3384/ecp15119141R-12 (together with ammonia) gave the highest COPfor the lowest temperature difference. For the lowtemperature difference, Aspen Plus and Aspen HYSYSgave very similar COP results close to 8.0 as seen inProceedings of the 56th SIMSOctober 07-09, 2015, Linköping, Sweden145
Heat pump efficiencies simulated with Aspen HYSYS and Aspen PlusFigure 5. Using NRTL, Aspen Plus gave 8.0, whileAspen HYSYS gave a lower value (7.5).Figure 6. Calculated COP values for R-22 for differenttemperature conditions, programs and models.R-22 gave the highest COP values for the highesttemperature difference. For the high temperaturedifference, the COP results in Figure 6 were similar, allbetween 3.4 and 3.9. The larges deviations werebetween the simulation programs Aspen Plus and AspenHYSYS for the PR and SRK models. For PR and SRKAspen HYSYS calculated the highest COP values.When using the NRTL model, Aspen Plus calculated aslightly higher COP than Aspen HYSYS.Figure 7. Calculated COP values for propane for differenttemperature conditions, programs and models.The COP values in Figure 7 calculated with propanewere only slightly less than for the more usualrefrigerants. The COP value calculated with AspenHYSYS using NRTL for the lowest temperaturedifference was very high (9.2), but all the other COPvalues for the same conditions was close to 8.0.1466 DiscussionThe calculated absolute values (COP values) areprobably high compared to actual values for heat pumpsin operation. Including motor efficiency, heat losses andpressure drops would reduce the calculated COP values.It is however expected that the calculated differences arereasonable. The main purpose of this work is to evaluatethese differences.The models PR and SRK have obtained similarvalues as expected when calculated in the samesimulation program. Both are equations of state usingthe same parameters, Tc, Pc and ω.The model NRTL gave similar results in most of thecases compared to values obtained with PR and SRK,but there were some deviations. As NRTL is not anequation of state method, this difference could bereasonable.Differences between Aspen Plus and Aspen HYSYSfor the same model can be seen. For the PR modelslightly higher values are calculated in Aspen HYSYSthan in Aspen Plus. However, for the case of NRTLmodel there is not a clear trend in the deviations.The explanation of deviations in PR and SRK is alsodifficult, but some differences in the equations of themodels have been found which could be the reason fordeviations.The parameter values of the critical data (Tc, Pc andω) were checked to be the same in Aspen Plus andAspen HYSYS, so this cannot explain the differences.The coefficients in the m equations for SRK are slightlydifferent from Aspen Plus to Aspen HYSYS. Thecoefficients are however equal for the PR equations, sothis can not explain the difference in case of the PRequation.The most clear difference between the AspenHYSYS versions and Aspen Plus versions of SRK andPR is that the Aspen HYSYS versions are close to theoriginal SRK and PR versions while the Aspen Plusversions use a volume correction as suggested byPeneloux (1982). These corrections influence theequation of state, the equations for calculation ofenthalpy and entropy corrections and the calculation ofthe fugacity coefficients. This may explain thedifferences between COP values calculated by AspenPlus and Aspen HYSYS.In development of new refrigerants, one trend is touse a mixture of different components. The simulationsin Aspen HYSYS and Aspen Plus in this work can beeasily extended to multicomponent simulations. Theuncertainty in the calculated COP values will probablybe slightly higher due to higher uncertainty in thephysical property calculation methods. When using theSRK and PR models, it is expected that thethermodynamic properties are calculated quiteaccurately also for mixtures.It is assumed thatcalculating heat pumps with a mixture of refrigerantsusing Aspen HYSYS or Aspen Plus with the SRK or PRProceedings of the 56th SIMSOctober 07-09, 2015, Linköping, SwedenDOI10.3384/ecp15119141
Session 4B: Session Bmodel will give reasonable results. A reasonableextension of this work is to evaluate the heat pumpefficiency for different mixtures at different conditions.7 ConclusionCOP values have been calculated to values between 3and 9. The highest COP was calculated for the lowesttemperature difference. The components giving thehighest COP value between the temperatures 22 and 7 C were ammonia and R-12, and R-22 gave the highestCOP between -15 and 22 C. Propane (which is not aCFC) gave slightly lower COP values than the othercomponents.The differences between the thermodynamic modelsand the different programs were normally low.However, some differences between Aspen Plus andAspen HYSYS for the same model were calculated. Thecalculated deviations between the same models usingdifferent programs are difficult to explain. Differentequations and model parameters in different programsmay explain differences between the same models indifferent programs.Aspen Plus and Aspen HYSYS are powerful tools forheat pump calculations. The calculated differencesbetween heat pump efficiencies with differentcomponents at different conditions are thought to bereasonable.Symbol ListSymbolabcGHkmP, pQRSTvWxZαφDescriptionParameter in PR and SRKParameter in PR and SRKParameter in PR and SRKSpecific Gibbs Free EnergySpecific enthalpyBinary parameter in PR and SRKParameter in PR and SRKPressureHeatGas constantSpecific entropyTemperatureMolar volumeWorkMole fractionCompressibility factorParameter in PR and SRKFugacity ], [ºC][m3/mol][J/s][-][-][-][-]ωAcentric ipts:CCondensercCriticalEEvaporatoriGeneral componentIDIdealigideal gasjGeneral componentmmixturerReducedsatSaturated0Reference stateReferencesAspenTech: Aspen Physical Property System 11.1, 2001.P.A. Domanski and D.A. Didion: Simulation of heat pumpoperating with nonazeotropic mixture. ASHRAE TechnicalData Bulletin, 91(3):54, 1985.EU Parliament: Regulation (EC) No 1005/2009 on Substancesthat Deplete the Ozone Layer, 2009.Hyprotech: HYSYS Simulation Basis, 2003.A. Peneloux, E. Rauzy and R. Freze: A Consistent Correctionfor Redlich-Kwong-Soave Volumes: Fluid PhaseEquilibria, 8:7-23, 1982.D.Y. Peng and D.B. Robinson: A New Two-ConstantEquation of State. Industrial and Engineering ChemistryFundamentals, 15(1):59-64, 1976.H. Renon and J.M. Prausnitz: Local compositions inThermodynamic Excess Functions for Liquid Mixtures.A.I.Ch.E. Journal, 14(1):135-144, 1968.J.M. Smith, H.C. Van Ness and M.M. Abbott. Introduction toChemical Engineering Thermodynamics, 7th ed., McGrawHill, 2005.G. Soave: Equilibrium Constants from a Modified RedlichKwong Equation of State. Chemical Engineering Science,27:1197-1203, 1972.I.Y. Tirados: Heat pump efficiencies simulated with AspenHYSYS and Aspen Plus. Master Thesis, TelemarkUniversity College, 2015.Proceedings of the 56th SIMSOctober 07-09, 2015, Linköping, Sweden147
the program Aspen Plus. In this work, the default parameter values from the Aspen HYSYS and Aspen Plus programs for the PR, SRK and NRTL models are used . There are some small differences between the two programs in the model equations and the parameter values. 3.3 Aspen HYSYS Property Documentation The equations used in Aspen HYSYS are shown in