Transcription
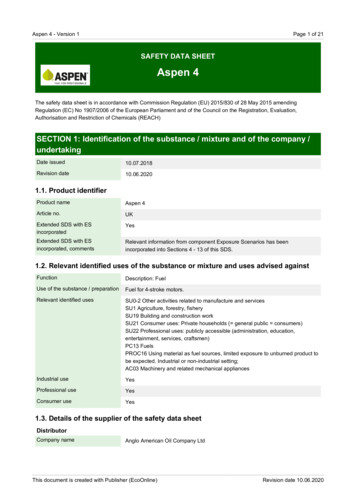
INTERNATIONAL JOURNAL OF MATHEMATICAL MODELS AND METHODS IN APPLIED SCIENCESVolume 9, 2015An Aspen Plus tool for simulation oflignocellulosic biomass pyrolysis via equilibriumand ranking of the main process variables*A.Visconti, M. Miccio,D. Juchelkováthe most important ones are combustion, gasification,pyrolysis and, more recently, torrefaction. In the last twoof the list, the leading factor is heat, which convertsbiomass into other substances. Pyrolysis is a modernthermo-chemical decomposition process at elevatedtemperatures in the absence of oxygen, i.e., in an inertatmosphere. This process is now being used quite heavilyin the chemical industry, for example to producemethanol, activated carbon and char from wood or cokefrom coal; anyway, besides the solid residue called charalso valuable gaseous and liquid products are obtainedwith pyrolysis. The char is usually referred to as the massof solid remaining after the pyrolysis, including both thatcoming from the reactor and that captured in the particleseparator (Fig. 1), i.e., cyclone or filter.The gas containsmostly H2, CO, CO2, H2O and CH4, whereas the liquid,usually called bio-oil, is a complex mixture ofhydrocarbons. A simplified process scheme for biomasspyrolysis is in Fig. 1.There is some confusion in literature about themeaning of the word “bio-oil”, for which it is possible tofind different synonyms (tar, pyrolytic liquids, bio-crude,etc.). The most used definition of tar refers to the wholeliquid fraction, that is, organic compounds pyrolyticwater feedstock moisture (see[5]). Pyrolytic gas mixedto the carrier gas is obtained once the bio-oil is removedin the condensers (Fig. 1).At the heart of a pyrolysis process there is the reactor.Although it probably represents only about 10-15% of thetotal capital cost of an integrated system, most of researchand development has focused on testing and developingdifferent reactors on a variety of feedstocks.The most popular technological options for thepyrolysis reactor are the bubbling fluidized bed (BFB),the circulating fluidized bed (CFB), the transported bed,the fixed bed (FB), the rotating cone [6], the ablativereactor [8], the screw and the auger reactors [8]. Someauthors, while looking at the results got with biomassgasification, have also investigated the effect of somecommon catalysts like the nickel-based ones [10].Vegetative or lignocellulosic biomass, also known asphytomass, is composed primarily of cellulose,hemicellulose and lignin, along with lesser amounts ofextractives (e.g., terpenes, tannins, fatty acids, oils andresins), moisture and mineral matter [11].Several research groups studied the pyrolysis ofbiomass on the basis of those three main components.Abstract—Pyrolysis of non-fossil fuels is raising a growinginterest in the nowadays scenario for the alternative supply ofenergy, fuels and chemicals. Biomass is among the most widelyavailable and technologically promising candidate feedstocks.For simulation purposes and process design goals, kinetic-basedmodels promise to be quite accurate in literature; however, theyare computationally intensive and, more importantly, applicableonly when kinetic data are available for the specific feedstockand pyrolysis equipment. Here, a different modeling approach isfollowed by considering that the pyrolysis reactor is under thethermodynamic equilibrium; then, the authors take advantage ofthe capabilities provided by the Aspen Plus software.Therefore, this work is focused on the development of an inputoutput reactor model to simulate pyrolysis of a lignocellulosicbiomass and to predict the effects of the main process variables.The trends of the predicted results as a function of the processoperating variables are generally in accordance with those thatare experimentally evident and published in literature. A limitedcomparison is provided against the experimental results ofHonus[25]. It has to be noted that the Aspen code could notpredict the composition of the liquid residue, i.e., tar.Keywords—Biomass, Pyrolysis, Aspen Plus , Simulation,Equilibrium, Gibbs free energy, CharI. INTRODUCTIONBiomass-derived sources accounted for 10% of totalenergy production worldwide in 2009, whereasbiomass was the predominant energy source forapproximately 2.7 billion people facing energy technological objectives are those of making morefeasible, acceptableand efficient biomass-to-energyapplications: as a consequence, research is focusing moreand more on them[[2],[3],[4],[5]].The biomass conversion processes can be grouped inthree main categories: thermochemical, chemical andbiochemical ones. Among the thermochemical processesA. Viscontiis a scholarship holder at theDepartment of IndustrialEngineering of the University of Salerno. He has been a visiting Erasmustudent at Faculty of Mechanical Engineering, Department of alexandrus89@hotmail.itM. Miccio is Associate Professor at theDepartment of IndustrialEngineering of the University of Salerno, Via Giovanni Paolo II, 132 –84084 Fisciano (SA), ITALY. He is the corresponding author withphone: 39-089-964148;fax: 39-089-968781;e-mail:mmiccio@unisa.itD. Juchelková is the Head of theDepartment of Energy, Faculty ofMechanical Engineering, ,VŠB - Technical University of Ostrava, 17.listopadu 15, Ostrava –Poruba, CZECH REPUBLIC. Email:dagmar.juchelkova@vsb.czISSN: 1998-014071
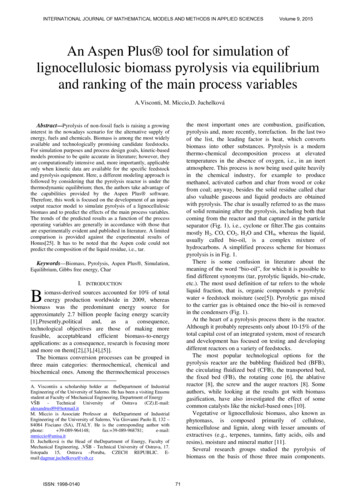
INTERNATIONAL JOURNAL OF MATHEMATICAL MODELS AND METHODS IN APPLIED SCIENCESVolume 9, 2015Fig. 1: simplified process scheme for biomass pyrolysis.a facility for using an equation-based approach in someof its routines, which permits convenient use of designspecifications in process modelling.In this work, the simulation of the steady-state,continuous pyrolysis of a lignocellulosic biomassfeedstock has been attemptedvia Aspen Plus . Precisely,the description of pyrolysis follows anequilibriumbased,non-stoichiometric approach, that is, no particularreaction is specified. Apart from pyrolysis, a number ofelementary steps are identified and represented as modelblocks for simplified process simulation (Fig. 2).These are the main assumptions on which this model isbased: The blocks are implicitly considered to be zerodimensional and are regarded as perfectly insulated(e.g., the heat losses are neglected). Perfect mixing and uniform temperature areassumed in each block Residence time is long enough to reach thethermodynamical equilibrium in the reaction blocks. Reaction pathways and formation of intermediatesare not taken into account.Raveendram et al. [12] investigated the pyrolysischaracteristics of biomass components in athermogravimetric analyzer and a packed-bedpyrolyzer;they found no detectable interactions amongthe components during pyrolysis in each experimentalsetup.Yang et al. [13] also observed negligibleinteractions among the three biomass components in theirstudy, when using a thermogravimetric analyzer. On theother hand, Worasuwannarak et al. [14] studied thepyrolysis behavior of cellulose, xylan, lignin andmixtures by TG-MS technique and observed significantinteractions between cellulose and lignin that caused asuppression of liquid product formation and an increasein the yield of solid residue. Wang et al. [15] alsoreported cellulose-lignin interactions, as well ashemicelluloses-lignin interactions, while they reportedthat hemicelluloses and lignin did not seem to affect eachother during pyrolysis in a thermogravimetric analyzer.More recently, Wang et al. [16] studied the interactionsof the biomass components in both a TG-FTIR and anexperimental pyrolyzer. When using mixtures of thebiomass components, they reported no significantdifferences between the experimental and calculatedTG/DTG curves, but differences in the evolution curvesof the main products (levoglucosan, 2-furfural, aceticacid and 2,6-dimethoxy phenol) were apparent. Inaddition, the mixed samples exhibited a commontendency to form less liquid and more gas products thanwhat the calculations predicted. So, although thesestudies did not prove the complete independence of thethree main biomass components on each other duringthermal degradation, many authors studied the pyrolysisof hemicelluloses, cellulose and lignin individually andsome of them proposed kinetic schemes as a compromisecapable of describing satisfactorily the pyrolysis of avariety of biomasses [17],[18],[19],[20],[21],[22].The flowsheet of the model developed with AspenPlus is represented in Fig. 2.The similarity is readily noticed with the simplifiedscheme of pyrolysis represented in Fig. 1. In fact, in bothfigures, the process can be divided in two sections: thefirst of pyrolysis/reaction and the second ofseparation/recovery.The actual reaction section, in which drying, primaryand secondary pyrolysis of feedstock take place, ismodelled by the first three blocks, that is, the DRYER,the DECOMP and the EQUIL in Fig. 2. Actually, theyare just three reactor blocks from the reactor library ofAspen Plus .The first block called DRYER is an “RStoic block”,takes as input the wet biomass, named FEED, andsimulates the drying stage. This block requires that theamount of removed water (per unit mass of total feed,excluding inerts) must be specified.The second block, called DECOMP, is an “RYieldblock” and takes as input the dried biomass, namedII. PROBLEM FORMULATIONAspen Plus [23] is a comprehensive chemical processmodelling system, used by both academy and industry,for design, simulation, process improvement andoptimization.Aspen Plus [23]has advanced and dedicatedfunctionalities, such as detailed heat exchanger design,dynamic simulation, batch process modelling. It also hasISSN: 1998-014072
INTERNATIONAL JOURNAL OF MATHEMATICAL MODELS AND METHODS IN APPLIED SCIENCESVolume 9, 2015Fig. 2: flowsheet of the pyrolysis process implemented in Aspen Plus .DRYFEED. This block requires that the yields of theproducts (per unit mass of total feed, excluding any inertcomponents) must be specified. DECOMP predicts thedecomposition, at fixed temperature and pressure, of thefeedstock into reference components that are: C (fixedcarbon), ash, H2O, H2, Cl2, S, O2 and N2.For each of the blocks, i.e., DRYER and DECOMP, anexternal, user-supplied FORTRAN subroutine carries outthe mass balance calculations and supplies the rightvalues as inputs.The third block, which completes the pyrolysis section,is an“RGibbs block” named EQUIL. This block takes ininput the decomposed biomass and the inert gas feed,named respectively DECPROD and INERTGAS. TheRGibbs block uses Gibbs free energy minimization withphase splitting to calculate thermodynamic equilibriumand it does not require reaction stoichiometry. Thecriteria for thermodynamic equilibrium affirm that anisothermal and isobaric chemical system is at equilibriumwhen the Gibbs free energy is minimized. Theminimization is obtained by solving a nonlinearconstrained problem using a penalty function method(SUMT) [24]. Within this simulation the EQUIL blocktakes as input the reference componentscoming from theDECOMP block and the inert gas and, by minimizing theGibbs free energy, it calculates the simultaneous phaseand chemical equilibrium at fixed temperature andpressure; as output, there are the species that have beenspecified in the EQUIL block as “possible products”.The reference biomass feedstock here considered is thesame tested in the pyrolysis experiments of Honus[25]. ed it into the pyrolysis reactor in theform of pellets with particle sizes less than 20 mm. TableI shows the ultimate and proximate analysis of thisbiomass.A necessary input to perform the simulation is also thesulfur analysis, with further specification of the relativequantities of pyritic, sulfate and organic sulfur. Actually,it was not available in Honus[25]; therefore, it has beensupposed that the sulfur within the biomass is equallydistributed among these three species. Table II reports thesulfur distribution among the three sulfuric species.Table III summarizes the reference processingISSN: 1998-0140conditions of the pyrolysis model.The operating variablesare the pyrolysis temperature, pyrolysis pressure, oxygencontent in the inert gas stream, inert gas flow rate,temperature of the inert gas stream, biomass feed rate andfeedstock chemical composition.Table IV shows values and variation imposed to eachoperating variable in the simulations.Concerning gas properties, although the status of idealgas could be chosen because of high temperature and lowpressure, the Peng-Robinson method has been preferredbecause it is based on a cubic equation of state, which cantake in account possible non-ideal behaviors [26].For what concerns the results predicted by thesimulation, the focus has been put on the most relevantones, which are: mass yields of char, tar and gas produced relative concentrations of CO, CO2, H2, CH4 andH2O in the pyrolysis gas carbon fraction in the pyrolized solids pollutant concentrations in the pyrolysis gas higher heating value of the pyrolized char gas lower heating value net heat duty to the pyrolysis reactorTable I: ultimate and proximate analyzes of the sample oflignocellulosic biomass and other two lesFixed CAsh73Ultimate analysiswt. % d. b.BiomassTyresBrown .440.0643.980.0124.58Proximate analysiswt. % d. b.(except moisture)BiomassTyresBrown 56.115.70
INTERNATIONAL JOURNAL OF MATHEMATICAL MODELS AND METHODS IN APPLIED SCIENCESTableII: sulfur distribution in the sample of lignocellulosicbiomass.ComponentPyritic SSulfate SOrganic SSulfur analysiswt. % d. ition (N2-freemole fractions) with temperature ofthese five leading species.From this graph it is readily seen how the amounts ofH2 and CO increase with temperature,whereas theopposite trend is observed for CO2, CH4 and H2O. This isthe trend found and confirmed during several pyrolysisand gasification experiments of biomass [25]-[27].The following well-known reactions can explain thetrends exhibited in Fig. 3:Brown coal0.020.020.02Table III: reference input data to the ASPEN pyrolysis model.TPressureOtherBlocks( therStreams( C)(bar)ratecomp.inputsSeeSizesprox.up toFEED25150 kg/hand ult.20analysesmm0.599% N2,INERTGAS251kg/min1% O2CH4(g) H2O(g) CO(g) 3H2(g)reaction 1C(s) CO2(g) 2CO(g)reaction 2C(s) H2O(g) CO(g) H2(g)Mole fraction without N2(%)III. PROBLEM SOLUTIONPyrolysistemperature350-750 C50 CPyrolysis pressure1-10 bar1 barInert gas O2 content1-9 % mole1%Inert gas flow rate0.1-1 kg/min0.1 kg/minBiomass feed rate10-100 kg/h10 kg/hInert gas temperature25-200 C25 CFeed chemicalcompositionVarious feedstocks 1009080706050403020100H2CO2H2OCOCH4Fig.3: mole fractions of H2, CO, CO2, CH4 and H2O in the gasproduct as functions of pyrolysis temperature.The first one, i.e., the “steam reforming” reaction [28],starting from methane and water, yields carbon monoxideand molecular hydrogen. The second reaction, i.e., the“Boudouard’s equilibrium” [29], describes theequilibrium between CO and CO2 in presence of graphiticcarbon. The last equation is known as “heterogeneouswater gas reaction” [30]. In particular, they are allendothermic reactions and so they are favored by highertemperatures; they consume CH4, CO2 and H2O to giveCO and H2.The graphitic carbon, which can be recognized inthepyrolized char, is consumed according to reactions 2and 3; then, it is interesting to discuss the issue of thechar carbon mass fraction in the pyrolysis reactor, whichhas been predicted by assuming that pyrolized solidsareconstituted of ashes and the carbon residueonly.In Fig. 4 the trend of char carbon mass fraction againstthe pyrolysis temperature is depicted. As expected, thisfigure illustrates that the carbon content decreases withtemperature. The important thing to notice is that, like forCO2 in Fig. 3, the decrease of the char carbon is larger athigher temperatures, thus demonstrating that theFig. 3 reports the trend of the pyrolysis gasISSN: 1998-0140ΔHr 131.3kJ/molPyrolysis temperature ( C)Table IV: values of the operating variables in terms of rangesand increments.IncrementΔHr 172.5kJ/mol300 350 400 450 500 550 600 650 700 750 800A. Effect of pyrolysis temperatureThe main components of the gaseous product resultingfrom the simulated pyrolysis, besides nitrogen comingfrom the inert carrier gas, are molecular hydrogen (H2),carbon monoxide (CO), carbon dioxide (CO2) andmethane (CH4), while the remainder comprises mostlywater (H2O) and little amounts of heavier alkanes andalkenes.RangeΔHr 205.8kJ/molreaction 3Characteristic computation times of the Aspen codeare in the order of seconds on a PC with the Windows 8.1operating system, i7 processor and 4 Gb RAM.Operating variableVolume 9, 201574
INTERNATIONAL JOURNAL OF MATHEMATICAL MODELS AND METHODS IN APPLIED SCIENCESquantities have been found only for NH3, H2S and SO2whereas the other pollutants quantities are negligible.Among the many possible reactions that involve thesepolluting species, the most important are:Boudouard equilibrium taken into account by the modelis becoming relevant.96Char carbon (wt. %)Volume 9, 2015ΔHr -46.1 kJ/mol3H2(g) N2(g) 2NH3(g)reaction 9S(s) H2(g) H2S(g)ΔHr -20.63kJ/molreaction 104NH3(g) 3O2(g) 2N2(g) 6H2O(g)ΔHr -1267.3 kJ/molreaction 11ΔHr -296.8 kJ/molS(s) O2(g) SO2(g)reaction 12959493929190300 350 400 450 500 550 600 650 700 750 800Pyrolysis temperature ( C)0,06Mole fraction without N2(%)Fig. 4: char carbon mass fraction as a function of pyrolysistemperature.As a matter of fact, one has to remember that, even if itis present in small amount, oxygen is another componentof the reacting mixture and therefore there are alsooxidation reactions to be considered.The main oxidation reactions occurring within thepyrolysis gas mixture are the following:H2S0,040,030,020,010ΔHr -241.8 kJ/molH2(g) 0.5O2(g) H2O(g)reaction 4ΔHr -283.0 kJ/molCO(g) 0.5O2(g) CO2(g)reaction 5CH4(g) 1.5O2(g) CO(g) 2H2O(g)ΔHr -519.6 kJ/molreaction 6ΔHr -393.5 kJ/molC(s) O2(g) CO2(g)reaction 7ΔHr -110.5 kJ/molC(s) 0.5O2(g) CO(g)reaction 8300 350 400 450 500 550 600 650 700 750 800Pyrolysis temperature ( C)Fig. 5: NH3 and H2S mole fractions in the gas product asfunctions of pyrolysis temperature.Fig. 5 reports the trends of NH3 and H2S mole fractionswhile Fig. 6 reports the trend of SO2 mole fraction asfunctions of pyrolysis temperature.SO2 mole fraction without N2(%)1,20E-11Since these are all oxidation reactions they are alsoexothermic and non-equilibrium reactions; anyway,reactions 7 and 8 are heterogeneous and they can beslowed down by mass transport resistances that theoxygen must overcome to come into contact with thesolid carbon. The most likely pattern is that the oxidationreactions are fast enough to precede the endothermicequilibrium ones; in such a waythey consume all of theavailable oxygen.The importance of the oxidation reactions grows withthe oxygen content in the carrier gas; they are enhancedalso by bounded molecular oxygen within the biomassfeedstock itself.Nevertheless, for atypicalpyrolysisprocess with proper inert carrier gas, they are of minorimportance.The possible formation of pollutants has beenconsidered as well and, among the many, the pollutantsconsidered in the model are nitrogen monoxide (NO),nitrogen dioxide (NO2), ammonia (NH3), sulfur dioxide(SO2), sulfur trioxide (SO3) and hydrogen sulfide (H2S).However, within the results of the simulation, appreciableISSN: 00E-120,00E 00300 350 400 450 500 550 600 650 700 750 800Pyrolysis temperature ( C)Fig. 6: SO2 mole fraction in the gas product as a function ofpyrolysis temperature.These two figures show that the mole fractions of NH3and H2S are quite small, less than 0.05%, and that SO2mole fraction is about nine orders of magnitude lower;nevertheless, it is still interesting to look at their trends. Itcan be seen that NH3 and H2S mole fractions decrease75
INTERNATIONAL JOURNAL OF MATHEMATICAL MODELS AND METHODS IN APPLIED SCIENCESwith temperature and the opposite behavior is exhibitedby SO2 as a consequence of equilibrium of the tworeactions 10 and 12.Being the char a typical product ofpyrolysis, a veryimportant parameter for its characterizationis the g)releaseduponcombustionwhenconsidering the resulting water in the liquid phase.In literature, a number of equations can be found for anapproximate estimation of the heating values of differentcarbon-based materials, especially coals.The majority ofthese equations are based on the ultimate analysis of thesolid under test[31]; less work had been reported withregard to lignocellulosic materials, although someequations have been proposed to estimate heating valuesfrom proximate and chemical analysis [32]-[33]-[34].In order to estimate the higher heating value of thepyrolizedchar in the simulations, it has been chosen toutilize the equation developed by Cordero et al. [33],which is:kJ/kgcalculated by considering N2while excluding H2O) ofCO, H2 and CH4, respectively.Fig. 8 shows the plot of the gas lower heating value(LHV) against pyrolysis temperature. The minimumreported for the LHV is obviously related to thepreviously discussed trends of CH4, H2 and CO. Theconcentration of methane, whose coefficient within (2) isthe largest, decreases with temperature; this reduction isnot matched by the increase of H2 and CO and so the neteffect is that of lowering LHV up to 550 C.Above this latter T, the increase of H2 and COconcentrations is such that LHV increases up to amaximum value of 8337 kJ/Nm3 at 750 C.8500Gas lower heating value(kJ/Nm3)𝐻𝐻𝐻𝐻𝐻𝐻 354.3 𝐹𝐹𝐹𝐹 170.8𝑉𝑉𝑉𝑉(1)where FC is the fixed carbon in wt. % d.b. and VM is thevolatile matter in wt. % d.b. ofthe char under test.The trend of the char HHV with pyrolysis temperature,shown in Fig. 7, is similar to the one exhibited by thechar carbon mass fraction in Fig. 4 because the above (1)is linear against it.80007500700065006000300 350 400 450 500 550 600 650 700 750 800Pyrolysis temperature ( C)Fig. 8: gas lower heating value as a function of 2,432,232As the pyrolysis reactor works at equilibrium, it has nosize in the simulations; in particular, the heat transfer areacannot be evaluated and then the heat duty (kW) isdetermined just through an energy balance carried out byAspen Plus . Fig. 9 displays the plot of the reactor netheat duty against pyrolysis temperature and, as expected,an increasing trend is found.Reactor net heat duty (kW)Char higher heating value(MJ/kg)Volume 9, 2015300 350 400 450 500 550 600 650 700 750 800Pyrolysis temperature ( C)Fig.7: char higher heating value as a function of pyrolysistemperature.As the gas composition is influenced by temperature,this also significantly affects the Lower Heating Value(LHV) of the gas product. The best way to get a LHVvalue as high as possible is to produce a gas enriched inCO, H2 and CH4, which could be suitable for energeticexploitation, for example in internal combustion enginesand turbines for power production. The gas LHV hasbeen calculated using (2), here reported [33]:6050403020100300 350 400 450 500 550 600 650 700 750 800Pyrolysis temperature ( C)Fig. 9: reactor net heat duty as a function of pyrolysistemperature.B. Effect of pyrolysis pressureFig. 10 illustrates how the values of the mole fractions(without N2) of H2, CO, CO2, CH4 and H2O change with𝐿𝐿𝐿𝐿𝐿𝐿 30 𝑋𝑋𝐶𝐶𝐶𝐶 25.7 𝑋𝑋𝐻𝐻2 85.4 𝑋𝑋𝐶𝐶𝐶𝐶4 4.2kJ/Nm3(2)where𝑋𝑋𝐶𝐶𝐶𝐶 , 𝑋𝑋𝐻𝐻2 and 𝑋𝑋𝐶𝐶𝐶𝐶4 are the mole fractions (asISSN: 1998-01407076
INTERNATIONAL JOURNAL OF MATHEMATICAL MODELS AND METHODS IN APPLIED SCIENCES1009080706050403020100H2COCO2CH4pressures than at the higher ones.Trends of the pollutants NH3 and H2S mole fractions asfunctions of pyrolysis pressure are reported in Fig.12,while SO2 mole fraction against pyrolysis pressure isplotted in Fig.13. It is noticed that the effect of pyrolysispressure on the pollutants is that of increasing their molefractions. NH3 and SO2 experience the largest increase,achieving at 10 bar values about three times higher thanthose at atmospheric pressure; they shift, respectively,from 0.039% and 1,51*10-12 % at 1 bar to 0.1225% and4.83*10-12 % at 10 bar; the increase of NH3 with pyrolysispressure ismostly explained by the mole decrease inreaction 9. The increase in H2S, on the other hand, is byfar less pronounced.0,14H2O012345678Pyrolysis pressure (bar)9Mole fraction without N2(%)Mole fraction without N2(%)pyrolysis pressure, up to P 10 bar.H2 and CO mole fractions decrease with a growingpressure, whereas CH4, CO2 and H2O show the oppositetrend; this is in contrast with what has been found byvarying the pyrolysis temperature. Furthermore,analogously to what has been observed in Fig. 3 forpyrolysis temperature, the trend of H2 is symmetric tothat of CH4 while the trend of CO is symmetric to that ofCO2. This behavior can be again explained as aconsequence of the equilibrium established among thereactions 1, 2 and 3.10 11Fig. 10: mole fractions of H2, CO, CO2, CH4 and H2O in the gasproduct as functions of pyrolysis 0 11Pyrolysis pressure (bar)Fig. 11 plots the carbon mass fraction within charagainst pressure.By having a look at Fig. 11, one mightthink that reactions 2 and 3 are not correctly taken inaccount because the carbon mass fraction decreases withpressure whereas solid carbonas a reactant is favored by apressure increase. Anyway, this behavior can beexplained remembering that, although to a low extent,oxidation reactions take place. It must be noted that thisdecrease in the char carbon with pressure is very slight,going from 95.59% at 1 bar to 95.41% at 10 bar(0.0019%).Fig. 12: NH3 and H2S mole fractions in the gas product asfunctions of pyrolysis pressure.6,00E-12SO2 mole fraction without N2(%)Char carbon (wt. %)Volume 9, 20,00E 00012345678Pyrolysis pressure (bar)9 10 11Fig. 13: SO2 mole fraction in the gas product as a function ofpyrolysis pressure.0123456789As already noticed when studying the effect ofpyrolysis temperature, pyrolysis pressure also bringsabout a decrease in the char higher heating value; this canbe seen in Fig. 14. This reduction, anyway, is lessrelevant than that found with pyrolysis temperature. Infact, the char higher heating value passes from 33.87MJ/kg at 1 bar to 33.8 MJ/kg at 10 bar, thus showing avery modest decrease (0.19%).The lower heating value of the gas product as a10 11Pyrolysis pressure (bar)Fig. 11: char carbon mass fraction as a function of pyrolysispressure.Furthermore, similarly to the trends of the gaseousspecies mole fractions (Fig. 10), the effect of pyrolysispressure on char carbon is more outstanding at lowerISSN: 1998-014077
INTERNATIONAL JOURNAL OF MATHEMATICAL MODELS AND METHODS IN APPLIED SCIENCES16Reactor net heat duty (kW)Char higher heating value(MJ/kg)function of pyrolysis pressure is depicted in Fig. 109801234567891210 11Pyrolysis pressure (bar)345678Pyrolysis pressure (bar)91011Fig. 16: reactor net heat duty as a function of pyrolysis pressureFig. 14: char higher heating value as a function of pyrolysispressure.C. Effect of the inert gas O2 mole fractionThe mole fractions of H2, CO, CO2, CH4 and H2O asfunctions of inert gas O2 mole fraction are represented inFig. 17.Fig. 15indicates that the gas LHV shows a monotonousincreasing trend when pyrolysis pressure is raised. Theincrease is rather steep at lower pressures while higherones lead to a less significant rise; since the gas LHV iscomputed through(2), this is mostly due to the trend ofCH4 which grows faster at lower pressure and slower athigher ones. More precisely, the increase of CH4 molefraction offsets the reduction of H2 and CO mole fractionsand it even brings a positive contribution to the gas LHV,which goes from 6954 kJ/Nm3 at 1 bar to 8068 kJ/Nm3at10 bar (increase of about 16%).Mole fraction without N2(%)10090807060504030201008200Gas lower heating value(kJ/Nm3)1533,790Volume 9, 20158000H2CO2H2O07800123COCH4456O2 concentration (%)78910Fig. 17: mole fractions of H2, CO, CO2, CH4 and H2O in the gasproduct as functions of the inert gas O2 mole fraction.76007400Like pressure, the effect of increasing the inert gasoxygen mole fraction is slight on the compositions of H2,CO, CO2, CH4 and H2O as well. However, H2, CH4 andH2O exhibit a decrease in their mole fractions, probablydue to the major extent of oxidation resulting from thelarger amount of oxygen available; on the other hand, COand CO2 increase with a growing O2 content in the inertgas, and this again may be ascribed to a more intenseoxidative activity.The largest variation is experienced by CO2, whichgoes from 26.05% at 1% of O2 to 29.55% at 9% of O2(13.4%), while the other species, in order of decreasingvariation entity, are H2, CH4, H2O and CO; therefore, COseems to be the most insensitive to oxygen concentration.As one could guess, increasing the oxygen molefraction in the carrier gas causes a decrease of charcarbon. This is shown inFig.18 and, again, can beattributed to the increased amount of oxygen that leads toan increased extent of oxidation. This reduction is linearand, like pressure, is not as relevant as that caused bypyrolysis temperature; in fact, carbon within char goesfrom 95.59 at 1% to 95.36 at 9%, showing a decrease of720070006800012345678Pyrolysis pres
Aspen Plus [23] is a comprehensive chemical process modelling system, used by both academy and industry, for design, simulation, process improvement and optimization.Aspen Plus [23]has advanced and dedicated functionalities, such as detailed heat exchanger design, dynamic simulation, batch process modelling. It also has