Transcription
United StatesDepartment ofAgricultureNaturalResourcesConservationServiceIn cooperation withthe Tennessee AgriculturalExperiment Station, theMarshall County Board ofCommissioners, and theTennessee Department ofAgricultureSoil Survey ofMarshall County,Tennessee
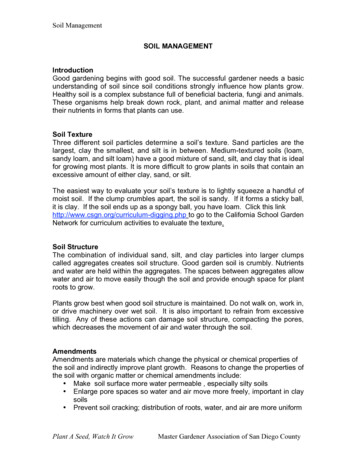
3How to Use This Soil SurveyGeneral Soil MapThe general soil map, which is the color map preceding the detailed soil maps, shows the survey area dividedinto groups of associated soils called general soil map units. This map is useful in planning the use andmanagement of large areas.To find information about your area of interest, locate that area on the map,identify the name of the map unit in the area on the color-coded maplegend, then refer to the section General Soil Map Units for ageneral description of the soils in your area.Detailed Soil MapsThe detailed soil maps follow thegeneral soil map. These mapscan be useful in planning the useand management of small areas.To find information about yourarea of interest, locate that areaon the Index to Map Sheets,which precedes the soil maps.Note the number of the mapsheet and turn to that sheet.Locate your area of interest onthe map sheet. Note the map unitsymbols that are in that area.Turn to the Contents, which liststhe map units by symbol andname and shows the page whereeach map unit is described.The Contents shows which table has data on a specific land use for each detailed soil map unit. Also see theContents for sections of this publication that may address your specific needs.
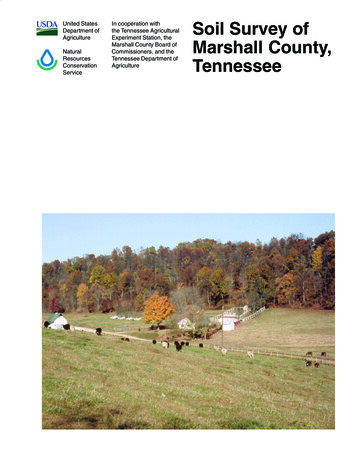
4This soil survey is a publication of the National Cooperative Soil Survey, a joint effortof the United States Department of Agriculture and other Federal agencies, Stateagencies including the Agricultural Experiment Stations, and local agencies. TheNatural Resources Conservation Service (formerly the Soil Conservation Service) hasleadership for the Federal part of the National Cooperative Soil Survey.Major fieldwork for this soil survey was completed in 1995. Soil names anddescriptions were approved in 1999. Unless otherwise indicated, statements in thispublication refer to conditions in the survey area in 1999. This survey was madecooperatively by the Natural Resources Conservation Service, the TennesseeAgricultural Experiment Station, the Marshall County Board of Commissioners, and theTennessee Department of Agriculture. The survey is part of the technical assistancefurnished to the Marshall County Soil Conservation District.Soil maps in this survey may be copied without permission. Enlargement of thesemaps, however, could cause misunderstanding of the detail of mapping. If enlarged,maps do not show the small areas of contrasting soils that could have been shown at alarger scale.The United States Department of Agriculture (USDA) prohibits discrimination in all ofits programs on the basis of race, color, national origin, gender, religion, age, disability,political beliefs, sexual orientation, and marital or family status. (Not all prohibited basesapply to all programs.) Persons with disabilities who require alternative means forcommunication of program information (Braille, large print, audiotape, etc.) shouldcontact the USDA’s TARGET Center at 202-720-2600 (voice or TDD).To file a complaint of discrimination, write USDA, Director, Office of Civil Rights,Room 326W, Whitten Building, 14th and Independence Avenue SW, Washington, DC20250-9410, or call 202-720-5964 (voice or TDD). USDA is an equal opportunityprovider and employer.Cover: Beef cattle in a pastured area of Marshall County. Livestock production is an importantenterprise in the county.Additional information about the Nation’s natural resources is available on theNatural Resources Conservation Service home page on the World Wide Web.The address is http://www.nrcs.usda.gov.
5ContentsHow to Use This Soil Survey . 3Contents . 5Foreword . 9General Nature of the County . 11Settlement . 11Natural Resources . 11Industry and Transportation Facilities . 12Physiography, Relief, and Drainage . 12Climate . 12How This Survey Was Made . 13General Soil Map Units . 151. Harpeth-Arrington-Waynesboro . 152. Talbott-Rock Outcrop-Gladeville . 163. Talbott-Braxton-Rock Outcrop . 164. Hawthorne-Dellrose-Mimosa . 185. Hampshire-Stiversville-Marsh . 196. Mimosa-Ashwood-Rock Outcrop . 21Detailed Soil Map Units . 23AmB—Armour silt loam, 2 to 5 percentslopes . 24AmC2—Armour silt loam, 5 to 12 percentslopes, eroded . 25Ar—Arrington silt loam, frequently flooded . 25AsC—Ashwood-Mimosa-Rock outcropcomplex, 5 to 15 percent slopes . 27AsE—Ashwood-Mimosa-Rock outcropcomplex, 15 to 35 percent slopes . 28BaC—Barfield-Ashwood-Rock outcropcomplex, 5 to 20 percent slopes . 29BaE—Barfield-Ashwood-Rock outcropcomplex, 20 to 40 percent slopes . 30BrB2—Bradyville silt loam, 2 to 5 percentslopes, eroded . 31BrC2—Bradyville silt loam, 5 to12 percent slopes, eroded . 32BtB2—Braxton silt loam, 2 to 5 percentslopes, eroded . 33BtC2—Braxton silt loam, 5 to 12 percentslopes, eroded . 34BxC2—Braxton-Talbott-Rock outcropcomplex, 2 to 12 percent slopes, eroded . 35CaB—Capshaw silt loam, 2 to 5 percentslopes . 36DeC2—Dellrose gravelly silt loam, 5 to12 percent slopes, eroded . 37DeD2—Dellrose gravelly silt loam, 12 to20 percent slopes, eroded . 38DeE—Dellrose gravelly silt loam, 20 to45 percent slopes . 38Ea—Eagleville silty clay loam, frequentlyflooded . 39Eg—Egam silt loam, frequently flooded . 40GaC—Gladeville-Rock outcrop complex,2 to 15 percent slopes, karst . 41Gd—Godwin silt loam, frequently flooded . 41Go—Godwin silty clay loam, frequentlyflooded . 42HaB2—Hampshire silt loam, 2 to5 percent slopes, eroded . 43HaC2—Hampshire silt loam, 5 to12 percent slopes, eroded . 44HaC3—Hampshire silty clay loam, 5 to12 percent slopes, severely eroded . 45HaD2—Hampshire silt loam, 12 to20 percent slopes, eroded . 45HaD3—Hampshire silty clay loam, 12 to20 percent slopes, severely eroded . 46HrB—Harpeth silt loam, 2 to 5 percentslopes . 47HrC2—Harpeth silt loam, 5 to 12 percentslopes, eroded . 48HtC—Hawthorne gravelly silt loam, 5 to15 percent slopes . 49HtE—Hawthorne gravelly silt loam, 15 to45 percent slopes . 50HWE—Hawthorne and Dellrose association,25 to 55 percent slopes . 50Ln—Lindell silt loam, frequently flooded . 51MaE3—Marsh-Stiversville complex, 15 to35 percent slopes, severely eroded . 52MmC2—Mimosa silt loam, 5 to 12 percentslopes, eroded . 53MmD2—Mimosa silt loam, 12 to20 percent slopes, eroded . 54MmE—Mimosa silt loam, 20 to 35 percentslopes . 55MmE2—Mimosa silt loam, 20 to35 percent slopes, eroded . 56MoC2—Mimosa gravelly silt loam, 5 to12 percent slopes, eroded . 57
6MoD2—Mimosa gravelly silt loam, 12 to20 percent slopes, eroded . 58MoE2—Mimosa gravelly silt loam, 20 to35 percent slopes, eroded . 59NeB—Nesbitt silt loam, 2 to 5 percent slopes . 60Pt—Pits, quarries . 60RoC—Rock outcrop-Talbott complex, 2 to12 percent slopes . 61StB—Stiversville loam, 2 to 5 percent slopes . 61StC2—Stiversville loam, 5 to 12 percentslopes, eroded . 62StD2—Stiversville loam, 12 to 20 percentslopes, eroded . 63TaB2—Talbott silt loam, 2 to 5 percentslopes, eroded . 64TaC2—Talbott silt loam, 5 to 12 percentslopes, eroded . 65TbB—Talbott silt loam, 2 to 5 percent slopes,rocky . 66TtC—Talbott-Rock outcrop complex, 2 to15 percent slopes . 67Tu—Tupelo silt loam, occasionally flooded . 68Ub—Urban land . 69WaB2—Waynesboro silt loam, 2 to5 percent slopes, eroded . 69WaC2—Waynesboro silt loam, 5 to12 percent slopes, eroded . 70Use and Management of the Soils . 73Crops and Pasture . 73Yields per Acre . 75Land Capability Classification . 76Prime Farmland . 76Woodland Management and Productivity . 77Recreation . 78Wildlife Habitat . 79Engineering . 80Building Site Development . 81Sanitary Facilities . 82Construction Materials . 83Water Management . 84Soil Properties . 87Engineering Index Properties . 87Physical Properties . 88Chemical Properties . 89Water Features . 89Soil Features . 90Classification of the Soils . 91Soil Series and Their Morphology . 91Armour Series . 91Arrington Series . 92Ashwood Series . 93Barfield Series . 93Bradyville Series . 94Braxton Series . 94Capshaw Series . 98Dellrose Series . 98Eagleville Series . 99Egam Series . 100Gladeville Series . 100Godwin Series . 100Hampshire Series . 101Harpeth Series . 102Hawthorne Series . 102Lindell Series . 103Marsh Series . 103Mimosa Series . 104Nesbitt Series . 104Stiversville Series . 105Talbott Series . 106Tupelo Series . 106Waynesboro Series . 107References . 109Glossary . 111Tables . 119Table 1.—Temperature and Precipitation . 120Table 2.—Freeze Dates in Spring and Fall . 121Table 3.—Growing Season . 121Table 4.—Acreage and ProportionateExtent of the Soils . 122Table 5.—Land Capability and Yieldsper Acre of Crops and Pasture . 123Table 6.—Prime Farmland. 127Table 7.—Woodland Management andProductivity . 128Table 8.—Recreational Development . 136Table 9.—Wildlife Habitat . 141Table 10.—Building Site Development . 146Table 11.—Sanitary Facilities . 153Table 12.—Construction Materials . 159Table 13.—Water Management . 164
7Table 14.—Engineering Index Properties . 172Table 15.—Physical Properties of the Soils . 184Table 16.—Chemical Properties of the Soils . 190Table 17.—Water Features . 195Table 18.—Soil Features . 199Table 19.—Classification of the Soils . 203September 2005
9ForewordThis soil survey contains information that affects land use planning in this surveyarea. It contains predictions of soil behavior for selected land uses. The survey alsohighlights soil limitations, improvements needed to overcome the limitations, and theimpact of selected land uses on the environment.This soil survey is designed for many different users. Farmers, foresters, andagronomists can use it to evaluate the potential of the soil and the managementneeded for maximum food and fiber production. Planners, community officials,engineers, developers, builders, and home buyers can use the survey to plan land use,select sites for construction, and identify special practices needed to ensure properperformance. Conservationists, teachers, students, and specialists in recreation,wildlife management, waste disposal, and pollution control can use the survey to helpthem understand, protect, and enhance the environment.Various land use regulations of Federal, State, and local governments may imposespecial restrictions on land use or land treatment. The information in this report isintended to identify soil properties that are used in making various land use or landtreatment decisions. Statements made in this report are intended to help the land usersidentify and reduce the effects of soil limitations on various land uses. The landowner oruser is responsible for identifying and complying with existing laws and regulations.Great differences in soil properties can occur within short distances. Some soils areseasonally wet or subject to flooding. Some are shallow to bedrock. Some are toounstable to be used as a foundation for buildings or roads. Clayey or wet soils arepoorly suited to use as septic tank absorption fields. A high water table makes a soilpoorly suited to basements or underground installations.These and many other soil properties that affect land use are described in this soilsurvey. Broad areas of soils are shown on the general soil map. The location of eachsoil is shown on the detailed soil maps. Each soil in the survey area is described.Information on specific uses is given for each soil. Help in using this publication andadditional information are available at the local office of the Natural ResourcesConservation Service or the Cooperative Extension Service.James W. FordState ConservationistNatural Resources Conservation Service
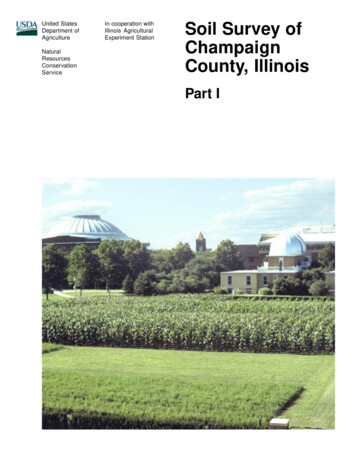
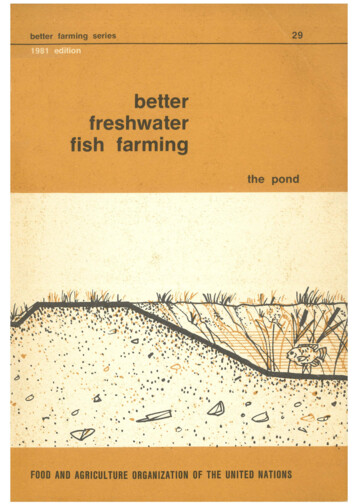
11Soil Survey ofMarshall County, TennesseeBy Charles L. Davis, Natural Resources Conservation ServiceFieldwork by Charles L. Davis, Anthony Khiel, Evelyn Haskins, and Steve Monteith,Natural Resources Conservation Service, and Jack Colflesh, Marshall CountyUnited States Department of Agriculture, Natural Resources Conservation Service,in cooperation withthe Tennessee Agricultural Experiment Station, the Marshall County Board ofCommissioners, and the Tennessee Department of AgricultureMARSHALL COUNTY is in south-central Tennessee(fig. 1). It is bordered on the north by Williamson andRutherford Counties, on the west by Maury County, onthe east by Bedford County, and on the south by Gilesand Lincoln Counties.The county has a land area of 241,000 acres, or377 square miles. Lewisburg, the county seat, is nearthe center of the county. In 1990, the population of thecounty was 21,539.General Nature of the CountyThis section gives general information about thecounty. It describes settlement; natural resources;industry and transportation facilities; physiography,relief, and drainage; and climate.SettlementThe first land that was cleared and settled was anarea along the Duck River (Wright 1963). The areawas settled during the early 1800’s. The early settlershunted, cleared land, and grew crops. Most of the landhas been cleared at some time during the history ofthe county. Many areas that were unsuitable forsettlement were abandoned and allowed to revertback to native woodland.Marshall County was formed from parts of Bedford,Maury, and Lincoln Counties in 1836, with a districtfrom Giles County added in 1870. The county wasnamed for John Marshall, Chief Justice of the U.S.Supreme Court. The town of Lewisburg wasincorporated and established as the county seat in1837 (Marshall County Historical Society 1972, 1986).Cornersville, Chapel Hill, and Petersburg are some ofthe larger communities in Marshall County.Natural ResourcesMarshall County has a generous amount of naturalresources. The most important resources are the soil,rivers and streams, forest, wildlife, and limestonebedrock.The Duck River is the largest waterway, but thereare numerous smaller creeks and streams throughoutthe county. The two main sources of potable water areprivate wells, which are drilled into limestone geologicformations, and reservoirs, from which water is taken,processed through a water treatment facility, andpiped to different areas in the county. The soilsNASHVILLE Figure 1.—Location of Marshall County in Tennessee.
12produce good yields of small grain and forage plantsfor livestock and other agricultural products.Limestone quarries provide the region with crushedstone used for road construction and as fill material,agricultural lime, and many other products.About one-third of the acreage in the county is usedas woodland. Most of the marketable timber is on thehigher ridges in the southern part of the county. Theforest provides valuable habitat for many wildlifespecies, such as squirrel, deer, fox, turkey, andnumerous other woodland wildlife. Open areas providesuitable habitat for quail, rabbit, dove, and other smallgame species.Industry and Transportation FacilitiesAgriculture is the primary industry in the county.About 81,000 acres in the county is used as farmland.Dairy enterprises have been a major part of theagricultural industry since early in the county’s history(Marshall County Historical Society 1986). In theearly years, Jersey cattle were the dairy cattle ofchoice; however, Holstein cattle now dominate thedairy industry. Other important agronomic enterprisesinclude beef cattle; swine; row crops, such as corn;and wheat and other small grain. Tobacco hasbeen an important cash crop in the county. Alfalfais an important hay crop for the dairy enterprises.In recent years, horse farms and poultry operationshave been established in many areas of thecounty.In 1929, the University of Tennessee establishedthe Dairy Experiment Station, south of Lewisburg(Marshall County Historical Society 1986). The stationconducts research on various aspects of dairyfarming and maintains a large herd of registeredJersey cows.One of the first major nonagricultural industries toenter Marshall County was the pencil industry. In1894, The American Lead Pencil Company opened asaw mill and a slat mill (Marshall County HistoricalSociety 1986). The pencil industry is still thrivingtoday. Several other nonagricultural industries arelocated in the county. They include metal casting andmanufacturers of heating and air conditioning units,plastic products, containers, electronics, cosmetics,and automotive parts.Transportation facilities are throughout the county.They include U.S. Highways 31A and 431; StateHighways 373, 272, 99, and 129; and numerouscounty roads. One railroad provides rail transportationservice. It runs north and south and passes throughthe communities of Chapel Hill, Lewisburg, andCornersville.Soil SurveyPhysiography, Relief, and DrainageMarshall County lies in the Nashville Basinphysiographic region. The northern two-thirds of thecounty is in the inner portion of the basin, and thesouthern third is in the outer portion. There are alsoremnants of the Highland Rim geological formation onthe ridgetops in the southern part of the county.The landscape in the northern two-thirds of thecounty is dominantly nearly level or gently sloping.The landscape in the southern third of the county ishighly dissected by steep, narrow ridges.A dendritic drainage pattern is exhibited throughoutthe county. It is very pronounced in the southern part,where the streams are actively downcutting into theremnant ridges of the Highland Rim. The Duck River isthe main drainage outlet for the northern two-thirds ofthe county. Richland Creek and Cane Creek drainmost of the southern part.ClimateIn Marshall County, summers are hot in valleys andare only slightly cooler in the hills. Winters aremoderately cold throughout the county. Rainfall isfairly heavy and is well distributed throughout the year.Snow falls nearly every winter, but the snow covergenerally lasts only a few days.Table 1 gives data on temperature and precipitationfor the survey area as recorded at Lewisburg,Tennessee, in the period 1951 to 1990. Table 2 showsprobable dates of the first freeze in fall and the lastfreeze in spring. Table 3 provides data on length of thegrowing season.In winter, the average temperature is 39 degrees Fand the average daily minimum temperature is 27degrees. The lowest temperature on record, whichoccurred on January 21, 1985, is -20 degrees. Insummer, the average temperature is 76 degrees andthe average daily maximum temperature is 88degrees. The highest recorded temperature, whichoccurred on July 29, 1952, is 107 degrees.Growing degree days are shown in table 1. Theyare equivalent to “heat units.” During the month,growing degree days accumulate by the amount thatthe average temperature each day exceeds a basetemperature (50 degrees F). The normal monthlyaccumulation is used to schedule single or successiveplantings of a crop between the last freeze in springand the first freeze in fall.The total annual precipitation is about 54 inches. Ofthis, about 20 inches, or 37 percent, usually falls inApril through September. The growing season formost crops falls within this period. In 2 years out of 10,
Marshall County, Tennesseethe rainfall in April through September is less than 26inches. The heaviest 1-day rainfall during the period ofrecord was 8 inches on March 27, 1960.Thunderstorms occur on about 53 days each year,and most occur in summer. At any time of the year,heavy rains from prolonged storms can occasionallyoccur throughout the survey area and can causesevere flooding in valleys.The average seasonal snowfall is 5 inches. Thegreatest snow depth at any one time during the periodof record was 13 inches. On the average, 2 days ofthe year have at least 1 inch of snow on the ground.The average relative humidity in midafternoon isabout 57 percent. Humidity is higher at night, and theaverage at dawn is about 84 percent. The sun shines61 percent of the time possible in summer and 44percent in winter. The prevailing wind is from thesouth. Average windspeed is highest, 10 miles perhour, in spring.How This Survey Was MadeThis survey was made to provide information aboutthe soils and miscellaneous areas in the survey area.The information includes a description of the soils andmiscellaneous areas and their location and adiscussion of their suitability, limitations, andmanagement for specified uses. Soil scientistsobserved the steepness, length, and shape of theslopes; the general pattern of drainage; the kinds ofcrops and native plants; and the kinds of bedrock.They dug many holes to study the soil profile, which isthe sequence of natural layers, or horizons, in a soil.The profile extends from the surface down into theunconsolidated material in which the soil formed. Theunconsolidated material is devoid of roots and otherliving organisms and has not been changed by otherbiological activity.The soils and miscellaneous areas in the surveyarea are in an orderly pattern that is related to thegeology, landforms, relief, climate, and naturalvegetation of the area. Each kind of soil andmiscellaneous area is associated with a particular kindof landform or with a segment of the landform. Byobserving the soils and miscellaneous areas in thesurvey area and relating their position to specificsegments of the landform, a soil scientist develops aconcept or model of how they were formed. Thus,during mapping, this model enables the soil scientistto predict with a considerable degree of accuracy thekind of soil or miscellaneous area at a specific locationon the landscape.Commonly, individual soils on the landscape mergeinto one another as their characteristics gradually13change. To construct an accurate soil map, however,soil scientists must determine the boundaries betweenthe soils. They can observe only a limited number ofsoil profiles. Nevertheless, these observations,supplemented by an understanding of the soilvegetation-landscape relationship, are sufficient toverify predictions of the kinds of soil in an area and todetermine the boundaries.Soil scientists recorded the characteristics of thesoil profiles that they studied. They noted soil color,texture, size and shape of soil aggregates, kind andamount of rock fragments, distribution of plant roots,reaction, and other features that enable them toidentify soils. After describing the soils in the surveyarea and determining their properties, the soilscientists assigned the soils to taxonomic classes(units). Taxonomic classes are concepts. Eachtaxonomic class has a set of soil characteristics withprecisely defined limits. The classes are used as abasis for comparison to classify soils systematically.Soil taxonomy, the system of taxonomic classificationused in the United States, is based mainly on the kindand character of soil properties and the arrangementof horizons within the profile. After the soil scientistsclassified and named the soils in the survey area, theycompared the individual soils with similar soils in thesame taxonomic class in other areas so that theycould confirm data and assemble additional databased on experience and research.While a soil survey is in progress, samples of someof the soils in the area generally are collected forlaboratory analyses and for engineering tests. Soilscientists interpret the data from these analyses andtests as well as the field-observed characteristics andthe soil properties to determine the expected behaviorof the soils under different uses. Interpretations for allof the soils are field tested through observation of thesoils in different uses and under different levels ofmanagement. Some interpretations are modified to fitlocal conditions, and some new interpretations aredeveloped to meet local needs. Data are assembledfrom other sources, such as research information,production records, and field experience of specialists.For example, data on crop yields under defined levelsof management are assembled from farm records andfrom field or plot experiments on the same kinds ofsoil.Predictions about soil behavior are based not onlyon soil properties but also on such variables asclimate and biological activity. Soil conditions arepredictable over long periods of time, but they are notpredictable from year to year. For example, soilscientists can predict with a fairly high degree ofaccuracy that a given soil will have a high water table
14within certain depths in most years, but they cannotpredict that a high water table will always be at aspecific level in the soil on a specific date.After soil scientists located and identified thesignificant natural bodies of soil in the survey area,they drew the boundaries of these bodies on aerialphotographs and identified each as a specific mapunit. Aerial photographs show trees, buildings, fields,roads, and rivers, all of which help in locatingboundaries accurately.
15General Soil Map UnitsThe general soil map in this publication showsbroad areas that have a distinctive pattern of soils,relief, and drainage. Each map unit on the general soilmap is a unique natural landscape. Typically, itconsists of one or more major soils or miscellaneousareas and some minor soils or miscellaneous areas. Itis named for the major soils or miscellaneous areas.The components of one map unit can occur in anotherbut
Natural Resources Conservation Service (formerly the Soil Conservation Service) has leadership for the Federal part of the National Cooperative Soil Survey. Major fieldwork for this soil survey was completed in 1995. Soil names and descriptions were approved in 1999. Unless otherwise indicated, statements in this