Transcription
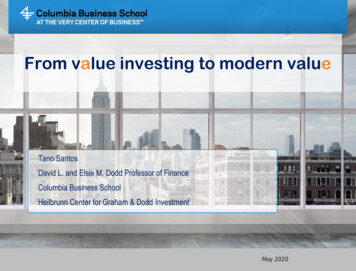
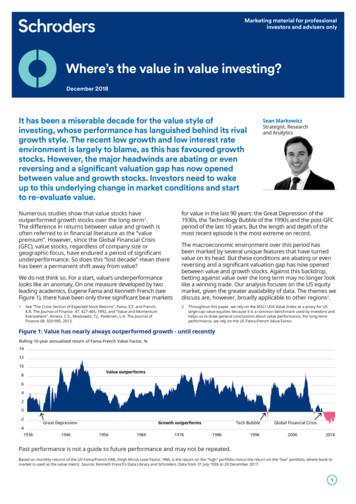
Marketing material for professionalinvestors and advisers onlyWhere’s the value in value investing?December 2018It has been a miserable decade for the value style ofinvesting, whose performance has languished behind its rivalgrowth style. The recent low growth and low interest rateenvironment is largely to blame, as this has favoured growthstocks. However, the major headwinds are abating or evenreversing and a significant valuation gap has now openedbetween value and growth stocks. Investors need to wakeup to this underlying change in market conditions and startto re-evaluate value.Numerous studies show that value stocks haveoutperformed growth stocks over the long-term1.The difference in returns between value and growth isoften referred to in financial literature as the “valuepremium”. However, since the Global Financial Crisis(GFC), value stocks, regardless of company size orgeographic focus, have endured a period of significantunderperformance. So does this “lost decade” mean therehas been a permanent shift away from value?Sean MarkowiczStrategist, Researchand Analyticsfor value in the last 90 years: the Great Depression of the1930s, the Technology Bubble of the 1990s and the post-GFCperiod of the last 10 years. But the length and depth of themost recent episode is the most extreme on record.We do not think so. For a start, value’s underperformancelooks like an anomaly. On one measure developed by twoleading academics, Eugene Fama and Kenneth French (seeFigure 1), there have been only three significant bear marketsThe macroeconomic environment over this period hasbeen marked by several unique features that have turnedvalue on its head. But these conditions are abating or evenreversing and a significant valuation gap has now openedbetween value and growth stocks. Against this backdrop,betting against value over the long term may no longer looklike a winning trade. Our analysis focuses on the US equitymarket, given the greater availability of data. The themes wediscuss are, however, broadly applicable to other regions2.12See “The Cross Section of Expected Stock Returns”. Fama, E.F. and French,K.R. The Journal of Finance. 47, 427-465, 1992, and “Value and MomentumEverywhere”. Asness, C.S., Moskowitz, T.J., Pedersen, L.H. The Journal ofFinance 68, 929-985, 2013.Throughout this paper, we rely on the MSCI USA Value Index as a proxy for USlarge-cap value equities because it is a common benchmark used by investors andhelps us to draw general conclusions about value performance. For long-termperformance, we rely on the US Fama-French Value Factor.Figure 1: Value has nearly always outperformed growth - until recentlyRolling 10-year annualised return of Fama-French Value Factor, %141210Value outperforms86420-2-41936Growth outperformsGreat Depression1946195619661976Tech Bubble19861996Global Financial Crisis20062016Past performance is not a guide to future performance and may not be repeated.Based on monthly returns of the US Fama/French HML (High Minus Low) Factor. HML is the return on the “high” portfolio minus the return on the “low” portfolio, where book tomarket is used as the value metric. Source: Kenneth French’s Data Library and Schroders. Data from 31 July 1926 to 29 December 2017.1
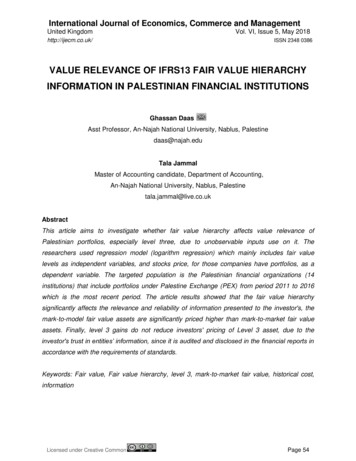
Why does the value premium exist?Value stocks are companies with low prices relativeto fundamentals, such as earnings, book value or cashflow. Growth stocks are companies with high currentor forecast earnings and so tend to have higher pricesrelative to fundamentals. There are two traditionalexplanations as to why value stocks have tended tooutperform growth stocks.The first is behavioural: investors tend to overreact togood or bad news and naively extrapolate past growthrates into the future. This leads them to overpay forgrowth and underpay for value. The resulting valuationgap then becomes a function of human emotion, noteconomic reality. Eventually, this is corrected, as mostcompany profits tend to revert to their long-termaverage. That is to say, severe profit falls often reversewhile strong profit growth tends to slow.The second explanation is that value stocks are riskiercompanies because they are more sensitive to theeconomic cycle or more leveraged. Investors want to becompensated for taking on that risk with the prospectof a higher expected return. Conversely, growth stocksare generally companies that have experienced strongearnings growth and are expected to continue growingin the future. Investors are less concerned aboutfuture losses because of growth stocks’ past earningsachievements and high growth prospects and so willapply a lower risk premium, which lowers expectedfuture returns.The macro influencesThe prolonged period of slow economic growth shouldersmost of the blame for value’s recent underperformance.In a slow growth and uncertain economic environment,earnings growth is hard to come by3 and so investorsplace a premium on faster-growing companies, such as theso-called FAANG stocks – Facebook, Apple, Amazon, Netflix,Google (Alphabet) – because these are perceived to offermore earnings certainty.This scarcity of earnings growth has motivated investorsto pursue investments in companies capable of generatingtheir own growth at the expense of those, such as valuestocks, that are more exposed to cyclical downturns.Indeed, since the trough of the recent US recession, the12 month forward price-to-earnings ratio of growth stockshas risen by 55% compared to only 11% for value stocks4.3Since 2007, US stocks have generated real earnings growth of 0.8% per annum,far below the pre-crisis average of 2.4%. Source: Datastream, MSCI and Schroders.Data from 31 January 1969 to 31 December 2017. Based on MSCI USA Index andUS core CPI as proxies for US stocks and inflation respectively. Pre-crisis average isfrom 1969 to 2007.4MSCI USA Growth Index and MSCI USA Value Index used as a proxy for value andgrowth equities respectively. Trough in US recession is based on data set by theNational Bureau of Economic Research. Source: Datastream, MSCI and Schroders.Data from 31 May 2009 to 29 December 2017.Figure 2: The typical “sweet spot” for value has notbeen so sweetAverage monthly value premium, sionLong-term historySlowdownRecessionSince 2007Past performance is not a guide to future performanceand may not be repeated.Value premium calculated using monthly returns of the US Fama/French HML (HighMinus Low) Factor. HML is the return on the “high” portfolio minus the return on the“low” portfolio where book to market is used as the value metric. Schroders BusinessCycle Indicator (BCI) is used to determine monthly economic phases, based on acombination of macro, consumer and credit measures where data is standardisedand percentile ranked. Despite the clear differentiation in returns across phases, we findthey are not statistically significant. Source: Kenneth French Data Library and SchrodersCross-Asset Cyclical Group. Long-term history covers data from 31 March 1953 to29 December 2017.The underlying mechanics of the value premium havealso been disrupted in this environment. Value investorsexploit investors’ overreaction to short-term events in thehope that a company’s stock price will revert to intrinsicvalue once economic conditions improve. This is why therecovery phase of the business cycle is often cited as the“sweet spot” for value, as profits tend to rebound stronglyafter an economic downturn. Yet, this normal bounce-backfor value has been insipid to say the least this time round(Figure 2).Based on the nature of this weak recovery, there is areasonable basis to claim that “this time is different”.Value stocks have experienced the worst recovery inearnings compared to at least the last three businesscycles (see Figure 3 on the next page). In the wake of theGFC, the trough reached in earnings-per-share (EPS) wasfar worse than in any other recent recession and EPS is stillbelow its previous peak. On the other hand, growth stockshave followed a fairly normal EPS path. Taken together,it is hardly surprising that value returns have languishedrelative to growth.2
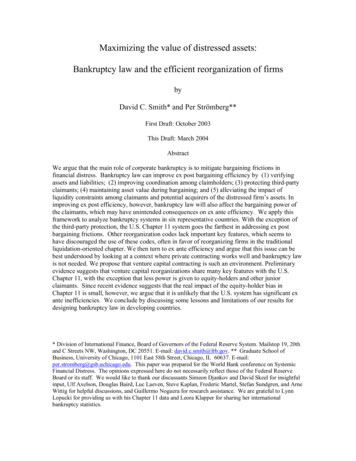
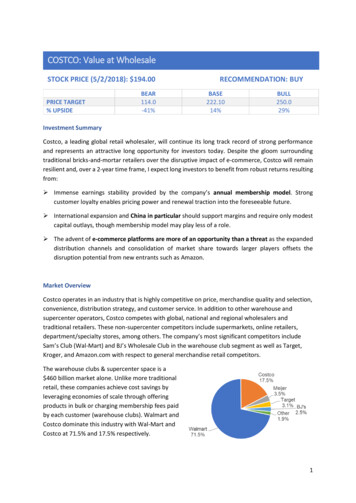
Figure 3: Value has not recovered its previous peak in EPS, while growth stocks have followed a fairly normal EPS pathEPS growth, MSCI USA Value Index rebased to 100EPS growth, MSCI USA Growth Index rebased to 108120Months since previous peakMonths since previous esentEach line begins at 100 with the peak of the previous business cycle, as determined by the National Bureau of Economic Research. Source: Datastream, MSCI, NBER and Schroders.Data from 31 July 1981 to 29 December 2017.Low interest rates have not helped either. From 2008 to2017, the Federal Reserve purchased billions of dollarsof government bonds (among other assets) as part ofits quantitative easing (QE) stimulus programme, whichlowered long-term interest rates. When interest ratesfall, future corporate cash flows are discounted at lowerrates, which raises the present value of those cashflowsand therefore the value of a business. But growth stocks,unlike value, have a greater proportion of their cash flowsoccurring in the distant future, as they are assumed tocontinue growing at a higher rate over time. This makesthem akin to long-duration assets, which are more sensitiveto changes in long-term rates. As a result, growth stockshave benefited far more than value stocks from ratesfalling to record lows5.As well as the level of yields, the shape of the yield curvealso matters. Value has tended to perform better whenthe yield curve has steepened and worse when it hasflattened (Figure 4).Figure 4: The recent flattening of the yield curve hashurt value stocksAverage monthly value premium, %43210-1-2-3Rising term spreadLong-term historyFalling term spreadSince 2007Past performance is not a guide to future performance andmay not be repeated.Value premium calculated using monthly returns of the US Fama/French HML (HighMinus Low) Factor. HML is the return on the “high” portfolio minus the return onthe “low” portfolio where book to market is used as the value metric. Term spreadis calculated as the difference in yield between the US 10-year Treasury yield and3-month Treasury bill. Source: Kenneth French’s Data Library, Datastream andSchroders. Long-term history from 31 January 1962 to 29 December 2017.5One potential reason for this is that the banking sectortends to be most susceptible to the emotional short-termforces that are characteristic of value stocks given itsleverage and economic sensitivity. Banking stocks typicallybenefit from a steeper yield curve because it increases thedifference between what they charge borrowers and whatthey pay for funding.However, the recent experience has favoured growth stocks,as the yield curve has flattened extensively. From 2009 to2012, long-term yields, which are more sensitive to theoutlook for inflation and economic growth, fell as marketspriced in a sluggish economic recovery. When economicgrowth improved in 2013, short-term yields started climbingas investors priced in expectations of interest-rate hikes.Yet long-term yields continued to fall because inflationexpectations, as measured by the break-even inflation rate6,plummeted. Against this backdrop, value has struggled tooutperform growth.The buyback bonanzaLow borrowing costs coupled with the underwhelmingeconomic recovery have also fuelled an astoundingvolume of share buybacks. Over the past 10 years, UScompanies have spent US 4.2 trillion on repurchaseprogrammes, making them the single largest buyer ofUS stocks7. Ever since the US legalised buybacks in 1982,companies have increasingly preferred them to dividendsas a way to return cash to shareholders. This is becausebuybacks offer firms the flexibility to vary cash returns toshareholders as profits oscillate8, whereas dividends requirea long-term commitment to payouts and companies arereluctant to cut their dividends out of fear of sending adistress signal to the market.6The break-even inflation rate is a market-based measure of expected inflation.It is the difference between the yield of a nominal bond and an inflation-linkedbond of the same maturity.7Source: S&P Dow Jones Indices, Datastream, Schroders. Based on data fromQ1 2009 to Q4 2017 on the S&P 500.8Arithmetically – and all other things being equal – buybacks increase EPS byreducing the denominator with which profits are divided to arrive at the earningsper share figure. Assuming the price-earnings ratio remains constant, the stockprice should increase.The long-term correlation between changes in the 10-year Treasury yield and thevalue premium over a 10-year period has been 0.6. Source: Datastream, KennethFrench Data Library, Schroders. Data from 31 January 1962 to 29 December 2017.Value premium represented by the US Fama/French HML (High Minus Low) Factor.3
Historically, dividend payout ratios and dividend yields havetended to be higher for value than for growth9. But therecent popularity of buybacks have rendered this apparentyield advantage somewhat ambiguous. Since value stockstend to reflect more cyclical businesses, they tend tohave less capacity to return excess cash to shareholdersduring bad economic times than growth stocks. In thecurrent economic climate, this has placed value stocks ata significant disadvantage at a time when investors havevalued share buybacks.This divergence in equity supply partly reflects thecorporate weakness and strength of certain industrysectors over the past decade. Many banks rushed to raiseequity to shore up their balance sheets in the aftermathof the GFC. On the other hand, technology firms havedominated the growth narrative since the GFC due to theglobal success of the internet and the product innovationsthat have multiplied that success. Such companies haveaccumulated record piles of cash and ha
It has been a miserable decade for the value style of investing, whose performance has languished behind its rival growth style. The recent low growth and low interest rate environment is largely to blame, as this has favoured growth stocks. However, the major headwinds are abating or even reversing and a significant valuation gap has now opened between value and growth stocks. Investors need .