Transcription
IBM MRO Inventory OptimizationMehtab Gilani IBM WIoT and Industry 4.0 LeaderIBM Services
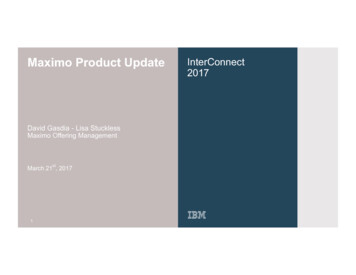
Your assets are talking Are you listening?2
ImperativesDaily challenges impacting your eFinancialPressureInherent RiskExposureAsset ReliabilityKnowledgeAttritionSub-optimalMRO InventorySustainability &RegulatoryRising OperatingCostInability toattract DigitalNative TalentsHealth & Safety
IBM Asset OptimizationDrive SafeReturn onAssetsEnterprise AssetManagementIBM has identified threemajor disciplines thatcontribute to Return onAssets:EAM to manage executionof workAPM to optimizeperformance throughprediction and prescriptiveactionsMRO IO to improve uptimeand cost with betterinventory control4(EAM)MRO InventoryOptimization(MRO IO)AssetPerformanceManagement(APM)
MRO Inventory OptimizationMaterials Management Problem00010039 GEAR, SPUR00010039 GEAR, SPURPrice 112.50Annual Usage12Lead Time32 daysCriticality CodeBMinimum?Maximum? Average (book value)Replacement value (last price)Repair pricePack sizes Variable usageInfrequent demand (MTBF)Variable sizesSet sizesPlanned & unplanned demand Long lead timesLead time variabilityAbility to expediteAlternate suppliersInternal lead time Criticality (business impact)Equipment linkages (BOMs)Work-around optionsStock-out costsx100KWith so much to consider, and constantly changing, how do you set min/max levels accurately?5
MRO Inventory OptimizationMRO InventoryOptimization:Reduce costs andminimize assetdowntime with theright inventory mixDataQualityVisibilityBusinessUnitVisibilityMRO IOSupplierPerformance ractices Retention
MRO Inventory OptimizationClosed-Loop Optimization ProcessIBM MRO InventoryOptimization7
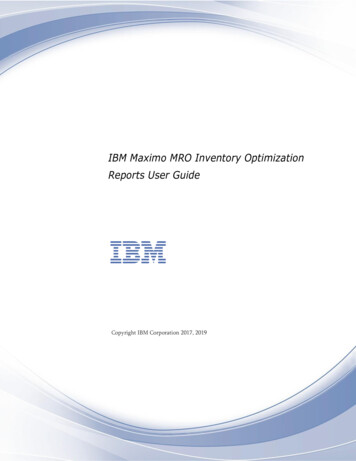
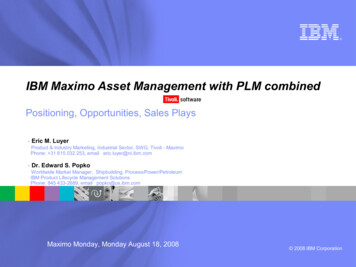
MRO Inventory OptimizationAsset Performance Compared to Inventory Practices - KeyTakeawaysAvg. Asset Downtime vs. Utilization ofSpecialized Inventory Optimization ToolAvg. Asset Downtime vs. Number of Inputsfrom Reliability & Maintenance3.3%3Specialized Inv. Tool? (Y/N)# of Customer %8.%10.%Avg. Downtime from Lack of Spares, Stock Outs12.%0%2%4%6%8%Avg. Downtime from Lack of Spares, Stock OutsSource: Inventory Optimization: A Cross-Industry Comparison of Practices andPerformance – August 2017 Survey8
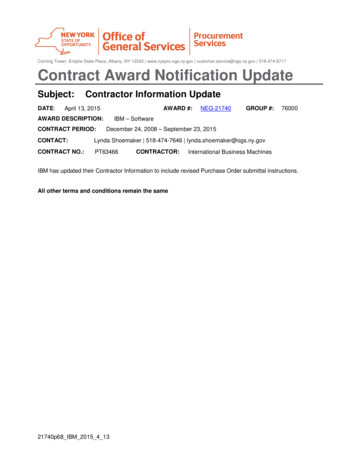
MRO Inventory OptimizationSingle Plant Analysis:-912 Month Projections – Stock Value Changes
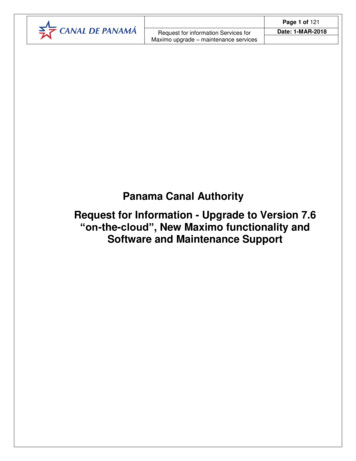
MRO Inventory OptimizationInventory Performance Comparison - EXAMPLESingle site active items only – 1,224 itemsOptimization the right mix, to improve service levels and reduce cost10
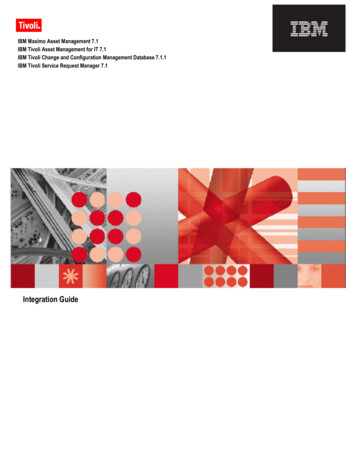
MRO Inventory OptimizationInventory Service Level Visibility:-11Plant A – 30,424 items
Taking ActionIBM Asset Optimization: Pathto ValueAssetOptimizationImmediate ReturnLong Term BenefitsEAMMROIOAPM300% ROI in first 12 months* Savings from MRO Inventory Optimizationfund EAM & APM Optimal Stocking & EOQ Inventory Usage HistorySupercharged EAM & APM Visibility and Control Action on Asset Health Insights Increased Ability to Predict DemandCost SavingsReliabilitySafetyMROIO12* Does vary from client to client and based on detailed opportunity assessment
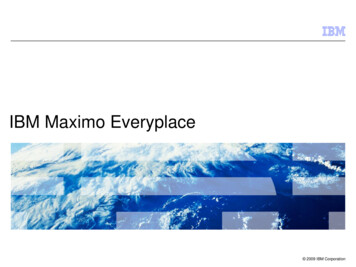
MRO Inventory OptimizationActing on thehighest valuespacesMaterialsCriticality AnalysisInventoryPerformanceVisibilityRisk Based CostAnalysisService LevelAnalysisShared InventoryOptimizationSurplus &Obsolete Analysis30%Reduction in MROInventory Costs50%Reduction in UnplannedDowntime13
MRO Inventory OptimizationFocus: Powerful OutcomesData QualityVisibilityBusiness UnitVisibilityBest PracticeRetentionSupplierPerformance &Bad ActorsHighlight gaps and errorsin current inventory dataprovides guidance on howto address gapsConfigurable to providevisibility into distinctbusiness units based onspecific business goalsand modes of operationIngestion of historic data,addition of best practiceand results of actionstaken.Knowledge transfer andprotection in systemcutoversLead time and servicelevel analysis identifiessuppliers and employeesapplying sub optimalinventory processes14
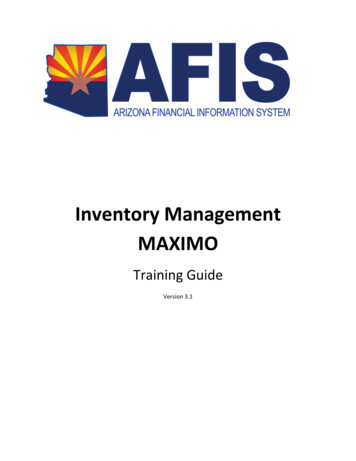
25MInventory reduction in first 12 monthsLargeElectricUtilityEliminated 10%year-on-year MROinventory costgrowthCurbing rising inventory costsA large North American utility had a corporate objective ofbetter managing their critical MRO spare parts inventory,which was growing at a 10% annual rate and impacting theirfinancial performance.Integrating MRO Inventory Optimization* services andsoftware enabled the client to yield a 12.5 million reductionin MRO inventory in the first 12 months, with no negativeimpact on service levels.The client also saw its 10% annual MRO inventory growth rateeliminated to zero, saving 13 million a year; taking netsavings in MRO inventory costs to 25 million within the first12 months of deployment.15*provided by Oniqua, an IBM Company
Criticality Success: Major E&PInventoryRebalanced 34Min 24 Months16 Reliability focused effort to define critical spares Estimated 1,700 man hours per site saved Operations driven initiative to reduce inventory 31M Inventory Run-down 3M Increase based on criticality recommendations
Customer Success: A Major Oil producerInventoryLevelsReduced by%1017 Reduced MRO working capital by 10% insix months at one site aloneLowered inventory levels by at least 10% threeyears in a row Savings at Alaska site funded global implementation Achieved 10’s of millions in savings
Customer Success: One of largest producer of AluminumInventoryReduced by 23.5MIn One Year18 3rd largest producer of aluminum: 23B in revenue Maintenance driven initiative to reduce inventory Goal: identify and optimize obsolete inventory 5M in repairable costs avoided Additional write-offs and reductions ongoing Optimized levels for slow moving inventory Improved strategy for fast moving inventory
IBM Asset OptimizationDrive a SafeReturn onAssetsUsing powerful AI, standarddata platforms and advancedanalytics, IBM AssetOptimization minimizesunplanned repair work,increase asset availability,lower maintenance costs,and reduce the risk ofequipment failure and safetyincidents, increasing theaverage Return on Assetworldwide.20% 15%Reduction in InventoryCarrying CostEnterprise AssetManagement40%Reduction in operationalmaintenance costs throughpredictionMRO InventoryOptimization30% 50%Reduction in MRO InventoryCosts19Increase in Asset LifeAssetPerformanceManagementReduction in UnplannedDowntime60%Labor cost savings from autodetection of asset conditions
Enable Efficient Execution Insight Driven Decisions Unleashed Captive CapitalSafe Return On Assets20
Integrating MRO Inventory Optimization* services and software enabled the client to yield a 12.5 million reduction in MRO inventory in the first 12 months, with no negative impact on service levels. The client also saw its 10% annual MRO inventory growth rate eliminated to zero, saving 13 million a year; taking net