Transcription
A Benchmarking Case Studyof Virtualized HadoopPerformance on VMwarevSphere 5Performance StudyTECHNICAL WHITE PAPER
A Benchmarking Case Study of VirtualizedHadoop Performance on VMware vSphere 5Table of ContentsExecutive Summary .3Introduction.3Why Virtualize?.5Test Setup . 6Hadoop Benchmarks .8Pi .8TestDFSIO .8TeraSort .8Benchmark Results . 9Analysis . 11Pi . 11TestDFSIO . 11TeraSort . 12Conclusion . 14Appendix: Configuration . 15References . 17About the Author . 17Acknowledgements . 17TECHNICAL WHITE PAPER /2
A Benchmarking Case Study of VirtualizedHadoop Performance on VMware vSphere 5Executive SummaryThe performance of three Hadoop applications is reported for several virtual configurations on VMware vSphere5 and compared to native configurations. A well-balanced seven-node AMAX ClusterMax system was used toshow that the average performance difference between native and the simplest virtualized configurations is only4%. Further, the flexibility enabled by virtualization to create multiple Hadoop nodes per host can be used toachieve performance significantly better than native.IntroductionIn recent years the amount of data stored worldwide has exploded, increasing by a factor of nine in the last five1years . Individual companies often have petabytes or more of data and buried in this is business information thatis critical to continued growth and success. However, the quantity of data is often far too large to store andanalyze in traditional relational database systems, or the data are in unstructured forms unsuitable for structuredschemas, or the hardware needed for conventional analysis is just too costly. And even when an RDBMS issuitable for the actual analysis, the sheer volume of raw data can create issues for data preparation tasks like dataintegration and ETL. As the size and value of the stored data increases, the importance of reliable backups alsoincreases and tolerance of hardware failures decreases. The potential value of insights that can be gained from aparticular set of information may be very large, but these insights are effectively inaccessible if the IT costs toreach them are yet greater.Hadoop evolved as a distributed software platform for managing and transforming large quantities of data, andhas grown to be one of the most popular tools to meet many of the above needs in a cost-effective manner. Byabstracting away many of the high availability (HA) and distributed programming issues, Hadoop allowsdevelopers to focus on higher-level algorithms. Hadoop is designed to run on a large cluster of commodityservers and to scale to hundreds or thousands of nodes. Each disk, server, network link, and even rack within thecluster is assumed to be unreliable. This assumption allows the use of the least expensive cluster componentsconsistent with delivering sufficient performance, including the use of unprotected local storage (JBODs).Hadoop’s design and ability to handle large amounts of data efficiently make it a natural fit as an integration, datatransformation, and analytics platform. Hadoop use cases include: Customizing content for users: Creating a better user experience through targeted and relevant ads,personalized home pages, and good recommendations. Supply chain management: Examining all available historical data enables better decisions for stocking andmanaging goods. Among the many sectors in this category are retail, agriculture, hospitals, and energy. Fraud analysis: Analyzing transaction histories in the financial sector (for example, for credit cards andATMs) to detect fraud. Bioinformatics: Applying genome analytics and DNA sequencing algorithms to large datasets. Beyond analytics: Transforming data from one form to another, including adding structure to unstructureddata in log files before combining them with other structured data. Miscellaneous uses: Aggregating large sets of images from various sources and combining them into one(for example, satellite images), moving large amounts of data from one location to another.2Hadoop comprises two basic components: a distributed file system (inspired by Google File System ) and the3computational framework (Google MapReduce ). In the first component, data is stored in Hadoop Distributed FileSystem (HDFS). The file system namespace in the Apache open-source version of HDFS (and in the Clouderadistribution used here) is managed by a single NameNode, while a set of DataNodes do the work of storing andretrieving data. HDFS also manages the replication of data blocks. The exception to HA in Hadoop is theNameNode. While Hadoop provides mechanisms to protect the data, the NameNode is a single point of failure, soin production clusters it is advisable to isolate it and take other measures to enhance its availability (this was notdone for this paper since the focus was on performance). There is also a Secondary NameNode which keeps aTECHNICAL WHITE PAPER /3
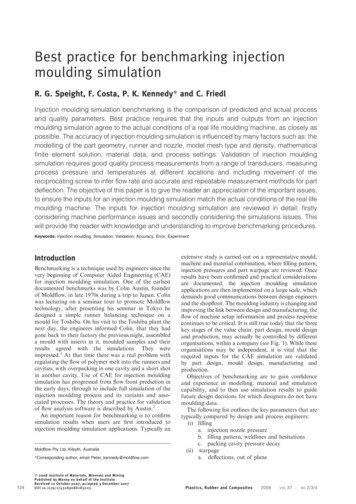
A Benchmarking Case Study of VirtualizedHadoop Performance on VMware vSphere 5copy of the NameNode data to be used to restart the NameNode in case of failure, although this copy may not becurrent so some data loss is still likely to occur.The other basic component of Hadoop is MapReduce, which provides a computational framework for dataprocessing. MapReduce programs are inherently parallel and thus very suited to a distributed environment. Asingle JobTracker schedules all the jobs on the cluster, as well as individual tasks. Here, each benchmark test is ajob and runs by itself on the cluster. A job is split into a set of tasks that execute on the worker nodes. ATaskTracker running on each worker node is responsible for starting tasks and reporting progress to theJobTracker. As the name implies, there are two phases in MapReduce processing: map and reduce. Both use keyvalue pairs defined by the user as input and output. This allows the output of one job to serve directly as input foranother. Hadoop is often used in that way, including several of the tests here. Both phases execute through a setof tasks. Note that the number of map and reduce tasks are independent, and that neither set of tasks is requiredto use all the nodes in the cluster. In Figure 1, a simplified view of a typical dataflow with just one task per node isshown.Figure 1. Simplified MapReduce Dataflow with One Task Per NodeTECHNICAL WHITE PAPER /4
A Benchmarking Case Study of VirtualizedHadoop Performance on VMware vSphere 5Hadoop splits the input data into suitable-sized chunks for processing by the map tasks. These splits need to belarge enough to minimize the overhead of managing files and tasks, but small enough so there is enough parallelwork to do. The map task output is sorted by keys and written not to HDFS, but to local disk (shown in gray). It isthen sent to the appropriate reduce task. This is known as the “shuffle” phase and is typically an all-to-alloperation that often stresses the bandwidth of the network interconnect. The reduce tasks do the finalprocessing and the output is written to HDFS (shown in blue). If there is more than one reducer, the output ispartitioned. A good reference that gives more details on MapReduce, HDFS, and other components is Hadoop:The Definitive Guide4.Since Hadoop jobs can be very large, with some requiring hours on large clusters to execute, the resource costcan be significant. The cost of a job is inversely related to the throughput Hadoop is able to deliver, and thereforeperformance is of utmost importance. CPU, memory, network throughput, and storage capacity and throughputall need to be sized appropriately to achieve a balanced system, and the software layer needs to be able to fullyutilize all these resources. In Hadoop, this means finding enough parallel work to keep all the computationalnodes busy, and scheduling tasks to run such that the data they need are nearly always local (often referred to asmoving the computation to the data, rather than moving data to the computational resources). A small overheador scheduling inefficiency in the virtualization, operating system, or application layers can add up to a largecumulative cost and therefore needs to be understood and quantified.Why Virtualize?Hadoop is a modern application with features such as consolidation of jobs and HA that overlap with capabilitiesenabled by virtualization. This leads some to believe there is no motivation for virtualizing Hadoop; however,there are a variety of reasons for doing so. Some of these are: Scheduling: Taking advantage of unused capacity in existing virtual infrastructures during periods of lowusage (for example, overnight) to run batch jobs. Resource utilization: Co-locating Hadoop VMs and other kinds of VMs on the same hosts. This often allowsbetter overall utilization by consolidating applications that use different kinds of resources. Storage models: Although Hadoop was developed with local storage in mind, it can just as easily use sharedstorage for all data or a hybrid model in which temporary data is kept on local disk and HDFS is hosted on aSAN. With either of these configurations, the unused shared storage capacity and bandwidth within thevirtual infrastructure can be given to Hadoop jobs. Datacenter efficiency: Virtualizing Hadoop can increase datacenter efficiency by increasing the types ofworkloads that can be run on a virtualized infrastructure. Deployment: Virtualization tools ranging from simple cloning to sophisticated products like VMware vCloudDirector can speed up the deployment of Hadoop nodes. Performance: Virtualization enables the flexible configuration of hardware resources.The last item above is the main focus of this paper. Many applications can efficiently use many nodes in a cluster(they scale out well), but lack good SMP scaling (poor scale-up). Many Web servers, mail servers, and Javaapplication servers fall into this category. These can usually be “fixed” in a virtual environment by running severalsmaller VMs per host.Whatever the reason for virtualizing Hadoop, it is important to understand the performance implications of sucha decision to ensure the cost will be reasonable and that there will be sufficient resources. While some of therelevant issues were investigated for this report, there are many more that were left for future work. Amongthese are the trade-offs of different kinds of storage, network tuning, larger scale-out, and more applications.TECHNICAL WHITE PAPER /5
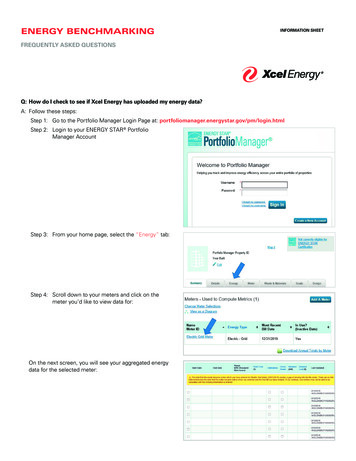
A Benchmarking Case Study of VirtualizedHadoop Performance on VMware vSphere 5Test SetupThe hardware configuration of the test cluster is shown in Figure 2. Seven host servers of an AMAX ClusterMaxsystem were connected to a single Mellanox 10GbE switch. Each host was equipped with two Intel X56502.66GHz 6-core processors, 12 internal 500GB 7,200 RPM SATA disks, and a 10GbE Mellanox adapter. The diskswere connected to a PCIe 1.1 X4 storage controller. This controller has a theoretical throughput of 1 GB/s, but inpractice can deliver 500-600 MB/s. Power states were disabled in the BIOS to improve consistency of results.Intel TurboMode was enabled but it never engaged (probably because of the high utilization of all the cores).Intel Hyper-Threading (HT) Technology was either enabled or disabled in the BIOS depending on the testperformed. Complete hardware details are given in the Appendix.Mellanox 10GbE switchAMAX ClusterMax2X X5650, 96GB12X SATA 500GBMellanox 10GbE adapterFigure 2. Cluster Hardware ConfigurationTwo of the 12 internal disks in each host were mirrored, divided into LUNs, and used to install the native operatingsystem and ESXi hypervisor. During the tests, the I/O to these disks consisted of just logs and job statistics. Theother ten disks were configured as JBODs and used exclusively for Hadoop data. A single aligned partition wascreated on each disk and formatted with EXT4. For the virtualized tests, these disks were passed through to theVMs using physical raw device mappings; this ensured both native and virtual tests used the same underlying filesystems.RHEL 6.1 x86 64 was used as the operating system (OS) in all tests. The native and virtual OS configurationswere nearly the same, but there were some differences. The native tests used all the CPUs and memory of themachine. In the virtual tests, all the CPUs were split between the VMs (that is, CPUs were exactly-committed)while a few gigabytes of memory were held back for the hypervisor and VM memory overhead (slightly undercommitted). The Mellanox MLNX EN (version 1.5.6) driver was installed in the native OS, with enable sys tuneturned on (this significantly lowers network latency). In ESXi, a development version of this driver was used. Thelatter is expected to be released soon. The virtual adapter was vmxnet3. Default networking parameters wereused both in ESXi and in the guest OS. Sun Java 6 is recommended for Hadoop; version 1.6.0 25 was used here.Two kernel tunables were increased. These and other OS details are given in the Appendix.TECHNICAL WHITE PAPER /6
A Benchmarking Case Study of VirtualizedHadoop Performance on VMware vSphere 5The Cloudera CDH3u0 version of Apache Hadoop was installed in all machines. Replication was set to 2, as iscommon for small clusters (large clusters should use 3 or more). The HDFS block size was increased to 128MBfrom the 64MB default. Most of machine memory was used for the Java heap. In the native case, the maximumwas set to 2048MB. Slightly less, 1900MB, was used for the virtual tests since the total VM memory allocated wassmaller. A few other Hadoop parameters were changed from their defaults and are listed in the Appendix.Probably the most important Hadoop parameters are the numbers of map and reduce tasks. The number of eachwas different for each benchmark but was the same when comparing native configurations and the variousvirtual tests. This leaves open the possibility that the particular number of tasks used was more optimal on oneplatform (native or virtual) than another; this was not investigated here. However, it was observed that theperformance of the heavy I/O tests was not very sensitive to the number of tasks.All of the hosts/VMs were used as Hadoop worker nodes. Each worker node ran a DataNode, a TaskTracker, anda set of map and reduce tasks. The NameNode and JobTracker were run on the first worker node, and theSecondary NameNode was run on the second worker node. It is often advised to run these three managementprocesses on machines separate from the worker nodes for reliability reasons. In large clusters it is necessary todo so for performance reasons. However, in small clusters these processes take very little CPU time, so dedicatinga machine to them would reduce overall resource utilization and lower performance.In the 2-VM/host tests, all the hardware resources of a host were evenly divided between the VMs. In addition,each VM was pinned to a NUMA node (which for these machines is a socket plus the associated memory) forbetter reproducibility of the results. The native, 1-VM, and 2-VM tests are described as homogeneous because themachines/VMs are all the same size. For the 4-VM/host tests a heterogeneous configuration was chosen wheretwo small and two large VMs were used on each host. The small VMs were assigned two data disks, five vCPUs,and 18400MB each, while the large VMs were assigned three data disks, seven vCPUs, and 27600MB. One of eachwas pinned to each NUMA node. The number of tasks per Hadoop node was then configured to be eitherproportional to the number of vCPUs (for computational tests), or to the number of disks (for I/O tests). Clearly,the use of heterogeneous configurations raises many issues, of which only a few will be discussed here.As mentioned previously, all of the present tests were performed with replication 2. This means each originalblock is copied to one other worker node. However, when multiple VMs per host are used, there is the undesirablepossibility from a single-point of failure perspective that the replica node chosen is another VM on the same host.Hadoop manages replica placement based on the network topology of a cluster. Since Hadoop does not discoverthe topology itself, the user needs to describe it in a hierarchical fashion as part of the input (the default is a flattopology). Hadoop uses this information both to minimize long-distance network transfers and to maximizeavailability, including tolerating rack failures. Virtualization adds another layer to the network topology that needsto be taken into account when deploying a Hadoop cluster: inter-VM communication on each host. Equating theset of VMs running on a particular host to a unique rack ensures that at least the first replica of every block is sentto a VM on another host. From a benchmarking point of view, defining an appropriate topology also ensures thatthe multiple-VM cases do not make replicas local to their hosts and thereby (inappropriately) gain a performanceadvantage over the single-VM and native configurations.TECHNICAL WHITE PAPER /7
A Benchmarking Case Study of VirtualizedHadoop Performance on VMware vSphere 5Hadoop BenchmarksSeveral benchmarks were created from three of the example applications included with the Cloudera distribution:Pi, TestDFSIO, and TeraSort. Table 1 summarizes the maximum number of simultaneous map and reduce tasksacross the cluster for the various benchmarks. These were the same for native and all the virtual configurations.BENCHMARKMAPREDUCEHT onHT offHT onHT ValidateTable 1. Maximum Total Number of Simultaneous Tasks per JobPiPi is a purely computational application that employs a Monte Carlo method to estimate the value of pi. It is verynearly “embarrassingly parallel”: the map tasks are all independent and the single reduce task gathers very littledata from the map tasks. There is little network traffic or storage I/O. All the results reported here calculate 1.68trillion samples. These are spread across 168 total map tasks (HT enabled) or 84 map tasks (HT disabled). Forboth homogeneous and heterogeneous cases, the number of map tasks per Hadoop node is equal to the numberof CPUs or vCPUs. All the map tasks start at the same time and the job finishes when the last map task completes(plus a trivial amount of time for the reduce task). It is important that all map tasks run at the same speed andfinish at about the same time for good performance. One slow map task can have a significant effect on elapsedtime for the job.TestDFSIOTestDFSIO is a storage throughput test that is split into two parts here: TestDFSIO-write writes 1000020MB(about 1TB) of data to HDFS, and TestDFSIO-read reads it back in. Because of the replication factor, the write testdoes twice as much I/O as the read test and generates substantial networking traffic. A total of 140 map taskswere found to be close to optimal for the HT disabled case, while 70 map tasks were not enough and 210 gaveclose to the same performance as 140. The same number of tasks was used for the HT-enabled tests sinceadditional CPU resources were not expected to help this I/O dominated benchmark. The number of map tasksper worker node in the heterogeneous case was made proportional to the number of available disks (that is, fourfor the small VMs, six for the large).TeraSortTeraSort sorts a large number of 100-byte records. It does considerable computation, networking, and storageI/O, and is often considered to be representative of real Hadoop workloads. It is split into three parts: generation,sorting, and validation. TeraGen creates the data and is similar to TestDFSIO-write except that significantcomputation is involved in creating the random data. The map tasks write directly to HDFS so there is no reducephase. TeraSort does the actual sorting and writes sorted data to HDFS in a number of partitioned files. Theapplication itself overrides the specified replication factor so only one copy is written. The philosophy is that if adata disk is lost, the user can always rerun the application, but input data needs replication since it may not be aseasily recovered. TeraValidate reads all the sorted data to verify that it is in order. The map tasks do this for eachTECHNICAL WHITE PAPER /8
A Benchmarking Case Study of VirtualizedHadoop Performance on VMware vSphere 5file independently, and then the single reduce task checks that the last record of each file comes before the firstrecord of the next file. Results are reported for two sizes that often appear in published Hadoop tests: 10 billionrecords (“1TB”) and 35 billion records (“3.5TB”). A total of 280 map tasks was used for TeraGen, 280simultaneous (several thousand in all) map tasks and 70 reduce tasks for TeraSort, and 70 map tasks forTeraValidate.Benchmark ResultsTable 2 and Table 3 present elapsed time results with HT disabled and enabled respectively.BENCHMARKNATIVEVIRTUAL1 VM2 ad499532453TeraGen 1TB664700580TeraSort 1TB2,9953,1273,110TeraValidate 1TB569481495TeraGen 3.5TB2,3282,5042,030TeraSort 3.5TB13,46014,86312,4942,7832,7452,552TeraValidate 3.5TBTable 2. Elapsed Time in Seconds with HT Disabled (lower is better; number of VMs shown is per host)BENCHMARKNATIVEVIRTUAL1 VM2 VMs4 SIO-read471443433427TeraGen 1TB659718572598TeraSort 1TB2,6293,0012,7922,450TeraValidate 1TB470601544480TeraGen 3.5TB2,2892,5171,9682,302TeraSort 3.5TB13,71214,35312,67313,054TeraValidate 3.5TB2,4602,5632,3243,629Table 3. Elapsed Time in Seconds with HT Enabled (lower is better; number of VMs shown is per host)Figure 3 and Figure 4 show the elapsed time results for the virtual cases normalized to the corresponding nativecases with HT disabled and enabled respectively.TECHNICAL WHITE PAPER /9
A Benchmarking Case Study of VirtualizedHadoop Performance on VMware vSphere 51.2Ratio to Native1.00.80.60.41 VM2 VMs0.20.0Figure 3. Elapsed Time with HT Disabled Normalized to the Native Case (lower is better)1.61.4Ratio to Native1.21.00.80.60.41 VM2 VMs4 VMs0.20.0Figure 4. Elapsed Time with HT Enabled Normalized to the Native Case (lower is better)TECHNICAL WHITE PAPER /10
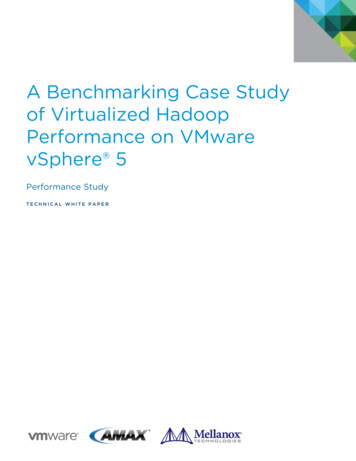
A Benchmarking Case Study of VirtualizedHadoop Performance on VMware vSphere 5AnalysisPiPi is 4-10% faster for all of the virtual cases than for the corresponding native cases. This is an unexpected resultsince normally pure CPU applications show a 1-5% reduction in performance when virtualized. There is a smallcontribution from map tasks not executing at the same rate (a function of the Linux and ESXi schedulers) whichis reflected in how long the reduce task runs (the reduce task starts running when the first map task finishes).Differences in the schedulers may account for 1-2% of the differences in performance. Another Hadoop statisticshows the sum of the elapsed times of all the map tasks. This is up to 9% less for the virtual cases. Together with100% CPU utilization in all cases, this means that each map task is running faster in a VM. Investigations are ongoing to better understand this behavior. Enabling HT reduces the elapsed time by 12% for the native case and 1518% for the virtual cases.TestDFSIOTestDFSIO is a stress test for high storage throughput applications. The results show that in three out of the four1-VM cases (write/read, HT disabled/enabled) virtual is 7-10% slower than the corresponding native cases. In thefourth 1-VM case and all the multi-VM cases, virtual is 4-13% faster. In this kind of test (sequential throughput,lightly-loaded processors) it is expected that throughput would be strictly limited by hardware (in this case thestorage controller), and that the variation among software platforms would be much less. A partial explanationfor the observed behavior can be seen from Figure 5, which shows the total write throughput on one of the hostswith different numbers of VMs and HT enabled. The average throughput is lower for the 1-VM case not becausethe peak throughput is lower, but because the throughput is much noisier in time. Data shown was collected inesxtop at 20 second intervals. With finer intervals, throughput actually drops to zero for a few seconds at a time.These drops are synchronized across all the nodes in the cluster, indicating they are associated with theapplication and not the underlying platform. With two VMs per host, the throughput is much more consistent andeven more so with four VMs. The native case exhibits noise comparable to the single-VM case. It is notunderstood why more VMs improves the throughput behavior. One possibility is that a single Hadoop node hasdifficulty scheduling I/O fairly to ten disks and that it can do a better job when fewer disks are presented to it.Although the throughput is substantially higher for four VMs than two VMs for much of the duration of the test,the former finishes only 2% sooner. This is because the heterogeneity of the 4-VM case makes it difficult for allthe tasks to finish at about the same time as in the 2-VM case. By adjusting the number of tasks per node, the testwrites a number of original files to each node in proportion to the number of disks it has. However, the replicasare spread evenly across all the nodes, destroying this proportionality. Heterogeneous Hadoop nodes have thepotential to be useful, but the trade-offs will be difficult to understand. HT does not have a consistent effect onperformance, which is to be expected for a workload with low CPU utilization.TECHNICAL WHITE PAPER /11
A Benchmarking Case Study of VirtualizedHadoop Performance on VMware vSphere 5600Write Throughput, MB/s5004003001 VM2 VMs4 VMs20010000100200300400500600700800Time, SecondsFigure 5. TestDFSIO Write Throughput on One of the Hosts (HT enabled)TeraSortThe three TeraSort benchmarks also show excellent performance overall when virtualized.There is a significant amount of noise in the execution time of all three tests on both native and virtual platforms,especially TeraValidate. This is partly due to the greater complexity of the applications, but mostly due to the“long pole” effect where a single long-running task can have an out-sized effect on the total elapsed time. Using a3.5
A Benchmarking Case Study of Virtualized Hadoop Performance on VMware vSphere 5 Hadoop splits the input data into suitable-sized chunks for processing by the map tasks. These splits need to be large enough to minimize the overhead of managing files and tasks, but small enough so there is enough parallel work to do.