Transcription
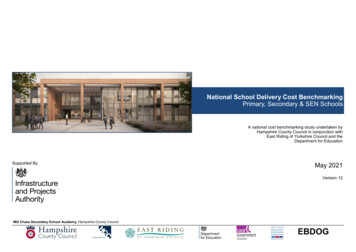
National School Delivery Cost BenchmarkingPrimary, Secondary & SEN SchoolsA national cost benchmarking study undertaken byHampshire County Council in conjunction withEast Riding of Yorkshire Council and theDepartment for EducationSupported ByMay 2021Version 12Mill Chase Secondary School Academy, Hampshire County CouncilEBDOG
National School Delivery Cost Benchmarking Primary, Secondary & SEN Schools Regional Snapshot for Primary SchoolsIntentionally BlankEBDOGPage 2 of 33May 2021
National School Delivery Cost Benchmarking Primary, Secondary & SEN SchoolsPart One Report ContextContentsThis publication is split into five distinct sections, namely; report context, primary schools, secondary schools, SEN schools and further information. These sections are shownbelow along with their key outputs.Part One Report ContextStudy Background4Contributing Authorities5Part Two Primary SchoolsOverview7Annual Cost Trajectory9Alternative Delivery Model Cost Trajectory10New Development Summary11Re-Build & Extension Summary13Refurbishment Summary15Part Three Secondary SchoolsOverview18Annual Cost Trajectory19Re-Build & Extension Summary20New Development & Refurbishment Summary22Part Four SEN SchoolsOverview24Re-Build & Extension Summary25New Development & Refurbishment Summary27Part Five Further InformationFuture Publications30Definitions of Key Terms31Publication Contacts32Wyton Primary School, Cambridgeshire County Council1008projects submittedEBDOGPage 3 of 33May 2021
National School Delivery Cost Benchmarking Primary, Secondary & SEN SchoolsPart One Report ContextStudy BackgroundThis document publishes the results of a national cost benchmarking exerciseundertaken by Hampshire County Council in partnership with East Riding of Yorkshire The following criteria were used to select projects for this study:Council on new build, extended and refurbished primary, secondary and SEN Primary, secondary or SEN school projects.schools. Permanent new build, extended or refurbished school projects.This report provides a useful reference point for Local Authorities when establishing Contract formed since 2012.their school building costs. As part of the initiative the Local Government Association(LGA) is seeking to encourage greater collaboration between Local Authorities toFull details of how the data has been adjusted can be found on page 31.drive down new and refurbished school costs. A benchmarking workshop was held on6 October 2017 to discuss the output of the 2017 study and the presentation ofIndustry Summaryinformation included and analysed in that report. As a result some additional features The July 2020 quarterly briefing from the Royal Institution of Chartered Surveyorshave been included this time. It is also intended to further develop the data following (RICS) Building Cost Information Service (BCIS) have recently advised that they anticithe workshop and publish any additional findings.pate construction output to rise by 16% over the next five years, with construction costsrising by 17% and tender prices increasing by 21%.The findings contained within this report have been shared with the Infrastructure andProjects Authority (IPA) which is part of the Cabinet Office, and Department for Education (DfE). This report is the seventh publication produced for the public sector andis a valuable tool to understand the total costs associated with providing new schoolplaces across the country.This study has been undertaken with funding from the LGA and has been conductedin conjunction with the following organisations: Education Building and Development Officers Group (EBDOG). National Association of Construction Frameworks (NACF).The project sample used in this report comprises 1008 projects from across England,consisting of: 690 primary school projects 205 secondary school projects 12 All-Through school projects 63 SEN school projects 38 projects not used (due to poor or inconsistent data)384,000 5.57 billionschool placescombined project capital valueCommon StandardA common standard of cost analysis has been used to capture cost data, ensuring ahigh level of consistency across the sample, while including detailed cost andbackground information on each project – allowing the costs to be fully understood onan individual project basis. The data has then been collated at a common price base,in order to compare projects with each other on level terms.EBDOGPage 4 of 33May 2021
National School Delivery Cost Benchmarking Primary, Secondary & SEN SchoolsReportPartOneContext Report ContextContributing AuthoritiesWe are grateful to all Local Authorities who have contributed projects to this study. In addition to data submitted directly from authorities, we are also grateful to have received anew sample from the Department for Education (DfE) of DfE capital programme schemes. The list below shows the areas covered by the study.Amber Valley Borough CouncilBath & North East Somerset CouncilBirmingham City CouncilBolton Metropolitan Borough CouncilBracknell Forest CouncilBradford Metropolitan District CouncilBrighton & Hove CouncilBristol City CouncilBuckinghamshire County CouncilBury Metropolitan Borough CouncilCalderdale Metropolitan Borough CouncilCambridge City CouncilCambridgeshire County CouncilCentral Bedfordshire CouncilCheshire East Council (Unitary)Cheshire West and Chester CouncilChichester District CouncilCity of York CouncilCornwall Council (Unitary)Coventry City CouncilCumbria County CouncilDaventry District CouncilDerby City CouncilDevon County CouncilDoncaster Metropolitan Borough CouncilDorset County CouncilDover District CouncilDurham County CouncilEast Riding of Yorkshire CouncilEast Sussex County CouncilElmbridge Borough CouncilEpsom and Ewell Borough CouncilErewash Borough CouncilEssex County CouncilGateshead Metropolitan Borough CouncilGloucestershire County CouncilHalton Borough CouncilHampshire County CouncilHarrow CouncilHartlepool Borough CouncilHertfordshire county CouncilIsle of Wight CouncilKent County CouncilKingston-Upon-Hull city councilKirklees CouncilLancashire County CouncilLeeds City CouncilLeicester City CouncilLewes District CouncilLincolnshire County CouncilLiverpool City CouncilLondon Borough of Barking and DagenhamLondon Borough of BarnetLondon Borough of BexleyLondon Borough of BrentLondon Borough of BromleyLondon Borough of CamdenLondon Borough of CroydonLondon Borough of EalingLondon Borough of EnfieldLondon Borough of Hammersmith & FulhamLondon Borough of HarrowLondon Borough of HaveringLondon Borough of HillingdonLondon Borough of HounslowLondon Borough of IslingtonLondon Borough of LambethLondon Borough of LewishamLondon Borough of MertonLondon Borough of NewhamLondon Borough of RedbridgeLondon Borough of Richmond upon ThamesLondon Borough of SouthwarkLondon Borough of SuttonLondon Borough of Tower HamletsLondon Borough of Waltham ForestLondon Borough of WandsworthLondon Borough of WestminsterLuton Metropolitan Borough CouncilManchester City CouncilMedway CouncilNorfolk County CouncilNorth East Lincolnshire CouncilNorth Lincolnshire CouncilNorth Somerset CouncilNorth Tyneside Metropolitan Borough CouncilNorth Yorkshire County CouncilNorthampton Borough CouncilNorthamptonshire County CouncilNorthumberland Council UnitaryNorwich City CouncilNottingham City CouncilNottinghamshire County CouncilOldham Metropolitan Borough CouncilOxfordshire County CouncilPeterborough City CouncilPlymouth City CouncilPortsmouth City CouncilReading Borough CouncilRedcar & Cleveland CouncilReigate and Banstead BoroughWigan Metropolitan Borough CouncilCouncilWiltshire Council (Unitary)Rotherham Metropolitan BoroughWirral CouncilCouncilWoking Borough CouncilRoyal Borough of GreenwichWokingham Borough CouncilRoyal Borough of Kensington andWolverhampton City CouncilChelseaWorcestershire County CouncilRoyal Borough of Windsor andWorthing Borough CouncilMaidenheadRutland County CouncilSalford City CouncilSandwell Metropolitan BoroughCouncilSefton Metropolitan Borough CouncilSheffield City CouncilShropshire Council (Unitary)Slough Borough CouncilSomerset County CouncilSouth Gloucestershire CouncilSouth Lakeland District CouncilSouth Tyneside CouncilSouthampton City CouncilSpelthorne Borough CouncilSt Helens Metropolitan BoroughCouncilStafford Borough CouncilStaffordshire County CouncilStockport Metropolitan BoroughCouncilStockton-on-Tees Borough CouncilStoke-on-Trent City CouncilSuffolk County CouncilSunderland City CouncilSurrey County CouncilSwindon Borough CouncilTameside Metropolitan BoroughCouncilTaunton DeaneThanet District CouncilThurrock CouncilTorbay CouncilTrafford Metropolitan Borough CouncilTunbridge Wells Borough CouncilWakefield Metropolitan Borough CouncilWakefield Metropolitan District CouncilWalsallWarrington Borough CouncilWarwickshire County CouncilLocal Authority AreasWest Berkshire CouncilWest Sussex County Councilcovered across England150 Crown copyright and database rights 2019 Ordnance Survey 100019180EBDOGPage 5 of 33May 2021
National School Delivery Cost Benchmarking Primary, Secondary & SEN SchoolsPart TwoPrimary SchoolsCivitas Academy, Reading Borough CouncilEBDOGPage 6 of 33May 2021
National School Delivery Cost Benchmarking Primary, Secondary & SEN SchoolsPart Two Primary SchoolsOverviewProject CategoriesThe primary school sample consists of 690 projects which are split into three schoolcategories as shown in the pie chart (right). This sample features projects from2012 to 2019 with a total combined capital value of 2.50 billion, comprising: 114 New Development projects 511 Re-Build & Extension projects 65 Refurbishment projects690primary schoolsThe majority of the primary school sample consists of Re-Build & Extension projects,continuing the trend that Local Authorities are expanding existing school sites tomeet the increasing demand for pupil places. However, New Development projectson greenfield sites have seen a 20% increase in number since the last report. Thisrise tends to reflect the growth in new school places associated with major developments and reduced viability of providing new school places on existing sites.178,000new primary places 2.50 billioncapital value of primary school sampleSt Leonard's School. Devon County CouncilEBDOGPage 7 of 33May 2021
National School Delivery Cost Benchmarking Primary, Secondary & SEN SchoolsPart Two Primary SchoolsOverviewNew Development Primary SchoolsGross and nett rates plus average elemental cost breakdown have been provided this year for new build developments. This provides a cost per m2 of the main buildingelements and the percentage of the cost each element represents drawn from the entire whole sample.Average Elemental Costs per m2 for Primary SchoolsEBDOGPage 8 of 33May 2021
National School Delivery Cost Benchmarking Primary, Secondary & SEN SchoolsPart Two Primary SchoolsAlternative Delivery Model Cost TrajectoryRe-Build & Extension projects are formed from a combination of new blocks,extensions to existing schools and re-build projects on the existing site. Thesample used for comparing Local Authority with DfE procured schemes hasbeen restricted to projects with a GIFA of over 750m²Graph 2 Re-Build & Extension Gross Costs per m²Graph 2 (right) displays a cost trajectory for the DfE projects alongside thosefrom Local Authorities. The total sample size has continued to increase yearon year with 8 years of data now available. The graph illustrates that grosscosts differences between DfE and Local Authority projects have been narrowing over time. The difference between the Local Authority and DfE figuresover the last 4 years have reduced to an average of 11.8%, in comparison tothe first 4 years of the study where the average difference was 29.9%. Overthe duration of the study the difference between the Local Authority and DfEcosts has reduced by just over half. 2018 did see the difference widen slightlyin that one year but the 2019 data indicates it reducing again to around 9.4%.The DfE sample size is extremely small for 2019 and so, at this stage, this figure cannot be relied upon.There are a number of factors influencing the lower costs of DfE projects including projects being generally larger, benefitting from economies of scaleand batching into programmes of work.Early indications from the data suggest that market costs are rising in 2019 butfuture data in the next annual report will better assess if this trend is confirmed.The impact of the pandemic on procurement and delivery has not yet fedthrough to the data as project costs are reported on completion.Figure 2 (right) displays the average costs per year alongside the number ofprojects in each year banding.EBDOGPage 9 of 33May 2021
National School Delivery Cost Benchmarking Primary, Secondary & SEN SchoolsPart Two Primary SchoolsAnnual Cost TrajectoryPrimary school gross costs as a whole sample have increased by 1.5%since 2012, after indexing, The sample size of projects hasincreased from the 2019 data capture increasing the level of confidence to the figures.The graph indicates that 2017 represented the lowest point of the gross costs trendswhich has since increased slightly in 2019 and 2020. There are a number of reasons forthe fluctuations evidenced in the cost trajectory over the last eight years (Graph 1, right)which are outlined below.Graph 1 Primary School Average Gross Costs per m²New DevelopmentProjects built on greenfield sites with 100% of the works being new build saw a steadyreduction in gross costs from 2012 to 2017, although there was a spike in costs in 2016.The costs since 2018 have shown an increase of 4.9%. Overall in the last eight yearscosts have reduced by 23.7%. The positive trend indicated is likely to be as a result of theadoption of a standardised approach to design; more delivery through collaborative arrangements and adopting a more cost driven approach.In 2016 the new build gross cost rose which is considered to be areflection of the market conditions, Brexit and the impact of the increasein housing output on prevailing prices.Re-Build & ExtensionExtensions to existing school buildings, new teaching blocks andre-built schools on existing sites have seen a downward trajectory for cost up to 2018.The costs since 2018 have shown an increase of 15.8%.(no data available for 2020)Overall in the last eight years costs have decreased by 1.3%. A number of factors influence this trend (N.B. page 10 dataset used as comparator).RefurbishmentDue to the varying nature of refurbishment projects it is difficult to draw conclusiveresults from the cost trajectory. Due to no projects being submitted for 2019 & 2020,there is a lower level of confidence in the data.Figure 1 (right) displays the average costs per year alongside thenumber of projects in each year banding.EBDOGPage 10 of 33May 2021
National School Delivery Cost Benchmarking Primary, Secondary & SEN SchoolsPart Two Primary SchoolsNew Development SummaryGraph 3 New Development Gross & Nett Costs per m²New Development projects are new schools built on greenfield sites, which includesignificant infrastructure and external work costs. There are 114 such projects in thisstudy. Graph 3 (right) displays the gross and nett costs per m² for these projects. Adetailed breakdown is shown on page 12.Stoneham Park Primary Acadamy. Hampshire County Council1,962m² 5.70m²average floor areaaverage GIFA per pupil placeKey DefinitionsNew DevelopmentAny project where 100% of the works being undertaken are new buildand the site used is a greenfield site. Includes significant infrastructureand external works.44wksaverage contract period 3,357average gross cost /m2Location FactorAll costs have been normalised to a common UK average price levelusing regional location factors published by BCIS to accord with the UKMean 100. Index taken at March 2020. 2,257 23,886average nett cost /m2average cost per pupil placeInflationAll costs have been updated to the latest Building Cost InformationService (BCIS) ALL-IN Tender Price Index (TPI) of 1st Quarter 2020 of336. Index taken from April 2020 data forecasts. This adjusts costs forinflation. VAT is excluded throughout.Further definitions of key terms and footnotes outlining how the data has been treated can be found on page 31.EBDOGPage 11 of 33May 2021
National School Delivery Cost Benchmarking Primary, Secondary & SEN SchoolsPart Two Primary SchoolsNew Development SummaryA detailed breakdown of average costs by GIFA bands is shown in the table below.Some key analysis from this data set is summarised below:ProcurementThe study has demonstrated that the majority of New Development projects areprocured via two stage open book tendering.Form of ConstructionThe majority of projects use a steel frame with a composite cladding system. Asmall number of schemes use modular forms of construction, which on averagereduce contract periods by about 15% on a typical school build when compared toan equivalent sample of steel frame projects.InfrastructureDue to the nature of these projects a significant investment in infrastructure andexternal works is evidenced throughout the sample. On average this infrastructurecost is 10% higher than seen throughout an equivalent sample of Re-Build & Extension projects where the existing site is used.Key DefinitionsNew DevelopmentAny project where 100% of the works being undertaken are new buildand the site used is a greenfield site. Includes significant infrastructureand external works.Location FactorAll costs have been normalised to a common UK average price levelusing regional location factors published by BCIS to accord with the UKMean 100. Index taken at March 2020.InflationAll costs have been updated to the latest Building Cost InformationService (BCIS) ALL-IN Tender Price Index (TPI) of 1st Quarter 2020 of336. Index taken from April 2020 data forecasts. This adjusts costs forinflation. VAT is excluded throughout.Further definitions of key terms and footnotes outlining how the data has been treated can be found on page 31.EBDOGPage 12 of 33May 2021
National School Delivery Cost Benchmarking Primary, Secondary & SEN SchoolsPart Two Primary SchoolsRe-Build & Extension SummaryGraph 4 Re-Build and Extension Gross and Nett costs per m²Re-Build & Extension projects are formed from acombination of new blocks, extensions to existingschools and re-build projects on the existing site. In mostcases there are elements of demolition and some projects include refurbishment work to existing buildings.In total, 511 Re-Build & Extension projects weresubmitted to the study, Graph 4 (right) displays the grossand nett costs per m² for these projects. A detailedbreakdown is shown on page 14.The sample includes 128 DfE schemes submitted by theDfE, these projects include local authoritycontributions where applicable.Whitehouse Primary School, Suffolk County Council1,285m² 5.26m²average floor areaaverage GIFA per pupil place30wksaverage contract period 3,099average gross cost /m2Key DefinitionsLocation FactorRe-Build & ExtensionAll costs have been normalised to a common UK average price levelAny project where over 50% of the works being undertaken are newbuild, where the site used is adjacent to or the same as the existing site. using regional location factors published by BCIS to accord with the UKIncluding new build blocks, extensions to existing buildings and rebuilds Mean 100. Index taken at March 2020.which include elements of demolition.Further definitions of key terms and footnotes outlining how the data has been treated can be found on page 31. 2,110average nett cost /m2 17,650average cost per pupil placeInflationAll costs have been updated to the latest Building Cost InformationService (BCIS) ALL-IN Tender Price Index (TPI) of 1st Quarter 2020 of336. Index taken from April 2020 data forecasts. This adjusts costs forinflation. VAT is excluded throughout.EBDOGPage 13 of 33May 2021
National School Delivery Cost Benchmarking Primary, Secondary & SEN SchoolsPart Two Primary SchoolsRe-Build & Extension SummaryA detailed breakdown of average costs by GIFA bands is shown in the table below.Some key analysis from this data set issummarised below.ProcurementThe study demonstrates that the Re-Build & Extension projects are procured via a numberof different methods which include single stage and two stage tendering.Form of ConstructionThe majority of projects use a steel frame with a composite cladding system. A small number of schemes use modular forms of construction, which on average reduce contract periods by 11% when compared to an equivalent sample of steel frame projects.InfrastructureDue to the nature of Re-Build & Extension projects, where the existing site is maintained,the costs associated with infrastructure are low, representing 15% of the total project coston average across the sample.Key DefinitionsLocation FactorRe-Build & ExtensionAll costs have been normalised to a common UK average price levelAny project where over 50% of the works being undertaken are newbuild, where the site used is adjacent to or the same as the existing site. using regional location factors published by BCIS to accord with the UKIncluding new build blocks, extensions to existing buildings and rebuilds Mean 100. Index taken at March 2020.which include elements of demolition.Further definitions of key terms and footnotes outlining how the data has been treated can be found on page 31.InflationAll costs have been updated to the latest Building Cost InformationService (BCIS) ALL-IN Tender Price Index (TPI) of 1st Quarter 2020 of336. Index taken from April 2020 data forecasts. This adjusts costs forinflation. VAT is excluded throughout.EBDOGPage 14 of 33May 2021
National School Delivery Cost Benchmarking Primary, Secondary & SEN SchoolsPart Two Primary SchoolsRefurbishment SummaryRefurbishment projects vary considerably in nature which makes trendsand benchmarking difficult. We have split these schemes into three typesof refurbishment project, namely light, medium and heavy to try and limitthe variations.Graph 5 Refurbishment Gross and Net costs per m²In total, 65 refurbishment projects were submitted to the study, Graph 5(right) displays the gross and net costs per m² for these projects. A detailed breakdown is shown on page 16.Full definitions of light, medium and heavy refurbishment used for thisstudy can be found on page 31.Wilson Primary School, Reading Borough Council1,302m² 5.99m²average floor areaaverage GIFA per pupil place36wksaverage contract period 2,214average gross cost /m2Key DefinitionsRefurbishmentLocation FactorAny project which contains significant alterations or less than 50% new All costs have been normalised to a common UK average price levelbuild to existing buildings. The works are further categorised as light,using regional location factors published by BCIS to accord with the UKmedium and heavy refurbishment. See further definitions for these levels Mean 100. Index taken at March 2020.on page 31 14,713average cost per pupil placeInflationAll costs have been updated to the latest Building Cost InformationService (BCIS) ALL-IN Tender Price Index (TPI) of 1st Quarter 2020 of336. Index taken from April 2020 data forecasts. This adjusts costs forinflation. VAT is excluded throughout.Further definitions of key terms and footnotes outlining how the data has been treated can be found on page 31.EBDOGPage 15 of 33May 2021
National School Delivery Cost Benchmarking Primary, Secondary & SEN SchoolsPart Two Primary SchoolsRefurbishment SummaryA detailed breakdown of average costs by GIFA bands is shown in the table below.Some key analysis from this data set is summarised below:This study has demonstrated that heavy refurbishment projects which typically extendthe economic life of a building by approximately 15 - 25 years, have an average grosscost per m² of 3,006. This represents a 22.5% increase when compared to a sample ofequivalent medium refurbishment projects which typically increase the economic life ofa building by up to 15 years. Given that heavy refurbishment projects include significantstructural alterations and may also include the replacement of facades and roof finishes,this additional cost would be expected. The above is indicative as the majority of thesample (53 in number) comprise medium refurbishment projects.The sample of heavy and light refurbishment projects is 8 and 4 projects respectively.Projects within the dataset vary considerably, as is the nature ofrefurbishment schemes and therefore it is difficult to draw any firm trends across thesample.Key DefinitionsLocation FactorRefurbishmentAny project which contains significant alterations or less than 50% new All costs have been normalised to a common UK average price levelbuild to existing buildings. The works are further categorised as light, using regional location factors published by BCIS to accord with the UKMean 100. Index taken at March 2020.medium and heavy refurbishment. See further definitions for theselevels on page 31.Further definitions of key terms and footnotes outlining how the data has been treated can be found on page 31.InflationAll costs have been updated to the latest Building Cost InformationService (BCIS) ALL-IN Tender Price Index (TPI) of 1st Quarter 2020 of336. Index taken from April 2020 data forecasts. This adjusts costs forinflation. VAT is excluded throughout.EBDOGPage 16 of 33May 2021
National School Delivery Cost Benchmarking Primary, Secondary & SEN SchoolsPart ThreeSecondary SchoolsRobert Mays School, Hampshire County CouncilEBDOGPage 17 of 33May 2021
National School Delivery Cost Benchmarking Primary, Secondary & SEN SchoolsPart Three Secondary Schools OverviewProject CategoriesThe secondary school sample consists of 217 projects which are split into three schoolcategories as shown in the pie chart (right). This sample features projects from 2012 to2020 with a total combined capital value of 2.72 billion, comprising: 31 New Development projects (4 All Through schools) 182 Re-Build & Extension projects (8 All Through schools) 4 Refurbishment projects217secondary schoolsThe majority of the secondary school sample consists of Re-Build & Extensionprojects, demonstrating that Local Authorities are starting to expand existing school sitesto meet the considerable forecast demand for pupil places. The sample has seen a 27%increase in schemes since last year.The majority of schemes are procured via a framework arrangement, be that at anational, regional or local level. It has not been possible to draw sufficient trendsrelating to the cost benefits of the different procurement routes due to the significant variations in the framework arrangements.Over the next pages, further commentary is provided for each project category whichdetails cost variations and observations on drivers for costs between projects.A small sample of New Development and Refurbishment projectshas been obtained. It is not possible to draw any conclusions orprovide further commentary, but this information is given to showthe emergence of the sample.200,000secondary places provided 2.72 billioncapital value of secondary school sampleStarbank All Through School, Birmingham City CouncilEBDOGPage 18 of 33May 2021
National School Delivery Cost Benchmarking Primary, Secondary & SEN SchoolsPart Three Secondary Schools Annual Cost TrajectorySecondary school gross costs as a whole sample have decreased over thelast two years. This has been driven by the small data sets available withinthe study for New Development and Refurbishment Projects. This studyhas demonstrated a number of reasons for the fluctuations evidenced inthe cost trajectory over the last five years (Graph 6, right) which areoutlined below.Graph 6 Secondary School Average Gross Costs per m²New DevelopmentA small sample of New Development projects has been obtained. It is notpossible to draw any conclusions or provide further commentary, but thisinformation is given to show the emergence of the sample.Re-Build & ExtensionExtensions to existing school sites, new teaching blocks and re-builtschools on existing sites have seen a decrease in gross costs in 2018 witha rise in 2019. Costs have reduced from a high in 2012 by 2.4%. It shouldbe noted that the sample size for 2012 is small and therefore greater certainty can be placed in the 2013 - 2019 trajectory, which has seen a 7.7%increase in gross costs. This study has shown a number of factors influencing this trend: Smaller projects have continued to be procured over the last 12months, with the average project GIFA over this period being6,300m². This is considerably smaller than the 7,500m² averageGIFA seen prior to 2015, which reduces the cost benefitsexperienced by larger schemes.RefurbishmentA small sample of Refurbishment projects has been obtained. It is notpossible to draw any conclusions or provide further commentary.Figure 6 (right) displays the average costs per year alongside the numberof projects in each year. It should be noted that the secondary schoolsample for New Development and Refurbishment is small and thereforeaverage costs displayed are indicative only.EBDOGPage 19 of 33May 2021
National School Delivery Cost Benchmarking Primary, Secondary & SEN SchoolsPart Three Secondary Schools Re-Build & Extension SummaryRe-Build & Extension projects are formed from a combination of newblocks, extensions to existing schools and re-build projects on theexisting site. In most cases there are elements of demolition and someprojects include refurbishment work to existing buildings.Graph 8 Re-Build & Extension Gross & Nett Costs per m²In total, 182 Re-Build & Extension projects were submitted to the study, Graph 8(right) displays the gross and nett costs per m² for these projects. A detailed breakdown is sho
National School Delivery Cost Benchmarking Primary, Secondary & SEN Schools EBDOG Page 4 of 33 May 2021 This document publishes the results of a national cost benchmarking exercise undertaken by Hampshire County Council in partnership with East Riding of Yorkshire Council on new build, extended and refurbished primary, secondary and SEN .
