Transcription
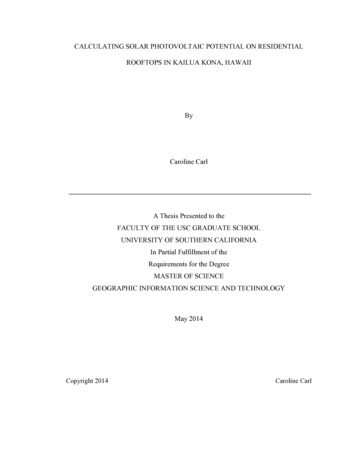
ACTA CLIMATOLOGICA ET CHOROLOGICAUniversitatis Szegediensis, Tomus 44-45, 2011, 83-92INTRODUCING A SCRIPT FOR CALCULATING THE SKY VIEW FACTORUSED FOR URBAN CLIMATE INVESTIGATIONSM HÄMMERLE1, T GÁL2, J UNGER2 and A MATZARAKIS11Meteorological Institute, Albert-Ludwigs-University of Freiburg, 79085 Freiburg, GermanyE-mail: martin.haemmerle@meteo.uni-freiburg.de2Department of Climatology and Landscape Ecology, University of Szeged, P.O.Box 653, 6701 Szeged, HungarySummary: The sky view factor (SVF) is a parameter widely used in several research fields, applied research andplanning. It is of crucial importance concerning the energy budget of a certain location. Many methods forcalculating the SVF have been developed. In the present study, a selection of methods and models is analyzed inorder to find out about possible improvements. Also, a new method using GIS software is introduced. In the city ofSzeged fisheye pictures were taken along transects and evaluated. For the images’ coordinates, SVF wascalculated by numerical models which use a 3D-building database as input. Also, a set of artificial fisheye pictureswas created and used for validating the applied methods. The calculations were performed with the modelsSkyHelios (Matuschek and Matzarakis 2010, Matzarakis and Matuschek 2010), SOLWEIG (Lindberg et al. 2008)and the ArcView SVF-Extension (Gál et al. 2009). The evaluation of the fisheye pictures was done according tothe manual Steyn-method (Steyn 1980), RayMan (Matzarakis et al. 2007 2010) and with BMSkyView (Rzepa andGromek 2006). Additionally, a new ArcView-script has been developed in order to enhance the only manualmethod (Steyn 1980). The comparison of the obtained results showed a systematic deviation of the SVF values.After including a cosine weighting factor in the differing models, all SVF values corresponded to each other.Key words: urban climate, SVF-calculation methods, comparison1. INTRODUCTIONThe sky view factor (SVF or ψs) is a dimensionless parameter with values betweenzero and one. It represents the fraction of visible sky on a hemisphere which lays centredover the analyzed location (Oke 1981).Different sky view factors mean different radiation budgets and accordinglydifferent energy budgets: On a point with a SVF of 1 (the complete sky is visible) underclear sky conditions neither reflected short-wave radiation, nor additional long-waveradiation is received. The radiation budget for an “ideal” site can thus be written as in Fig. 1(left side) and accordingly the energy budget corresponds to Fig. 1 (right side).In Fig. 1, Q* stands for the net radiation budget, S is the incoming short-waveradiation (direct solar and diffuse), S the outgoing short-wave radiation (reflection), L theincoming long-wave radiation (atmospheric downward-radiation), L the outgoing longwave radiation (emission of the surface); QG stands for the soil heat flux (energy stored involumes, e.g. soil, buildings), QH is the sensible heat flux (air temperature) and QE the latentheat flux (evaporated water).83
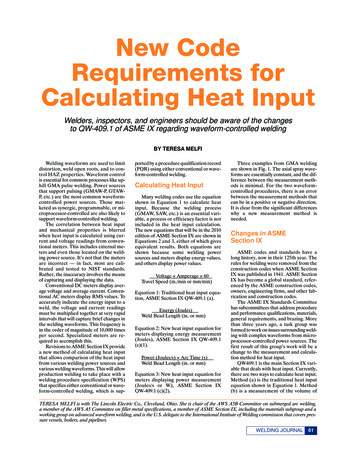
M Hämmerle et al.Fig. 1 Schematic summary of the fluxes involved in the radiation budget (left) and energy balance(right) of an “ideal” site (modified after Oke 1987)If, in contrast, the analyzed location is situated for example in a valley or streetcanyon (Fig. 2), the radiation budget and the energy budget are changed by reflections of short-wave radiation as shown Fig. 2a, a decrease in outgoing long-wave radiation as shown Fig. 2b, an increase in received long-wave radiation that is emitted by the surfaces whichobstruct the sky and consequently an altered soil heat flux.The sky view factor thus plays a crucial role e.g. in urban climatology (Oke 1987),forest climatology (Holmer et al. 2001), human biometeorology (VDI 1998, Matzarakis2001) etc. It is widely used as an importantparameter in modelling thermal phenomena,such as the urban heat island (Unger 2004).Further it can be and it is used in a variety ofnew fields, e.g. the modeling of ventilationpaths, research concerning renewable energysources (Richert 2010) or urban planning(Lin et al. 2010).Several numerical models forcalculating the sky view factor and severalmethods for evaluating the SVF have beendeveloped. The aim of this work is toFig. 2 The role of surface geometry in radiation compare and to validate some of theseexchange. Comparison of horizontal andmodels and methods (see section 3) in orderconvoluted surfaces. S short-wave radiation,to find out about possible differences in theL long-wave radiation.results and thus to offer a background for(modified after Oke 1987)improvements.2. STUDY AREAFor calculating the sky view factor with the different models and for validating thecalculations, a city on flat terrain would be most convenient. Where there is no noteworthyrelief, the computations can be done without including data about the topography and arethus less time-consuming and less prone to errors.As there was already a 3D-database and a collection of fisheye pictures available(Unger 2006, 2009, Gál et al. 2009), the city of Szeged in South-Hungary (Fig. 3) waschosen for this work.84
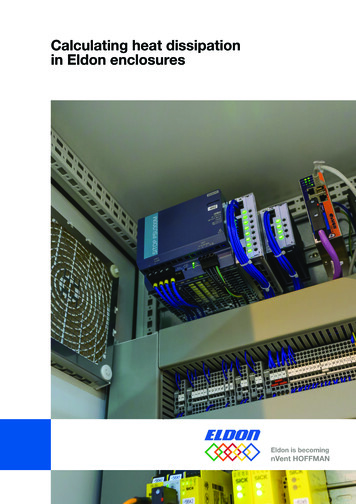
Introducing a script for calculating the sky view factor used for urban climate investigationsFig. 3 The location of Hungary in Europe (A), the location of Szeged in Hungary (B), the footprint ofSzeged and the locations of transects (C) and the surroundings of transect 3 (D)Fig. 4 Views of transect 3, from the west (right), from the east (left)It was intended to cover a variety of different building structures in order to find outhow the methods react. As a guideline, the local climate zones (LCZ) as introduced byStewart (2009) were used. In this paper, only transect 3 is presented (Fig. 3), since all of theimportant findings can be demonstrated here. The transect lies in the north-easternintersection of Horváth Mihály street and Deák Ferenc street and consists of the pictures nr.3023 to 3043 (Fig. 7). It was classified in the LCZ “compact midrise”. From the first85
M Hämmerle et al.observing points, some vegetation in its “leaf on” phase is viewable. The images were takenequidistantly every 0.5 meters.Fig. 3d shows the surroundings of transect 3 and is intended to be an overview and ahelp for interpreting and understanding the results. The typical building height in this areais around 15-20 m and the vegetation is represented by only a few trees (Fig. 4).3. METHODS3.1. Fisheye imagesThe fisheye images were taken with a Nikon Coolpix 4500 digital camera and a NikonFisheye Converter FC-E8 0.21x. The camera was mounted on a Gorillapod original tripod.For leveling the camera, aLenspen panamatic bubble level(Parkside Optical Inc.) was alsomounted on the tripod (Fig. 5).This configuration is quite convenient and practical, it can bemoved fast and easily and unevensurfaces like gutters are noobstacle for the measurements.A mask was created to cutthe fisheye pictures to 180 .Cutting the images was necessarybecause the FC-E8 lens have afield of view (FOV) of 189 (Grimmond et al. 2001).The positions of theFig. 5 Equipment for taking the fisheye picturesimages of transect 3 were marked with chalk on the street andthen were measured with a Sokkia SET310 theodolite. As reference points, edges of thesurrounding buildings were used. The building’s coordinates were already available fromthe 3D building database (Gál et al. 2009).3.2. SVF evaluation methods using fisheye photoes3.2.1. Manual method according to SteynThis is a very basic method of evaluating fisheye pictures. First, the fisheye pictureis printed with an overlain polar grid. In the print, the obstacles are then to be delineatedmanually. With the help of the polar grid the viewing angle of each annulus is to becounted. After the SVF is calculated for each annulus according to the formulas in Steyn(1980) the values are summed up for the total SVF.86
Introducing a script for calculating the sky view factor used for urban climate investigations3.2.2. “Edit free sky view factor”-tool of RayManThis RayMan-module (Matzarakis et al. 2007 2010) calculates the SVF afterobstacles are digitized in a fisheye picture or loaded directly into the module. Afterdigitizing, the SVF is calculated by counting the sky-pixels and relating them to the totalnumber of pixels in the image.3.2.3. BMSKyViewThis software (Rzepa and Gromek 2006, Gál et al. 2007) colours all pixels which areto a certain degree similar to the clicked pixel. A threshold has to be chosen that groups nottoo many and not too few pixels which are to be coloured. The sky pixels are to be chosen.Some pixels in buildings (e.g. sky-reflecting windows) have to be unmarked after theselection of all sky pixels. The marked pixels are used for the SVF-calculation which isbased on the Steyn-method.3.3. New approach: Steyn-method implemented in an ArcView scriptTo overcome the disadvantages of the manual Steyn-method (material used for theprints, low contrast, tedious and time consuming), an Avenue script was developed in orderto evaluate fisheye pictures more easily using GIS-software.The main difference to the manual Steyn-method is the shift from manual work todigitizing the fisheye images on the computer. For a convenient programming of theArcView Avenue script, not the obstructed areas are used for the calculation, but the area ofvisible sky, which is thus to be digitized.The method uses the same formula as the manual Steyn-method. It first creates atheme of n annular rings (n is user defined, the default is 36) and then calculates themaximum value of SVF for each annular ring (SVFmax i) withSVFmax i π π (i 0.5) π (i 0.5) sin cos 22n2n (1)where n is the count of annular rings, i the number of the actual ring and π the mathematicalconstant Pi.In the next step, the visible sky is digitized as a new theme. Via intersecting theannular rings with the digitized visible sky theme, αi (obstructed angle in ring i) iscalculated withαi Ttotal Tobsπ r22 π r12(2)where Ttotal is the total area of the annular ring, Tobs is the obstructed area in the same ring,r1 and r2 are the radii of the inner and outer limits of the ring, respectively.Each ring’s SVF is then calculated viaSVFi SVFmax i αi2π(3)87
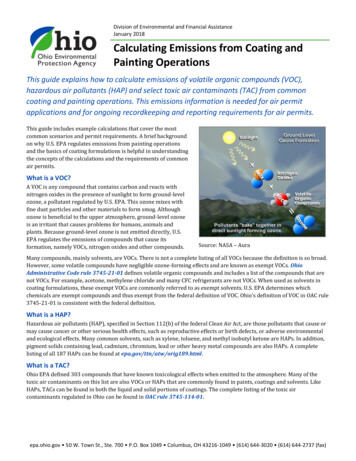
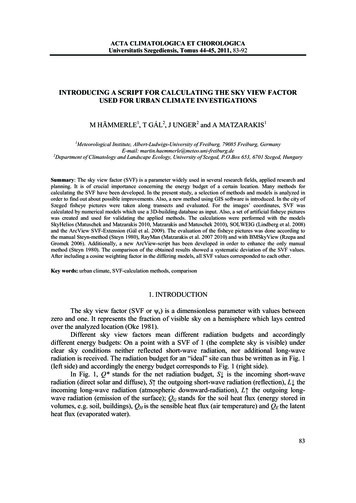
M Hämmerle et al.and finally, all SVFi are summarized, which results in the total SVF. After this calculationthe software writes the SVF value to the screen.Digitizing the sky is done fast and easily with the script because vegetation can bemore easily separated from rooftops on an actively light emitting screen. In addition,zooming in and out of the image is very helpful. The SVF-calculation for the digitizedimage is done with one click. This method is estimated the fastest for evaluating fisheyeimages.As the script is customized for the original pictures of FC-E8 lens with its FOV of189 , the use is restricted to a certain set of equipment. On the other hand, an extension tomeet other general conditions can easily be introduced in the source code of the Avenuescript.3.4. SVF compution methods using a 3D building database3.4.1. SkyHeliosThe calculations with SkyHelios (Matuschek and Matzarakis 2010, Matzarakis andMatuschek 2010) were done twice for each transect: First with a raster input file (resolution0.5x0.5 m), second with a vector input file, both extracted from the 3D building database.SkyHelios works in a similar way to RayMan: A virtual fisheye picture for eachobservation point is generated based on the 3D input. The image is evaluated following thesteps as done by RayMan.3.4.2. ArcView SVF-ExtensionThe extension (Unger 2009, Gál et al. 2009) uses a vector-based 3D building database as input. A point shapefile has been created using the coordinates of the pictures andthe SVF-calculation is done for each point in this file. The calculation method is based onOke’s SVF formula for a basin (Oke 1987). The software scans the horizon stepwise bydrawing a line and searching for intersections between this line and the buildings. A stepsize of 1 was chosen and the scanned distance was 200 meters which gives the best resultswith quite a low calculation time (Unger 2009). The detected obstacles’ height is read fromthe 3D database and the highest building that intersects the scan line is taken for thecalculation (Gál et al. 2009).3.4.3. SOLWEIGSOLWEIG (Lindberg et al. 2008) calculates the sky view factor on the basis of ashadow casting algorithm as introduced by Ratti and Richens (1999). Due to problems withthe software or the computing equipment, the resolution for all transects was 1x1 m.3.5. Method for validationIn addition to the evaluation of real fisheye photos and model runs, some “ideal”fisheye photos were generated. For this purpose, a set of 36 pictures with 36 circles eachwas created. The pictures simulate an “opening sky”: Each consecutive picture has onemore additional white ring. This set of pictures stands for a stepwise virtual opening of thesky and leads to a cumulative SVF-calculation from one single visible ring in the centre tofull visibility which means a SVF of 1 (Fig. 6).88
Introducing a script for calculating the sky view factor used for urban climate investigationsRing 1 visibleRings 1-18 visibleRings 1-36 visibleFig. 6 Cumulatively „visible” rings as input for validatingThe artificial sky rings were evaluated with the three methods RayMan (workflow asabove except digitizing the obstacles: the produced artificial fisheye picture was useddirectly), BMSkyView (workflow as above) and the manual Steyn-method (SVF wascalculated in a spread sheet).4. RESULTSFirst follows a description of the comparison results for transect 3. Then, the resultsof the evaluation based on the artificial images are shown and described.4.1. Results for the fisheye imagesA line chart was drawn for the transect (Fig. 7). As the points of the transect areequidistantly following a line, a continuous change in SVF can be assumed.Fig. 7 SVF-diagram for trans
In Fig. 1, Q* stands for the net radiation budget, S is the incoming short-wave radiation . an Avenue script was developed in order to evaluate fisheye pictures more easily using GIS-software. The main difference to the manual Steyn-method is the shift from manual work to digitizing the fisheye images on the computer. For a convenient programming of the ArcView Avenue script, not the .