Transcription
KEY RATIO ANALYSIS:CALCULATING AND INTERPRETING THE NUMBERSCORRECTLY!1
DAVID L. OSBURN, MBA, CCRADavid Osburn is the founder of Osburn & Associates, LLC that specializes in providing seminars, webinars, andkeynote speeches to bankers, CPAs, attorneys, and credit managers on topics such as Banking/Finance/Credit,Negotiation Skills, Marketing, and Management.David also functions as a Contract CFO and works with financial institutions, CPA firms, construction companies, andreal estate developers. He is also an adjunct faculty member of both an accredited MBA program and the accountingdepartment of a community college with over 30 years of teaching experience.David’s extensive professional background encompasses over 20 years as both a Business Trainer and Contract CFOand 16 years in banking (commercial lending) including the position of Vice President & Senior Banking Officer.David has an MBA in Finance/Marketing from Utah State University and a BS degree in Finance from Brigham YoungUniversity. He is also a graduate of the ABA National Commercial Lending School held at the University of Oklahoma.David also holds the professional designation of Certified Credit and Risk Analyst (CCRA) as granted by the NationalAssociation of Credit Management (NACM).Osburn & Associates, LLCA Business Training & Contract CFO FirmDavid L. Osburn, MBA, CCRAManaging Member7426 Alamo Summit DriveLas Vegas, Nevada 89129Direct:E-Mail:Web:(702) 655-1187dlosburn@cox.netdlosburn.com2
Key Ratio Analysis: Calculating and Interpreting the Numbers Correctly!Section 1Users of Key Ratio Analysis:Various individuals use financial statements including bankers, bonding companyunderwriters, commercial real estate lenders, equipment lessors, and CPAs. Forpurposes of this seminar, we will focus on the following:Creditor: Bank loan officers and bond rating analysts analyze ratios to ascertain acompany’s ability to pay its debts.Investor: Stock analysts assess the company’s efficiency, risk, and growthprospects through ratio analysis.Manager: Business owners and managers use ratios to analyze, control, andimprove their firm’s operations.Guarantor: Business owners are usually required to guarantee their variousbusiness obligations and use “related” ratio analysis to determine their personalposition.3
Key Ratio Analysis – What is it?Credit/Investment/Management Decisions Based on Financial Analysis:Creditors/investors/managers in particular can quickly assess a company’sfinancial condition by identifying and calculating key ratios that reveal acompany’s financial health. Obviously, numbers taken from the “four financialstatements” can make numerous calculations; however, some are not asimportant as others. In particular, financial professionals have found leadingindicators of a company’s operating performance in “five” vital business areas.The areas of emphasis are: Liquidity Activity Leverage Operating Performance Cash Flow4
Section 2Accounting PrinciplesAccounting Basics – Quick Review of the Four Financial Statements:Income StatementRevenue – Expenses Net Income (Net Loss)Statement of Retained EarningsBeginning Retained Earnings Net Income (-Net Loss) – Dividends EndingRetained EarningsBalance SheetAssets Liabilities Owner’s EquityStatement of Cash FlowsOperating, Investing & Financing Cash FlowsDirect versus Indirect Methods5
Section 3“Five Step” Financial Ratio AnalysisFinancial Ratio Calculations:Financial Ratio Analysis begins with identifying the five leading financialindicators of business:Liquidity, Activity, Leverage, Operating Performance, and Cash flow.Following are the formulas used to calculate key financial ratios:6
A. Liquidity RatiosDefinition:Working Capital Current Assets – Current LiabilitiesCurrent Ratio Current AssetsCurrent LiabilitiesQuick Ratio (Acid Test) Current Assets-Inventory/ Current LiabilitiesAdjustments: Prepaid Expenses, “Due From Officers, Shareholders & Employees”7
Creditor:To the creditor, liquidity is important as all loans are ultimately repaid by cash.Investor:To the investor, liquidity is important but too much liquidity may not be themost effective use of the company’s assets, i.e. maintain the majority of thecash in the company’s “non-liquid” assets in order to promote companygrowth.Manager:To the business owner/manager, liquidity is most important when it comes topayroll! If you cannot meet payroll, the firm is “history”.Guarantor:To the guarantor (usually business owner), liquidity means backing up theirbusiness obligations and creating “life style.” These are often in direct conflictwith each other.8
SNIDER CORPORATION:Balance Sheet201620172018EAssetsCash Short-term investments9,000 7,282 14,00048,60020,00071,632Accounts ,287,3601,716,480 1,124,000 1,946,802 2,680,112Gross fixed assets491,0001,202,9501,220,000Less: Accumulated depreciation146,200263,160383,160Total current assetsNet fixed assetsTotal assets 344,800 939,790 836,840 1,468,800 2,886,592 3,516,952201620172018E Liabilities and EquityAccounts payable145,600324,000359,800Notes 380,000481,600 1,328,960 1,039,800Long-term debt323,4321,000,000500,000Common stock460,000460,0001,680,936Retained earnings203,76897,632296,216557,632 1,977,152 2,886,592 3,516,952Total current liabilitiesTotal equityTotal liabilities and equity 663,768 1,468,800 Note: "E" indicates estimated. The 2018 data are forecasts.9
Income Statement2016Sales Cost of goods soldOther expensesDepreciationTotal operating costsEBIT 5,834,400 612,96018,900116,960120,0003,222,900 5,816,960 6,532,960 209,100 17,440 502,64062,500 Taxes (40%)Net income3,432,0002018E Interest ExpenseEBT2017146,600176,000 58,640 87,960(158,560)80,000 (63,424) (95,136)422,640169,056 253,584Industry Comparisons2017CurrentQuickInventory turnoverDays sales outstandingFixed assets turnoverTotal assets turnoverDebt ratioTIEEBITDA coverageProfit marginIndustry Average2.7X1.0X6.1X32 Days7.0X2.5X2.0X6.2X2.0X3.6XNote: "E" indicates estimated. The 2018 data are forecasts.10
Tasks:1) Calculate Snider Corporation’s working capital, current ratio, and quick (acidtest) ratio.Comment on the company’s liquidity position.2) Snider Corporation is owned by one principal (Jim “Saw tooth” Snider) withpersonal liquidity consisting of the following: 25,000 Cash15,000 Mutual funds75,000 Individual unlisted stock90,000 IRAs 205,000Comment on Mr. Snider’s personal liquidity.Note: The principal’s personal liquidity becomes a major strength of theprincipal’s guarantee (tertiary source of repayment).11
B. Activity (Turn Factors)Definition:Account Receivable Turnover(A/R / Sales X Days in Period)Accounts Payable Turnover(A/P / COGS X Days in Period)Inventory Turnover(Inventory/COGS X Days in Period)Task: Calculate Snider Corporation’s A/R turnover, A/P turnover, and Inventoryturnover.Comment on the company’s Activity.12
Cash Conversion CycleDefinition:Cash Conversion Cycle Inventory conversion cycle A/R collection period– A/P deferral periodTask: Calculate the company’s cash conversion cycle.Comment on the company’s cash conversion cycle.Note: The firm’s goal should be to “shorten” its cash conversion cycle as much aspossible without hurting operations. This will increase the firm’s value, becausethe shorter the cash conversion cycle, the lower the required net operatingworking capital, and the higher the resulting free cash flow.The cash conversion cycle can be shortened by the following:1) Reducing the inventory conversion period by processing and selling goodsmore quickly,2) Reducing the receivables collection period by speeding up collections, and/or3) Lengthening the payables deferral period by slowing down the firm’s own13payments.
C. LeverageDefinition:Debt Ratio Debt/Net Worth (Equity)Adjustment: Subordinated DebtTask: Calculate the debt to worth ratio for Snider Corporation.Comment on the company’s leverage position.14
Creditor:To the creditor, leverage is important as this ratio highlights the reality ofthe “us versus them” mentality.Investor:To the investor, leverage is important because too little of it may prohibitthe firm from gaining certain “economies of scale” in the market place,thereby, limiting the firm’s ability to grow.Manager:To the business owner/manager, leverage is important in order to expandthe operation in a shorter “window” of time and meet the demands ofcompetition in the market place.Guarantor:To the guarantor (usually business owner), personal financial leverageshould be closely monitored in order to avoid excess.(Debt to Income Ratio): Total Monthly Debt PaymentsTotal Monthly Income15
D. Operating PerformanceDefinition:Common-Size Analysis Vertical - Income Statement (Percent of Sales)Net sales 5,000,000 (100%)COGS4,400,000 ( 88%)Gross Profit 600,000 ( 12%)G & A Expense350,000 ( 7%)Net Profit 250,000 ( 5%)Note:Common-size analysis vertical – Expresses comparison in percentage of theproportional expression of each item in a given period to a base figure selectedfrom the same period.Common-size analysis horizontal – Expresses comparison in percentage of theproportionate change over a period of time.16
Creditor:To the creditor, operating performance (the margins), is extremely important asthese calculations emphasize the company’s overall performance.Investor:To the investor, operating performance is usually measured by ROA and ROE.Manager:To the business owner/manager, the margins are an important measure of“daily” management of the firm’s operation.Guarantor:To the business owner (guarantor), strong/stable margins are important inorder to avoid excessive concern from various “stakeholders” as to why thecompany is operating at a level below “normal” (management’s ability toeffectively operate the business is questioned).17
Section 4E. Cash Flow Models - Traditional versus Cash Basis:Definition:Traditional Cash Flow AnalysisEBITDALess: Debt Ser. (P&I)MarginDCR 1,200M500M 700M2.4X(EBITDA Net Income/ Loss Interest Expense Taxes Depreciation Amortization)Note: Most commercial underwriters require a minimum DCR of 1.20X.18
EBITDA Debt Coverage:201620172018EINDEBITDALess: Debt Ser. (P&I)MarginDCR19
Personal Cash Flow (Business Owner/Guarantor)Salary Business Income Rental Income, etc. Total IncomeLess: Federal & State Taxes 500M150MCash Flow AvailableFor Debt Service 350MLess: Debt Service (P&I) 200MMargin 150MDCR1.75XNote: Most commercial underwriters want to see a minimum guarantorDCR of 1.00X to 1.40X.20
Global Cash FlowBusiness Cash Flow Personal Cash Flow (BusinessOwner/Guarantor)Business Cash Flow:EBITDALess: Debt Ser (P&I)Margin 1,200M500M 700MPersonal Cash Flow:Cash Flow AvailableFor Debt Service 350MLess: Debt Service (P&I)Margin200M 150MCombined Margin 850MCombined DCR2.21X21
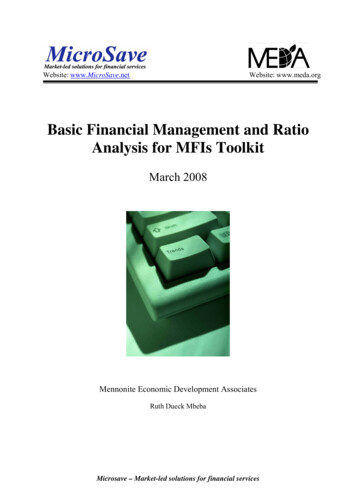
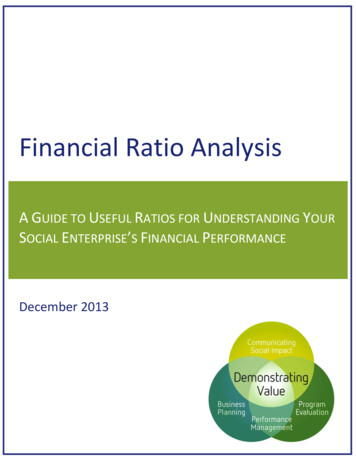
Section 4A. Other Issues in Key Ratio Analysis1. Industry Comparisons (RMA, S&P, D&B, Local Trade Group)2. Spreading a Financial Statement (See below)3. Z-Score (Bankruptcy Predictor) (See below)4. Sustainable Growth Model (See below)22
23
24
25
26
27
28
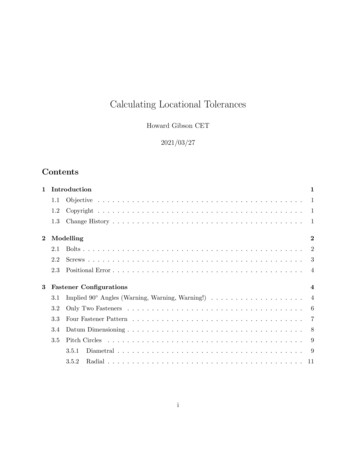
How to Calculate a Z-ScoreHow do you know when a company is at risk of corporate collapse? To detect any signs of looming bankruptcy, investorscalculate and analyze all kinds of financial ratios: working capital, profitability, debt levels and liquidity. The trouble is, eachratio is unique and tells a different story about a firm's financial health. At times they can even appear to contradict each other.Having to rely on a bunch of individual ratios, the investor may find it confusing and difficult to know when a stock is going tothe wall. (For background reading, check out An Overview Of Corporate Bankruptcy.)In a bid to resolve this conundrum, NYU Professor Edward Altman introduced the Z-score formula in the late 1960s. Ratherthan search for a single best ratio, Altman built a model that distills five key performance ratios into a single score. As it turnsout, the Z-score gives investors a pretty good snapshot of corporate financial health. Here we look at how to calculate the Zscore and how investors can use it to help make buy and sell decisions.The Z-score FormulaHere is the formula (for manufacturing firms), which is built out of the five weighted financial ratios:Z-Score 1.2A 1.4B 3.3C 0.6D 1.0EWhere:A Working Capital/Total AssetsB Retained Earnings/Total AssetsC Earnings Before Interest & Tax/Total AssetsD Market Value of Equity/Total LiabilitiesE Sales/Total AssetsStrictly speaking, the lower the score, the higher the odds are that a company is headed for bankruptcy. A Z-score of lowerthan 1.8, in particular, indicates that the company is heading for bankruptcy. Companies with scores above 3 are unlikely toenter bankruptcy. Scores in between 1.8 and 3 lie in a gray area.Read more: 4/021104.asp#ixzz2MKBSaEfu29
30
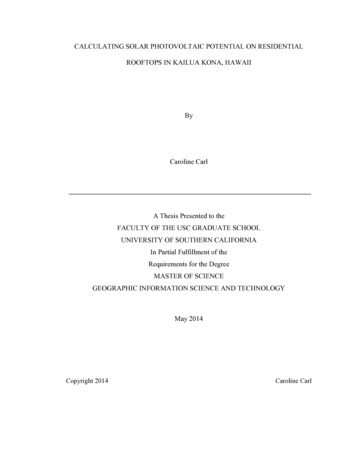
Sustainable Growth Rates (SGR) (from a financial perspective)The sustainable growth rate according to Robert C. Higgins is the maximum growth rate a companycan achieve consistent with the firm’s established financial policy. Basically, it is calculated as:SGR (pm*(1-d)*(1 L)) / (T-(pm*(1-d)*(1 L)))pm is the existing and target profit margind is the target dividend payout ratioL is the target total debt to equity ratioT is the ratio of total assets to salesIn order to grow faster, the company would have to invest more equity capital, increase its financialleverage or increase the target profit margin.The sustainable growth rate model assumes several simplifications such as depreciation is sufficient tomaintain the value of existing assets, the profit margin remains stable (also for new businesses), theproportion of assets and sales remains stable (also for new businesses) and the company maintainsits current capital structure and dividend payout policy.The sustainable growth rate model has implications for valuation models, as for instance the Gordonmodel and other discounted cash flow models require a growth estimate that can be sustained formany years. The sustainable growth rate can be a check if business plans are reasonable.31
Sustainable Growth /11107.3962.95(10.57)(36.71)32
Section 4B. Final Thoughts:1. In today’s economy:a. Cash is not kingb. Credit is not kingc. Cash flow is king!2. Figures lie and liars figure3. Negotiating with other financial professionals using the ratios4. Be a decision maker!33
real estate developers. He is also an adjunct faculty member of both an accredited MBA program and the accounting department of a community college with over 30 years of teaching experience. David’s extensi