Transcription
Proceedings of the 48th National Conference on Fluid Mechanics and Fluid Power (FMFP)December 27-29, 2021, BITS Pilani, Pilani Campus, RJ, India.FMFP2021–XX–YYYA Comparison study of Drag correlations for a Dispersed Multiphase flow in a Fluidized bedSiva Karthikeya M1, Ashley Melvin2 , Divyesh Variya3, Janani Srree Murallidharan41Department of Aerospace Engineering, SASTRA Deemed University, Thanjavur-781039, India2FOSSEE, IIT Bombay, Mumbai-400076, India3Department of Mechanical Engineering, IIT Bombay, Mumbai-400076, IndiaABSTRACT2. LITERATURE REVIEW AND OBJECTIVESystematic validation and uncertainty quantification of CFDmodels for Multiphase flows have been the fundamentalobjective of the small-scale challenge put forth by NETL in2013 [1]. As a part of this challenge, the experimental dataobtained by measuring the pressure drop and the particlevelocities at various locations of a rectangular bed were madeavailable to the research community for validation purposes. Alow frequency (1 Hz) and a high frequency (1kHz) pressuretransducers are used to extract the pressure drop data. Parallelly,High-speed Particle Image Velocimetry is used to obtain theparticle velocity at the desired locations [2]. Present researchinvolves validating the CFD results obtained for three dragcorrelations against the experimental data to quantify theuncertainties of each drag closure. Considering the interfacialmomentum transfer phenomena between the phases in aMultiphase flow simulation is essential in obtaining accurateresults. Neglecting this can lead to an introduction of relativeerrors as large as 30% into the normally obtained results [3].Hence, it is important to investigate the factors that contributeto the momentum transfer between phases in a MultiphaseFlow. A detailed formulation of these factors is provided inEnwald et al. (1996) [4]. In the case of a solid-fluid dispersedflow, the generalized drag force term in the Reynolds averagedmomentum equation predominantly contributes to theinterfacial momentum transfer, unlike separated flows; wherefactors like interfacial pressure difference and combinedinterfacial shear plays a major role. Thus, evaluating the dragcorrelations available in the literature to model the Fluidizedbed phenomenon has been a crucial aspect of the presentresearch. Although multiple pieces of literature discussedvarious drag closures that can be implemented in OpenFOAM,studies [4] and [5] provided a comprehensive overview of thephysics behind each drag closure and its operating phasefraction ranges. Considering the possibility of a drasticvariation in phase fraction values at the interface of both thephases, the drag closures were chosen such that their operatingranges can accommodate both low and high-phase fractionregimes. The original Syamlal O’Brien drag closure inOpenFOAM was tuned based on the value of minimumfluidization velocity obtained from the experiment [1]. Thisstep ensures that the computationally modeled drag forceaccurately mimics the experimental drag force. Similarly, thevalue of the Specularity coefficient, which is indicative of thewall roughness, is adapted from Lungu et al. (2016) [6] for aThe present study compares different drag models like SyamlalO’Brien, Gidaspow Ergun WenYu (GEW), and GidaspowSchiller Naumann (GSN) in the modeling of fluidized-bed.With the help of the open-source CFD software OpenFOAM,time-averaged particle velocity components were calculated atfive lateral locations of the fluidized bed. Later these valueswere used for validation against experimental data generated bythe National Energy Technology Laboratory (NETL). Particlesbelonging to Geldart group D are considered as the particulatephase in this study, which is fluidized by gas at ambientconditions. The Eulerian-Eulerian approach is adopted for thepresent 2D computational study with closures from the KineticTheory of Granular Flow (KTGF). The study identified theSyamlal O’Brien drag closure to be reliable in modeling theinterfacial momentum transfer phenomenon between thephases. Thus, it accurately predicted the particle velocitydistribution at different lateral locations of the fluidized bed. Itwas also observed that the accuracy of the predictions made byGidaspow Ergun WenYu (GEW) drag closure reducedsignificantly as the gas velocity increases at the domain inlet.Keywords: OpenFOAM, CFD, Fluidized bed, Multiphase1. INTRODUCTIONResearch on sustainable technologies has burgeoned in the21st century to tackle environmental degradation occurring atevery stage of any industrial process. Fluidized bed technologyis one such potential deployment into the category ofsustainable technologies, widely used in the pharmaceutical,petroleum, chemical, and many other industries and has been ata focal point of research.With the primary function of making a solid-fluid mixturebehave as a fluid, this technology has the potential to reduce theharmful gas emissions from industries without compromisingon the efficiency of results like combustion, catalytic cracking,and other chemical processes. For further advancement andproliferation of this technology, research into Computationalmodels that are capable of predicting the flow structure insidethe Fluidized Bed accurately is of key interest. This studyanalyses the reliability of various drag correlations in modelingthe interfacial momentum transfer between the existing phasesin a Fluidized bed phenomenon.1
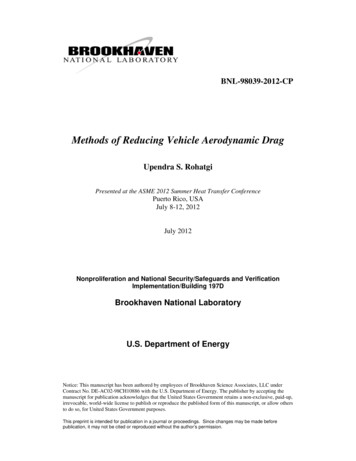
superficial gas velocity of 3.28 m/s. Eulerian – Eulerianapproach is chosen for this study due to its relativecomputational inexpensiveness when compared to otherapproaches. The fluidized bed being a dispersed system, multifluid modeling is used where both phases are treated asinterpenetrating continua.Table 1: Parameters used in this study3. MATERIALS AND METHODSThe geometry, dimensions, and boundaries of the 2D fluidizedbed used for this study are shown in fig. 1. The geometric dataused from [1], fig. 1 shows the parts of a Fluidized bed. Thelateral locations, where the particle velocities measured forcomparison with the experimental data produced by theNational Energy Technology Laboratory (NETL) is alsoshown. Crucial parameters considered in the study, like thesuperficial gas velocity at the inlet, the initial phase fraction ofthe dispersed phase (particles) is mentioned in table 1. An initialphase fraction of 0.58 means that 58% of the static bed isoccupied with the dispersed phase (particles) and the remaining42% with the continuous phase (liquid). An entire domain isdiscretized into 2806 quadrilateral elements. ThetwoPhaseEulerFoam solver from OpenFOAM software is usedfor running the simulations.ParametersValueSuperficial Gas Velocities2.19 m/s & 3.28 m/sMinimum Fluidization Velocity1.03 m/sStatic Bed Height0.173 mInitial phase fraction (αi)0.58Gas density (ρg)1.204 kg/m3Particle diameter (dp)3256 μmParticle density (ρp)1131 kg/m3Specularity Coefficient (Φ)0.125 & 0.053.1 Governing EquationsMultiphase flows can be numerically modeled usingdifferent approaches such as:a)Direct Numerical Simulation (DNS)b) Eulerian – Langrangian approachc)Eulerian – Eulerian approach is further classified based onthe phase morphology into separated and dispersed systems [1].For a dispersed system like the fluidized bed, multi-fluidmodeling is used; where both phases are considered asinteracting and interpenetrating continua, therefore, share thesame continuity and momentum equations for each phaseindividually as shown in Eqs. (1), (2), and (4). For the solidphase, the Kinetic Theory of Granular Flow (KTGF) [7] wasadopted for closure which considers the conservation of SolidFluctuation Energy. KTFG approach is an extension to theclassical kinetic theory of gases to dense granular flows, wherethe fluctuation energy is described using the granulartemperature (𝜃).Rectangular FBL 0.076 mD 0.23 mH 1.22 mThree important assumptions made in this study forsimplification are:y0.0762 mxDistributorEulerian – Eulerian approachi.Both solid and liquid phases are isothermal.ii.There is no interphase mass transfer between bothphases.iii.Solid particles are of pure spherical configuration witha mean diameter and density. Conservation of Mass (k f for fluid phase, s for solidphase)Inlet Gas flow (𝛼𝑘 𝜌𝑘 ) (𝛼 𝜌 𝒖 ) 0 𝑡 𝑥 𝑘 𝑘 𝑘 Figure 1: Schematic diagram of the set-up withdimensions [1]2Conservation of Momentum (fluid phase)(1)
fraction regimes. Because, the probability of a cell in a domain,especially at the interface, to overshoot the maximum phasefraction of the domain can never be neglected and must be takeninto account. Also, the correlations adopted must be applicablefor a multi-particle system to consider the effect of otherparticle’s presence. Upon considering such fundamentalfactors, three drag correlations were chosen to model the twophase flow inside a fluidized bed. (𝛼 𝜌 𝒖 ) (𝛼𝑓 𝜌𝑓 𝒖𝑓 𝒖𝑓 ) 𝑡 𝑓 𝑓 𝑓 𝛼𝑓 𝝉𝑓 𝛼𝑓 𝜌𝑓 𝒈 𝛼𝑓 𝑝 𝑭𝑑𝑓 𝑭𝑣𝑚 𝑭𝑙𝑓(2)𝑭𝑑𝑓 , 𝑭𝑙𝑓 , 𝑭𝑣𝑚 is the drag force, lift force, and virtual massforce respectively in Eqs. (2) and (4). Since drag forcecontributes predominantly to the momentum exchange betweenthe fluid and particulate phases, it is given more importance inthis study. 𝝉𝑓 2𝑇 𝜇𝑓 [ 𝒖𝑓 ( 𝒖𝑓 ) ] 𝜇𝑓 ( 𝒖𝑓 )𝑰3a)It is a combination of the Ergun drag correlation applicablefor dense systems and the Wen Yu correlation that can model adilute flow where viscous forces are dominant, accurately.This correlation uses the Ergun equation, Eq. (7), for 𝛼𝑝 0.2 and the Wen–Yu equation, Eq. (8) for 𝛼𝑝 0.2, where K isdefined as the drag function for each correlation. Drag force inthe Ergun correlation is calculated based on pressure drop perunit length, Eq. (9), unlike the Wen Yu correlation thatconsiders the drag coefficient on a single particle, Eq. (10).(3)The stress tensor of the liquid phase from Eq. (2) is expandedin Eq. (3) where 𝜇𝑓 is the combined turbulent and laminarviscosity for the fluid phase. Further, k ε turbulence model isused in the study for the fluid phase. Gidaspow Ergun WenYu:𝐾 150Conservation of Momentum (solid phase)3 2.65𝐶 𝛼 (1 𝛼𝑝 )𝜌𝑔 𝑈𝑟 (1 𝛼𝑝 )4𝑑𝑝 𝐷𝑠 𝑝𝐾 (𝛼 𝜌 𝒖 ) (𝛼𝑠 𝜌𝑠 𝒖𝑠 𝒖𝑠 ) 𝑡 𝑠 𝑠 𝑠 (4) 𝛼𝑠 𝑝 𝑝𝑠 𝝉𝑠 𝛼𝑠 𝜌𝑠 𝐠 𝑭𝑑𝑓 𝐹𝑣𝑚 𝐹𝑙𝑓 (6)(7)𝜇𝑔 𝑈𝑟𝛼𝑝2𝜌𝑔 𝑈𝑟2𝛼𝑝Δ𝑝 150 1.753𝐿𝑑𝑝 𝑔 (1 𝛼 )𝑑𝑝 𝑔 (1 𝛼 )3𝑝𝑝(8)240.687 ),(1Re 1000𝐶𝐷𝑠 { Re 0.15Re0.44,Re 1000(9)The solid phase stress tensor is expressed in terms of bulk solidviscosity 𝜉𝑠 , and shear solid viscosity 𝜇𝑠 in Eq. (5) 𝜇𝑔𝛼𝑝2𝜌𝑔 𝑈𝑟𝛼𝑝2 1.75𝑑𝑝 (1 𝛼 )2𝑑𝑝 (1 𝛼 )2𝑝𝑝Conservation of Solid Fluctuation Energyb) Gidaspow Schiller Naumann:3 [ (𝛼 𝜌 𝜃) (𝛼𝑠 𝜌𝑠 𝜃)𝒖𝑠 ] 2 𝑡 𝑠 𝑠This drag correlation is capable of calculating the drag in amulti-particle system, unlike the Schiller-Naumann correlation.Which is restricted to a single particle system only. The dragfunction for this correlation is defined in Eq. (11). SchillerNaumann drag coefficient, Eq. (10), is used by replacing the Rewith (1 𝛼𝑝 )Re, as shown in Eq. (12) below.( 𝑝𝑠 𝑰 𝝉𝑠 ) : 𝒖𝑠(5) (𝑘𝑠 𝜃) 𝛾𝑠 3𝛽𝜃 𝐷𝑙𝑠𝐾 Energy of fluctuating velocity of particle is measured usingGranular temperature (𝜃)3 2.65𝐶 𝛼 (1 𝛼𝑝 )𝜌𝑙 𝑈𝑟 (1 𝛼𝑝 )4𝑑𝑝 𝐷𝑠 𝑝(10)𝐶𝐷𝑠 3.2 Drag Correlations24{(1 𝛼𝑝)ReNumerous drag correlations are available [1] that can modelthe mechanism of interfacial momentum transfer majorlycaused due to drag force between the phases. A thoroughliterature study was performed to identify such dragcorrelations that could model the flow for all phase fractionregimes, individually or as a combination of two. It is necessaryfor a drag correlation to accurately predict the flow at all phase(1 0.15 ((1 𝛼𝑝 )Re)0.687 ), Re 10000.44,c)(11)Re 1000Syamlal O’BrienThis drag correlation is based on the primary assumptionthat the Archimedes number remains the same for terminal3
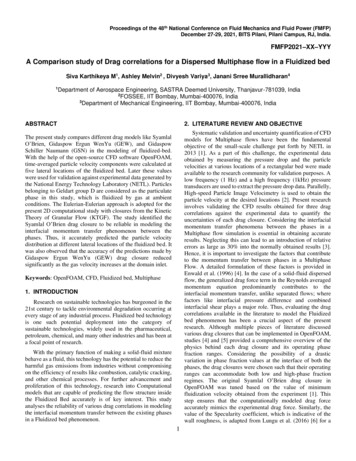
(𝜙𝑠 ) 0 Free slip along the wall, minimum hindrancesettling velocity for both single and multi-particle systems [7].It uses the expression, Eq. (13), to relate the settling velocityand the void fraction, where Re𝑠 is the Reynolds number for asingle particle and 𝑉𝑟 , the ratio of terminal settling velocity in amulti-particle system to that of a single particle system.𝑉𝑟 𝐴 0.06Re𝑠𝐵 𝑉𝑟In this study, the specularity coefficient was considered as0.05 for 3.28 m/s gas velocity [5] and 0.125 for 2.19 m/s gasvelocity which yielded more accurate results.(12)Table 2: Velocity boundary conditions considered inthis study𝑉𝑟 0.5(𝐴 0.06Re (0.06Re)2 0.12Re (2𝐵 𝐴) 𝐴2 )(13)4.14𝐴 (1 𝛼𝑝 )1.28𝐵 {𝐂1 (1 𝛼𝑝 )(14), 𝛼𝑝 0.15(1 𝛼𝑝 ) , 𝛼𝑝 0.15uf (m/s)us (m/s)Inlet2.19 and 3.28Fixed ValueOutletPressure Inlet OutletFixed ValueWallsnoSlipJohnsonJacksonParticleSlipTable 3: Pressure boundary conditions considered inthis study(15)𝐂2BoundaryEq. (14), (15), and (16) are obtained by solving Eq. (13)after replacing Re𝑠 with Re/𝑉𝑟 . Drag coefficient proposed byDallavalle, Eq. (17), is used here to obtain the final dragfunction in Eq. (18), where 𝐔𝑟 is the relative interstitialvelocity, 𝐔𝑔 𝐔𝑝 .Boundaryp xedFluxPressure4. RESULTS AND DISCUSSION𝐶𝐷𝑠 (0.63 4.8 Re𝑠Post-processing of the results was carried out in ParaView,open-source visualization software, and MS Excel. Particlevelocity at different lateral locations was obtained by plottingthe entire transient simulation over time for each lateral locationto extract the velocity data at every time step for an overall timeinterval of 50 seconds. The extracted data was time-averaged inthe time interval after a bubbling fluidization flow regime isestablished which is sustained till the end of the simulation. Theresults are then validated against the experimental datagenerated by National Energy Technology (NETL).2)(16)23𝛼𝑝 (1 𝛼𝑝 )𝜌𝑔𝑉𝑟𝐾 (0.63 4.8 ( )) 𝐔𝑟 24𝑉𝑟 𝑑𝑝𝑅e(17)The coefficients 𝐂1 and 𝐂2 in Eq. (16) are unique to aproblem statement and depend on the parameters likeArchimedes number, minimum fluidization velocity, and otherphysics properties of the individual phases. In our case, 𝐂1 0.88 and 𝐂2 2.04. Existing Syamlal O’Brien drag closurewas tuned with the new coefficients by creating a new dragmodel with the name newSyamlalObrien.3.3 Boundary ConditionsIn a granular flow case, the particles neither stick to the wallnor slip freely on it. Thus, a wall boundary condition introducedby Johnson and Jackson [8] is implemented to the fieldvariables of particles in the simulation. The boundaryconditions are summarized in table 2 and 3.Specularity coefficient (𝜙𝑠 ) is defined as the fraction ofparticle tangential momentum transferred to the wall throughcollisions. It is an indication of the wall roughness. This isaffected by the superficial gas velocity and the particle size.Figure 2: Contours of particle phase fraction (𝜶𝒑 ) atfive different timestamps(𝜙𝑠 ) 1 Zero tangential velocity, maximum hindrance4
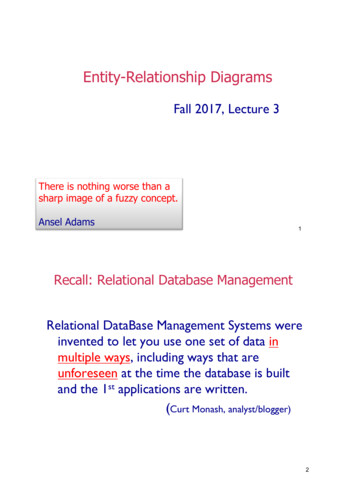
happens to be the same as that of experimental observations whichis not the case with GSN. Though GEW closure has managed tosuccessfully follow the trend of experimental results, it overpredictsthe axial velocity at the center of the bed. The deviations observedin GSN closure have significantly increased from case 1 to case 2.4.1 Case 1: Superficial Gas Velocity of 2.19 m/sThe time-averaged axial velocity data of the particles atdifferent lateral locations of the fluidized bed is plotted in fig. 3for various drag correlations. Experimental data generated byNETL for the same is included for comparison with the CFDresults. Syamlal O’Brien drag closure is more accurate inpredicting the axial particle velocity at all the lateral locations,followed by GEW. The trend of experimental results isfollowed by both Syamlal O’Brien and GEW but not GSN. Thetime-averaged axial velocity is the highest at the centrallocation for all correlations except GSN.Figure 5: Axial velocity vs Lateral position plot forvarious drag correlations (𝐔𝒈 3.28 m/s).Figure 3: Axial velocity vs Lateral position plot forvarious drag correlations (𝐔𝒈 2.19 m/s).Figure 6: Horizontal velocity vs Lateral position plotfor various drag correlations (𝐔𝒈 3.28 m/s).The drag closures predict an opposite horizontal velocity trendfrom the experimental observations for case 2 as depicted in fig.6. The experimentally obtained velocity profile also seems toreverse from that of case 1 due to the downward shift of thecenter of counter-rotating circulation cells [6].Figure 4: Horizontal velocity vs Lateral position plot forvarious drag correlations (𝐔𝒈 2.19 m/s).The first significant inference to be drawn from the resultsis about the GSN closure that predicted the particle velocitydistributions poorly for both the cases of gas velocity. Despitebeing developed to account for the particle-particle interactionsby including the voidage function [4], it was the least accuratefor both the velocity cases. It can be attributed to the fact that itwas primarily developed for packed bed applications where thegas velocity is relatively low, restricting the flow regime to afixed bed. The increase in relative error as the gas velocity israised from 2.19 m/s to 3.28 m/s for the GSN closure reinforcesour inference about the better performance of the model at lowfluid velocities and dilute particle concentrations.The results obtained for horizontal velocity distribution, fig. 4,further, strengthen our inference made from the axial velocityresults about the accuracy of the Syamlal O’Brien correlationbecause of its overlapping with the experimental results. However,the GEW closure is nearly as accurate as the Syamlal O’Brienclosure for the first case. Similar to the axial velocity distribution,the GSN correlation fails to follow the trend of the experimentalplot and overpredicts at most of the lateral positions.4.2 Case 2: Superficial Gas Velocity of 3.28 m/sInteresting behavior was observed in the axial velocity distributionwhen the superficial gas velocity was increased from 2.19 m/s to3.28 m/s as shown in fig. 5. Syamlal O’Brien’s closure again provedto be accurate among others. The direction of velocity at the fivelateral locations for both GEW and Syamlal O’Brien closureAt first, a noble deviation was observed in the axial velocityplots at the central location for different drag closures whencompared with the experimental counterpart. Changing the5
specularity coefficient from 0.5 to 0.125 for cases 1 and 0.5 to0.05 for case 2 provided the required bump in the axial velocityat the central location was observed for both GEW and SyamlalO’Brien drag correlations. Low values of specularitycoefficient produce high particle velocities in the bed due to lessloss of tangential momentum to the walls [5].REFERENCESFinally, Syamlal O’Brien’s drag correlation was mostaccurate in replicating the experimental results for both cases.The reason for this realistic behavior could be because of theconsideration of the clustering effect [9] of particles in themodel, unlike other correlations. GEW drag correlationperformed on par with the Syamlal O’Brien model at lower gasvelocity. As the gas velocity increases to 3.28 m/s, the trend inthe horizontal and axial velocities was replicated exactly, ahigher relative error than that of the Syamlal model makes itunsuitable at higher velocities.[2] Balaji Gopalan, Mehrdad Shahnam, Rupen Panday,Jonathan Tucker, Frank Shaffer, Lawrence Shadle, JosephMei, William Rogers, Chris Guenther, Madhava Syamlal,Measurements of pressure drop and particle velocity in apseudo-2D rectangular bed with Geldart Group D tec.2015.12.040[1] National Energy Technology Laboratory (NETL). (2013,May 30). Small Scale Challenge Problem I 013/[3] Bentsen, R. G. (1998). Effect of momentum transferbetween fluid phases on effective mobility. Journal ofPetroleum Science and Engineering, 21(1-2), 27–42. doi:10.1016/s0920-4105(98)00035-75. CONCLUSIONSThis study was performed to identify the most reliable dragcorrelation for computational modeling of dispersed multiphaseflows in a fluidized bed. The CFD results of particle velocityprofiles obtained for different drag correlations were comparedagainst the experimental data generated by NETL. SyamlalO’Brien drag correlation outperformed others for both the casesof superficial gas velocity, 2.19 m/s and 3.28 m/s, by accuratelypredicting the mean eulerian particle velocity distributions atvarious lateral locations of the fluidized bed. The GidaspowErgun WenYu correlation’s predictions were on par with theformer for the lower gas velocity of 2.19 m/s but are onlysatisfactory for the 3.28 m/s gas velocity case. The GidaspowSchiller Naumann correlation was least accurate among thethree in predicting the velocity profile but has given valuableinsights about the model and its operating range.[4] H, Enwald, E. Peirano, A-E Almstedt 'Eulerian Two-PhaseFlow Theory Applied to Fluidization' Int. J. MultiphaseFlow, Vol. 22, Suppl, pp. 21-66, 1996ACKNOWLEDGEMENTS[7] Ding, J. and Gidaspow, D. A bubbling fluidization modelusing kinetic theory of granular flow. AIChE Journal 36,523-538, 1990[5] Upadhyay, M., Kim, A., Kim, H., Lim, D., & Lim, H.(2020). An Assessment of Drag Models in Eulerian–Eulerian CFD Simulation of Gas–Solid FlowHydrodynamics in Circulating Fluidized Bed Riser.ChemEngineering,4(2),37. doi:10.3390/chemengineering402003[6] Lungu, M., Wang, H., Wang, J., Yang, Y., & Chen, F.Two-Fluid Model Simulations of the National EnergyTechnology Laboratory Bubbling Fluidized Bed ChallengeProblem. Industrial & Engineering Chemistry Research,55(17), 5063–5077, 2016The authors would like to thank the FOSSEE project, IITBombay for its financial support of this research. The authorsalso thank other members of our team, Mr. Ashley Melvin, andMs. Swetha for their valuable inputs during discussions.NOMENCLATUREuVelocityFdfDrag ForceFlfLift ForceFvmVirtual Mass ForceαPhase fractionρDensityCDDrag coefficientμDynamic ViscosityGranular Temperature𝜃Drag FunctionKSpecularity CoefficientΦReynolds NumberReTerminal Settling Velocity ratioVr[8] Johnson, P. C., & Jackson, R. Frictional–collisionalconstitutive relations for granular materials, withapplication to plane shearing. Journal of Fluid Mechanics,176(-1), 67, g/m-s][kg/m-s2]-----[9] O'Brien, T. J. and Syamlal, M. Particle cluster effects in thenumerical simulation of a circulating fluidized bed. 4th Int.Conf. on CFB, Somerset, USA, Preprint Volume, pp.430—435, 1996
A Comparison study of Drag correlations for a Dispersed Multiphase flow in a Fluidized bed Siva Karthikeya M1, Ashley Melvin2 , Divyesh Variya3, . With the help of the open-source CFD software OpenFOAM, time-averaged particle velocity components were calculated at five lateral locations of the fluidized bed. Later these values


![Unreal Engine 4 Tutorial Blueprint Tutorial [1] Basic .](/img/5/ue4-blueprints-tutorial-2018.jpg)