Transcription
BNL-98039-2012-CPMethods of Reducing Vehicle Aerodynamic DragUpendra S. RohatgiPresented at the ASME 2012 Summer Heat Transfer ConferencePuerto Rico, USAJuly 8-12, 2012July 2012Nonproliferation and National Security/Safeguards and VerificationImplementation/Building 197DBrookhaven National LaboratoryU.S. Department of EnergyNotice: This manuscript has been authored by employees of Brookhaven Science Associates, LLC underContract No. DE-AC02-98CH10886 with the U.S. Department of Energy. The publisher by accepting themanuscript for publication acknowledges that the United States Government retains a non-exclusive, paid-up,irrevocable, world-wide license to publish or reproduce the published form of this manuscript, or allow othersto do so, for United States Government purposes.This preprint is intended for publication in a journal or proceedings. Since changes may be made beforepublication, it may not be cited or reproduced without the author’s permission.
DISCLAIMERThis report was prepared as an account of work sponsored by an agency of theUnited States Government. Neither the United States Government nor anyagency thereof, nor any of their employees, nor any of their contractors,subcontractors, or their employees, makes any warranty, express or implied, orassumes any legal liability or responsibility for the accuracy, completeness, or anythird party’s use or the results of such use of any information, apparatus, product,or process disclosed, or represents that its use would not infringe privately ownedrights. Reference herein to any specific commercial product, process, or serviceby trade name, trademark, manufacturer, or otherwise, does not necessarilyconstitute or imply its endorsement, recommendation, or favoring by the UnitedStates Government or any agency thereof or its contractors or subcontractors.The views and opinions of authors expressed herein do not necessarily state orreflect those of the United States Government or any agency thereof.
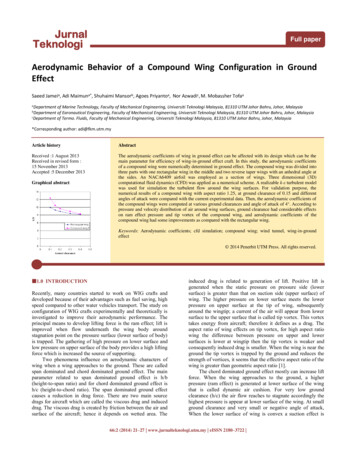
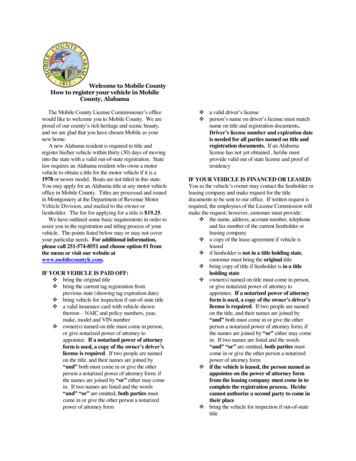
BNL-98040-2012-CPBNL-98039-2012-CPMethods of Reducing Vehicle Aerodynamic DragVolodymyr SirenkoYuzhnoye State Design Office, UkraineRoman Pavlovs'kyNational Aviation University, UkraineUpendra S. RohatgiBrookhaven National Laboratory, USAABSTRACTA small scale model (length 1710 mm) of General MotorSUV was built and tested in the wind tunnel for expectedwind conditions and road clearance. Two passive devices,rear screen which is plate behind the car and rear fairingwhere the end of the car is aerodynamically extended,were incorporated in the model and tested in the windtunnel for different wind conditions. The conclusion isthat rear screen could reduce drag up to 6.5% and rearfairing can reduce the drag by 26%. There wereadditional tests for front edging and rear vortexgenerators. The results for drag reduction were mixed. Itshould be noted that there are aesthetic and practicalconsiderations that may allow only partial implementationof these or any drag reduction options.will minimize drag for all conditions. Therefore, there is needto develop passive devices that will keep drag coefficient lowfor large range of conditions or active methods that candynamically change configuration to meet different speeds.INVESTIGATION METHODThere are various approaches of passive devices to reducedrag. These are, front screens; rear screens; structural elements that localize the area of flowdetachment (edging); vortex air flow generators; deflectors located over the rear part of vehicle’s roof; four-element rear fairing and its components; front fairing.INTRODUCTIONThe issue of reducing the vehicles power consumptionemerged nearly at the same time when vehicle itself wasinvented. In the beginning fueling stations were few and alow-consumption vehicle was needed to cover the longestpossible distance, between refueling. Since, the number ofcars has grown with the increase in fuel cost, it became againimportant to reduce the fuel consumption, both to save fuel butalso the environment.Vehicle power consumption reduction can be achieved byvarious means such as improved engine efficiency andaerodynamic drag reduction. From the early days, thedesigners recognized the importance of drag reduction andtried to streamlined the design. Since the early 20-th century,large number of studies were carried out in this field andsome are listed here[1-6]. This was also the time offormulating of basic principles of vehicle body optimization,and definition of drag lower limit. For a perfect car bodyconfiguration the lowest possible aerodynamic dragcoefficient is 0.16.Simulating road conditions has an effect on drag in thewind tunnel [4] and it is concluded that use of smoothimmovable screen gives good result for comparative tests. Therear part of the vehicles make large contribution to the totaldrag and different forms of vehicle rear section has beenstudied [5]. In an interesting study [6], effect of variation infront and rear sections of minibus on total drag coefficient waspresented. There is a good publication [3] evaluating differentdesigns of vortex generators.The vehicles operate under different speeds, air flow rateand direction, and road conditions. No one streamline bodyA two prong study was undertaken, Computational FluidDynamic (CFD) approach and testing large models in the windtunnel under simulated conditions. This paper deals with theresults of investigations in wind tunnel of a vehicle modelwith various passive devices for drag reduction.The investigations were carried out in wind tunnel TAD-2of the National Aviation University of Ukraine (NAU). Windtunnel has the following main characteristics:- maximum speed of air flux in working sectionwithout model installed is 42 m/sec;- degree of initial turbulence of air flux in workingsection without model, defined using ball method, is 0.9%;- length of working section is 5.5 m;- overall dimensions of octagonal working sectioncross-section are: 4.0 m width, 2.5 m height; as shown inFigure 1.During tests it is possible to measure total vector ofaerodynamic forces and moments that affect model as well aspressure distribution over model’s surface. Wind tunnel ТАD2 was put into service in 1979 and was used many times forUkrainian aviation and space rocketry.
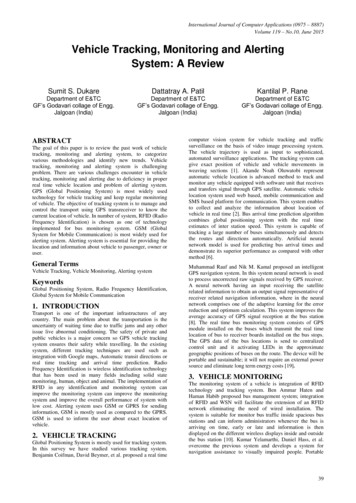
4 – contour of cross-section of working section of windtunnel)Preliminary results with different passive devices indicatedthat large drag reduction was achieved by two options andthese are "rear screen" and "rear fairing. The paper willdiscuss results for these two options.Paper will also present preliminary results from two otherpassive methods, astructure in the front and vortex generatoron the top at the rear of the model.Figure 1INVESTIGATIONS TASKS AND PURPOSEThe vehicle model tested is shown in Figure 2. The modellength is L 1710 mm.Figure 2. General View of Vehicle Basic ModelThe main results are given in comparative form (in percent) asthe base drag coefficient varied due to uncertainty in test setup. For each device testing, first the base case drag coefficientwas obtained, and then devices were installed and dragcoefficient was obtained.SETTING OF TASK TO TEST A MODEL WITH REARSCREENRear screen is a plate, installed at vehicle’s back (Fig.46).Fig.4 Vehicle’s Rear Part with Rear ScreenSchematic representation of model in the wind tunnel isshown in Figure 3.Figure 5. Side view of rear screenFig.3. Diagram of Vehicle Model Installed in Working Sectionof Wind Tunnel (front view)(1 – vehicle model; 2 – vertical road-simulating screen; 3suspension link of six-component electrotensometry balance;
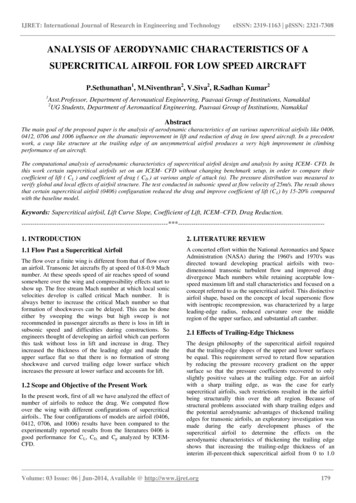
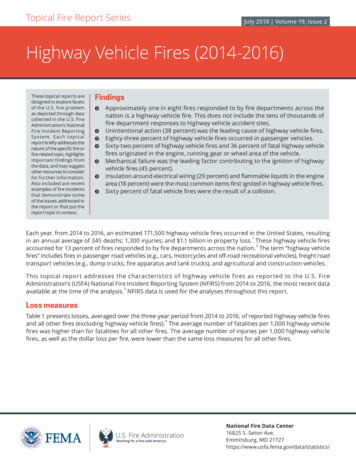
0.44Cx0.420.400.380.36Figure 6. Rear view of rear screen.The expected effect of aerodynamic drag reducing isachieved for the sake of vortex that originates between vehiclemodel’s rear wall and screen; the vortex enables no-separationflow of external air flux. This results in bottom tracenarrowing and thus to reducing of base drag for the sake ofpressure increase.The screens were installed at various distance h frommodel surface. Screen contour took after back view vehiclecontour on a scale of D 0.6 and 0.8 with the screen thicknessof 7.5 mm. Also the tests of screen of 1 mm thick were also*considered with similar scale size of rear part contour ; D 0.8 and 0.6.Also we investigated impact of two screens, installed oneafter another. The distance between model rear wall and firstscreen is h1 and distance between screens is h2.RESULTS OF TESTS OF MODEL WITH REARSCREEN.To exclude method error caused by possible inaccuracy ofmodel installation on air flux velocity vector, the tests weredone for various incident angles . At this the minimum valueof any function on parameter corresponds to vehicle’sincident head flow without slide angle that can occur in fieldconditions. In all cases use of rear screens reduces vehiclemodel’s aerodynamic drag. Among the investigated cases the*most effective one was use of screens D 0.6; D 0.8 and;0.6 and the resistance decrease was 5.5% to 6.5% (Fig.7).Table 1 shows that there is optimum gap for theleast dragcoefficient.Visual observation let to see vortex in the clearancebetween screen and model’s rear wall, at least, on top. Onsides flux stall was observed directly behind the model. It isworth mentioning that for this vehicle configuration it was notpossible to form stable oval vortex in the clearance betweenscreen and model’s rear wall, which could provide moreaerodynamic drag reducing. Preliminary CFD calculationsalso showed higher pressure behind the screen that providedadditional reduction in opposing force.2 4- double rear s creen D 0,8, h1 50 mm, D 0,6, h2 160 mm;- rear sc reen D 0,6, h 200 mm;- rear screen D* 0,6, h 158 mm;- rear screen D* 0,8, h 100 mm; - without rear screen.-4-20 Fig.7 Impact of Rear Screen on Aerodynamic Drag Factor Сх.Table 1, Effect of gap on drag coefficient-rear screen D 0.6h, mmСхmin2240.3782000.3781580.3871000.392Without rear screen (base0.402drag coefficient)SETTING OF TASK TO TEST MODEL WITH REARFAIRINGThe second investigated means of aerodynamic dragreducing, the so-called rear fairing, implies a structure invehicle’s back part, included into the separation area, and, in aperfect case, providing no-separation flow of modifiedconfiguration vehicle model (Fig.8).Results of the investigations are useful for analysis ofbasic means of possible reducing of aerodynamic drag forestimation of minimum possible values; they are of academicvalue. The purpose of tests was also obtaining of experimentaltest base for testing of design methods and analysis ofpossibility of separated flow design simulation.Figure 8. Vehicle Model with Four-Section Rear Fairing
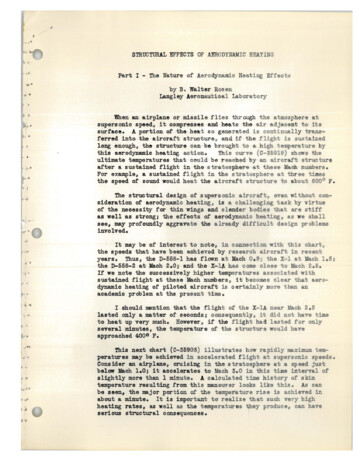
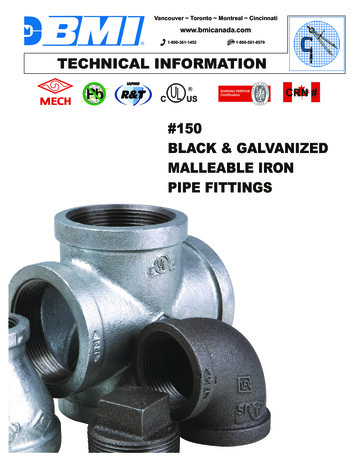
Here are several configurations of rear fairing of variouslength, schematically shown in Figure 9.ADDITIONAL CONCEPTSAdditional devices were tested to reduce drag.Structural elements that localize the area of flowdetachment (edging) shown on figure 9 and figure 10 wereattached to the front of the model. This elements have tocreate return zones with low pressure (figure 11) on the edgeof car. Same investigation was providing in [9].Fig.9. Geometry of Rear FairingRESULTS OF TESTS OF MODEL WITH REARFAIRINGResults of aerodynamic drag force factor are shownin Figure 10Fig.9. Structural elements that localize the area of flowdetachment (circular edging)Cx0.80.70.60.50.40.3-16-12-8-40- model without tail units;- model with 2 tail units;- model with 4 tail units;48121620 - model with 1 tail unit;- model with 3 tail units;- front streamlined shapeFig.10. Structural elements that localize the area of flowdetachment (only up and down edging)Fig.8. Dependencies of Aerodynamic Drag Factor of SlideAngle (base drag coefficient Cx 0.415)The series of tests accomplished allowed to work outvarious approaches to reduce aerodynamic drag, used inaviation. For example, tail pieces of aircraft (fuselages,nacelles, chassis nacelles, suspensions) are supplied with rearfairing.Use of idealized aft rear fairing for the vehicle modelunder consideration also showed high efficiency of such astructure. At installation of full-size rear fairing, headaerodynamic drag factor of vehicle model has decreased by26%. Half-length truncated rear fairing also has highaerodynamic efficiency and allows to reduce aerodynamicdrag factor by 22.6%. At aft rear fairing length being 25% ofits full length vehicle model drag factor is reduced by 16.1%.Fig.11. The schema of flow with edging
The distance between edging and front edge of car modelb and also the height of edging h were varied in the tests. Theheight h was changed from 15mm to 25 mm and the distance bwas changed from 30 to 60 mm. The investigation of two formof edging was provided - the ring edging in front part of car(figure 9) and upper and down edging on front part of car(figure 10).The results of investigation for optimal values of h and bare shown in Table 2.Table 2, Effect of gap on drag coefficient- Structural elementsthat localize the area of flow detachmentStructural elements thatBase draglocalize the area of flowcoefficient Сx %detachmentCxEdging having only upperand down elements on-2.240,392distance 30 mm with heightof 25 mmRing edging with height of 15 1.740,392mm and on distance 60 mmAlso was conducted research vortex air flow generatorsplaced on the back edge of roof. Three variants of vortex wastested (figure 12). In this option, the net change in dragcoefficient is result of balance between increase in drag due tothe device and reduction in drag due to reducing flowseparation.For VG1 vortex generator, the distance from rear edge ofcar was changed from 36mm to 60mm, the height of vortexgenerator was changed from 12mm to 25mm and angle ofsetting was changed from 15 to 18 . There were seven vortexgenerators.For VG2 vortex generator, the number of vortexgenerating elements varied from 24 to 30 (Figure 13). Thedistance from rear edge is 30mm, the height of the elements is10mm.For VG3 vortex generator, the number of elements variedfrom 16 to 24 (Figure 14)Fig.13. VG2 vortexesFig 14 VG3 vortexesThe test results for the best combinations of geometricparameters are shown in table 3.Table 3, Effect of Orientation of Plates of Vortex generatorson drag coefficientBase drag СxType of Vortex Generatorscoefficient%CxVortex generators (VG1) onthe roof it the rear part, 36mm distant from the edge – 7 0.250,392elements., step of 70 mm, γ 15º, h 20 mmPrism-shaped vortex generator(VG2) on the roof in the rear-1.240,392part, 36 mm distant from theedge –30 elements, 0Vortex generators (VG3) withClark type profile.8 elements from every side of-0.260,389longitudinal axis mowing astream from lateral surfaces tothe centreThe tests with elements that localize the area of flow andair flow vortex generators have not given a considerablepositive effect and will require additional analysis.VG1VG2VG3Fig.12. The types of vortex generators.CONCLUSSIONS1. Use of rear screen allows a reduction in aerodynamicdrag of the vehicle model under consideration by up to 6.5%.Efficiency of rear screens from point of view of drag reducingequally depends on configuration, dimensions andarrangement of screens as well as on model’s rear partconfiguration. The external mount of spare tire can bearranged to reduce drag.2. Rear fairing as part of flow separation area behind thevehicle can reduce aerodynamic drag of the vehicle withinvestigated configuration, by up to 26%. These results can beused at analysis of accuracy of calculation methods fordefining aerodynamics of vehicles with separated areas. The
results can also be useful for designers and design engineers inselection of vehicle external configuration.3. The other passive options also have potential toreduce drag. Front structural elements showed decrease indrag coefficient up to 2.24% and vortex generator showed adecrease up to 1.24%. There is scope to achieve additionalimprovement with the understanding of flow field andoptimization of design.AKNOWLEDGEMENTWe would like to thanks Bahram Khalighi (General MotorsGlobal R&D, Vesicle Department Research Lab, USA) andAlexey Ushakov (Chief Scientist for Eastern Europe GM R&DOffice) for their help and guidance in this research. Thisresearch investigation was done under Department of Energyprogram of Global Initiative for Proliferation Prevention grant(BNL-T2-370-UA).REFERENCES:1. W.H.Hucho - “Aerodynamik des Automobils” - p.158161 - Vogel Verlag, 1981.2. “Experimental Research of Vehicle Model TypeRAF”, KHAI, 1990.3. Masaru Koike*, Tsunehisa Nagayoshi*, NaokiHamamoto* - “Research on Aerodynamic Drag Reduction byVortex Generators”. Mitsubishi Motors/ Technical Review,2004. No 6, pp.1-16.4. S.P.Zagorodnikov - "Modeling of road in wind tunneltests» - News of higher education institute. Machine building. –1980.5. Carr G.W. The Study of Road Vehicle AerodynamicsUsing Wind Tunnel Models. Paper 14, Proc. 1st Symp. RoadVehicle Aerodynamics, London, 1969.6. Technical report of Kharkov Aviation University.
rear screen which is plate behind the car and rear fairing where the end of the car is aerodynamically extended, were incorporated in the model and tested in the wind tunnel for different wind conditions. The conclusion is that rear screen could reduce drag up to 6.5% and rear fairing can reduce the drag by 26%. There were