Transcription
HERCULE: Attack Story Reconstruction via CommunityDiscovery on Correlated Log GraphKexin Pei† , Zhongshu Gu‡ , Brendan Saltaformaggio† , Shiqing Ma† , Fei Wang† ,Zhiwei Zhang† , Luo Si† , Xiangyu Zhang† , Dongyan Xu††Purdue University, ‡ IBM T.J. Watson Research CenterABSTRACTAdvanced cyber attacks consist of multiple stages aimed atbeing stealthy and elusive. Such attack patterns leave theirfootprints spatio-temporally dispersed across many different logs in victim machines. However, existing log-miningintrusion analysis systems typically target only a single typeof log to discover evidence of an attack and therefore failto exploit fundamental inter-log connections. The output ofsuch single-log analysis can hardly reveal the complete attackstory for complex, multi-stage attacks. Additionally, someexisting approaches require heavyweight system instrumentation, which makes them impractical to deploy in real production environments. To address these problems, we presentHERCULE, an automated multi-stage log-based intrusionanalysis system. Inspired by graph analytics research insocial network analysis, we model multi-stage intrusion analysis as a community discovery problem. HERCULE buildsmulti-dimensional weighted graphs by correlating log entriesacross multiple lightweight logs that are readily available oncommodity systems. From these, HERCULE discovers any“attack communities” embedded within the graphs. Our evaluation with 15 well known APT attack families demonstratesthat HERCULE can reconstruct attack behaviors from aspectrum of cyber attacks that involve multiple stages withhigh accuracy and low false positive rates.1.INTRODUCTIONEmerging cyber attack campaigns (e.g., enterprise-wideAPT) exhibit “low-and-slow” attack patterns: attackers conduct reconnaissance and move laterally within a networkvia many stealthy multi-stage payloads. One annual reportpublished by FireEye [18] highlighted that attackers mayreside in a victim’s environment for up to 205 days beforebeing discovered. Importantly, the covert nature of theseattacks is derived from their deliberately small footprints oneach affected system.Our analysis of the attacks spanning 15 well known cyberattack families [3,8,9,12,21,24,28,47–50,61] (Section 4) showsPermission to make digital or hard copies of all or part of this work for personal orclassroom use is granted without fee provided that copies are not made or distributedfor profit or commercial advantage and that copies bear this notice and the full citationon the first page. Copyrights for components of this work owned by others than theauthor(s) must be honored. Abstracting with credit is permitted. To copy otherwise, orrepublish, to post on servers or to redistribute to lists, requires prior specific permissionand/or a fee. Request permissions from permissions@acm.org.ACSAC ’16, December 05 - 09, 2016, Los Angeles, CA, USAc 2016 Copyright held by the owner/author(s). Publication rights licensed to ACM.ISBN 978-1-4503-4771-6/16/12. . . 15.00DOI: http://dx.doi.org/10.1145/2991079.2991122that the stages within a single attack will often span manyusers, processes, and systems. Typically, the initial stageof a successful penetration is a social engineering campaign(e.g., a phishing email [61]), watering-hole attack [3], ortrojaned software or unofficial patch containing maliciouspayloads [9, 21, 24, 47–49, 61]. After gaining a foothold in thenetwork, reconnaissance payloads will be deployed, includeCommand and Control (C&C) channels, stealing passwords,or exploiting vulnerabilities to escalate privilege. In laterstages, attackers slowly move throughout the network [8]seeking opportunities to exfiltrate confidential information,eavesdrop on communications, or interrupt critical services.Unfortunately, any footprints left by such multi-stage attack pattern are spatio-temporally dispersed across manyseparate logs on different victims’ machines. For instance,downloading a trojaned executable may leave evidence inthe web browser’s log, but accessing confidential files mayonly be revealed in the system audit log. Further, finegrained on-host provenance logging systems [29, 36, 40] arestill rarely deployed on end-user systems. Therefore, piecing together the contextual information of each maliciousfootprint (scattered across many disconnected sources) stilldemands significant effort from cyber investigators.To date, most existing log-based intrusion analysis anddetection systems have the following three limitations: (1)Lacking the panoramic view required to understand the whole attack trace due to their focus on only single log types.For example, network intrusion analysis techniques [14, 51]leverage deep packet inspection or packet headers from asingle network log, such as a DNS log or an HTTP proxy log.Other systems [29, 33, 34, 36, 40] perform host-based analysison a system’s audit log, such as a Windows event log. (2)The log collection process relies on logging systems that require heavyweight instrumentation, which incurs non-trivialperformance overhead. For example, to achieve fine-grainedsystem call level traces of an attack, Gu et al. [27] performheavyweight event tracing for Windows (ETW) logging [15].Yin et al. [64] use whole-system fine-grained tracking todetect and analyze privacy-breaching malware. Other approaches [29,30,33,34,36,46] perform static/dynamic analysisto obtain execution models or control flow graphs. Whileshown to be fine-grained, their substantial overhead limitstheir applicability to the real-world environment. (3) Toomany uncorrelated alerts may be either deemed false positivesor overlooked by system administrators [1]. They provideneither much actionable intelligence nor enough attack evidence. For instance, a single log entry of “user failed to login”is a potential indicator of a compromise, but by correlating
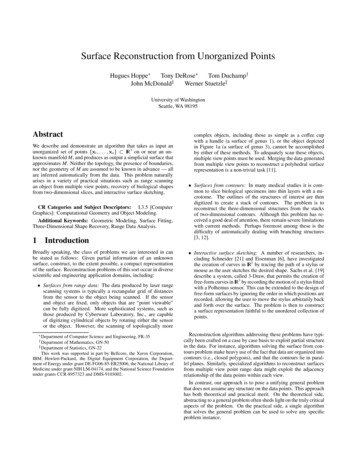
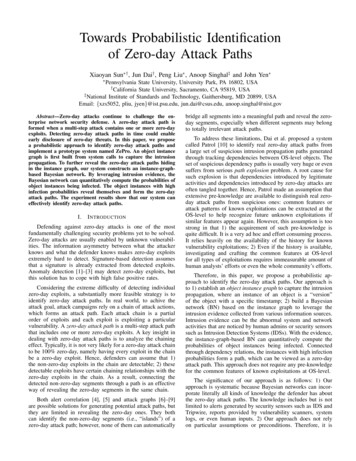
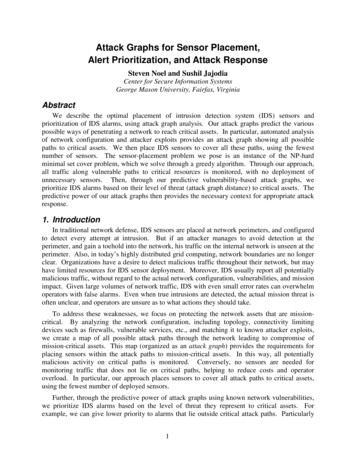
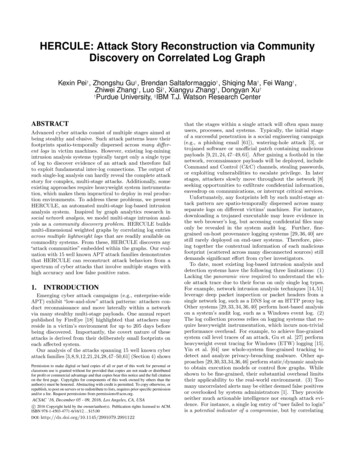
Attack-relatedcommunitySecond Stage:Maintaining Persistence,Updates Codes and ToolsFirst Stage:ReconnaissanceLaunch the Attack andInfect Target HostsCULE reveals the attack-related communities and their interconnections based on their relationship to any tainted entries(Section 3.4).Our work in this paper makes the following contributions: We propose a novel technique to model the relationship between multiple logs in the system by leveraging causality analysis without heavyweight logging orprogram instrumentation. HERCULE automaticallygenerates a multi-dimensional weighted graph with potentially valuable information embedded within. Ourproposed graph based representation provides a “panoramic view” of the logs generated by different systemcomponents.Tainted Log EntryThird Stage: MovingLaterally, ExfiltrationSensitive DataMultidimensional vectord1 d2 d3 d4 dn1 0 1 0 0Figure 1: Attack stages and correlated log entries.with other alerts, such as suspicious reverse TCP activity,investigators can (manually) piece together an attacker’sfootprints.In light of the above three limitations, we are motivatedto focus our detection on the abundance of light-weight logs,which are more likely to be deployed in end-user systems. Bycorrelating the many disparate entries across these logs, weaim to automatically reveal the attacker’s footprints, just asan investigator would have done. We present HERCULE1 ,an attack analysis framework that aims to automaticallyreconstruct an attack’s stages and movement from multiplelightweight system logs. HERCULE is based on the observation that the attack-related log entries, triggered by themultistage payloads, have dense and heavy-weighted connections within themselves, but sparse and light-weightedconnections with the benign log entries. In this way, theweighted graphs built from system logs is similar to socialnetworks: people with similar interests, backgrounds, orfriend circles, have closer connections to each other.Figure 1 gives an overview of many log entries dispersedin different stages of the intrusion being correlated by multidimensional edges. The red nodes are real attack traces,and yellow nodes are the suspicious log entries not belongingto any real attacks. The white nodes represent benign logentries. The tainted log entry is marked as “attack-related,”which is used later to classify the attack-related community.HERCULE is designed to discover the latent attack-relatedcommunity embedded in the graph (the extracted circle inFigure 1), despite the benign and malicious log entries beinghighly interleaved with each other.Based on causality analysis, HERCULE extracts varioustypes of the correlations and construct a uniform vectorrepresentation of the connections between the log entries(Section 3.1). For example, the blue (vertical) edges inFigure 1 illustrate the multi-dimensional network edges whichHERCULE assigns different feature weights, revealing thedensely connected communities. We provide several versionsof weight assignment in Section 3.2, which helps to increasethe system performance by supervised learning and quadraticprogramming.HERCULE then applies a community detection algorithmto the global graph and generates a series of communitycliques. With the tainted attack-related log entry (e.g., viamalware binary analysis [35,53] or website blacklisting), HER1HERCULE stands for Harmful Episode Reconstruction byCorrelating Unsuspicious Logged Events, also as a tribute to Hercule Poirot, one of the most celebrated fictional detectives We leverage social network analysis and adapt thecommunity detection algorithm in our weighted graphsettings. We also propose several learning techniquesto optimize weight assignment and increase the systemperformance. To the best of our knowledge, no suchtechniques have been adopted to date in log-basedattack analysis. We conduct an extensive evaluation of HERCULE forthe analysis of attack scenarios based on 15 real-worldAPT reports with diverse combinations of applications,malicious payloads, and attack methods, demonstratingthe effectiveness of HERCULE.2.SYSTEM OVERVIEWFigure 2 shows a simplified attack scenario that leavesmalicious footprints across different logs. In the first stage,the user V is tempted to download a trojaned version ofNotepad .exe from Gmail in Firefox with a malicious payload embedded. There are three actions in the second stage:(1) V initiates the trojaned Notepad .exe installation process. This causes the embedded malicious payload to open areverse TCP connection to a remote C&C server. (2) Afterestablishing the C&C channel, the C&C server sends thecommand to search for a private file plan.docx, attempting to collect the competitor’s business plan. (3) The C&Cserver sends the instruction to download the NESSUS.exe [45]vulnerability scanner from the C&C server through FTP.In the third stage, the C&C client receives instructions torun NESSUS.exe to scan within the subnet and exfiltrateplan.docx through FTP back to the C&C server.Figure 2 shows the connections of the attack traces acrossfive different logs (those connections that investigators mustmanually recover). Further, besides the attack-related entriesshown in Figure 2, numerous benign entries and suspiciousentries (i.e., truly benign but still requiring investigation)are also recorded in the logs. The goal for HERCULE isto automatically extract and present investigators with thethree attack phases and their interconnection from the manydisparate log entries.Workflow of HERCULE. Figure 3 presents the keyphases and operations of HERCULE. The input to HERCULE is multiple raw logs from both network (e.g., DNS,WFP, HTTP) and system activity (e.g., Process creation,File access, Authentication). HERCULE’s detection logicis specifically designed to be log-format agnostic and thusHERCULE can handle any input log file given that a parserfor its format can be supplied as a plugin. Notice that investigators would need to understand (and therefore parse)
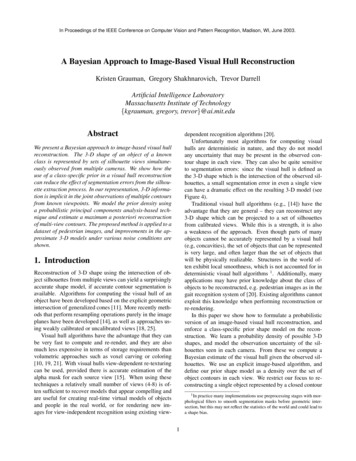
First ect Access,Notepad .exe, me Notepad Connect,0x750,firefox, ,74.125.225.22,80Second stage00:07:57,ProcessCreate,Notepad .exe,creator FirefoxThird stage00:07:57, ProcessCreate, ftp.exe, 0x750,creator P00:07:57,ProcessCreate,P,0xbb8,creator Notepad 4400:07:57,WFPConnect,0x750,ftp.exe, ,0x750,pname FTP00:08:11,ObjectAccess, plan.docx,0xbb8, ftp.exe00:08:09,ProcessCreate,NESSUS.exe,0x260, creator 1,2,.Figure 2: Parsed attack-related log entries in different types of logs (marked in blue), and the key observationto correlate the log entries (marked in red). For clarity, some log entries are slightly different from the realparsed log entries in our experiment. We also delete some edges for illustrating clear graph.Phase IIPhase IPhase IIIConnectionGenerationTaintingModuleNetworkRaw LogsStructuredSystemLogsLog CorrelationModuleCorrelated duleWeightAssignmentSupervisedlearningAttack StoryCommunity1 Raw LogParserSystemRaw oduleClassificationPerformanceEvaluationAdded WeightFigure 3: Workflow of HERCULE.the format of these logs anyway during their investigation.Thus requiring such a parsing plugin is not a significant additional overhead. Further, parsing plugins are reusable inany future investigations of those log types. The remainderof HERCULE’s operation is fully automated.Phase I. The Raw Log Parser processes each input logentry via its parsing plugin to extract a set of predefinedfields (refereed to as a data entity). Each data entity isgiven as input to the Log Correlation Module (Phase II) andthe Tainting Module. The Tainting Module scans the dataentities and (1) analyzes any suspicious executable binaryappeared in the log entries that is not in a whitelist byleveraging popular malware/virus analysis platform [60, 62]or (2) scans for known malicious website accesses based ona URL blacklist to identify initial attack-related log entries.These initial attack-related log entries will subsequently beprocessed by the Post Processing Module.Phase II. The Log Correlation Module consists of two submodules: Connection Generation and Weight Assignment.(1) Connection Generation connects any two log entries (viaan unweighted multi-dimensional edge) if there exist oneor more types of correlation between them (this process isdetailed in Section 3.1). For example, in Figure 1, if the twonodes connected by the blue edge have the same timestamp(denoted by d1) or share the same process ID (denoted byd3), then these entries should be correlated. (2) WeightAssignment assigns weight on each edge. Note that there aremultiple ways to assign weights to multi-dimensional edges,in which one of the supervised learning techniques has provento achieve the best result. We present the details of weightassignment in Section 3.2.Phase III. The Community Detection Module takes thecorrelated weighted graph as input and outputs all detectedcommunities to the Post Processing Module. Starting fromany log entries tainted in Phase I, the Post Processing Moduleclassifies the communities that contain tainted entries asmalicious and the others as benign. It then outputs thereconstructed attach phases (temporally ordered actions orcommunities) and their interconnection from the attackrelated community. Section 3.4 presents the detailed designof HERCULE’s community detection.3.SYSTEM DESIGNLog parsing is an essential step to transform the raw datainto data entities before applying any learning model. Thusfar, we have implemented log parsing plugins for the logsshown Table 1. To capture attack footprints projected acrossvarious logs, we select different sets of logs based on the hostOS platforms. For example, on Linux, we choose the Syslogdauthentication log, while on Windows we make use of theWindows filtering platform (WFP) log which records theinbound and outbound network connections the processesmakes. For each log, raw log parser extracts pre-definedfields that capture representative information of each logentry. We summarize these in Table 2.3.1Connection GenerationThe input to the Connection Generation sub-module isthe parsed data entities. The output is the unweighted, undirected, and multi-dimensional graph which is built from theintra-log and inter-log correlation. Analogous to a socialnetwork, we treat each log entry as an individual and eachedge dimension as one type of relationship between two individuals. Formally, in the unweighted n-dimensional networkG (V, E, D) where V is a set of nodes, E is a set of edgesand D is a set of dimensions, G forms a V V D 3-dimensional boolean matrix M . Mi,j,k 1 indicates thereexists a correlation dimension k between log entry node i
Table 2: Fields Correlated Across Logs.FieldLogsL1 DNSL2 WFP connectL3 HTTPDescriptionevent timestampq domainL1DNS quiered domain namer ipL1DNS resolved ip addresspidL2, L4, L5base-16 process idppidL4base-16 parent process idpnameL2, L4, L5, L6 process nameProviderh ipL2host IP addressTsharkh portL2host port numberAuditdd ipL2destination IP addressd portL2destination port numbertypeL3request/responseget qL3absolute path of GETpost qL3absolute path of POSTres codeL3response codeh domainL3host domain namerefererL3referer of requested URIres locL3location to redirectacctL5principle of this accessobjnameL5object nameinfoL6Authentication informationTable 1: Logs used inSection 4.#Logstimestamp L1-L6FirefoxL4 Process createAuditdL5 Object accessAuditdL6 Authentication Syslogdand log entry node j, otherwise Mi,j,k 0. Each e Econsists of (n 2)-tuples (i, j, d1 , d2 , · · · , dn ) with i, j Vand d1 , · · · , dn D.Feature Selection. In HERCULE, for each pair of log entries, denoted as nodes u and v, which have one or more typesof relationships, we connect them with multi-dimensionaledge e. The dimensions of the edge is denoted as a uniform29-feature vector v [d1 d2 · · · d29 ]T , in which the binaryvalue of each dimension dk represents the existence of the kth type of relationship between u, v. If u, v can be correlatedby k-th relationship, dk 1, otherwise dk 0.The intuition behind each of the 29 features to capturepotential causally-related log entries (summarized in Table 3)is as follows. For two log entries u and v: d1 models the time difference between u and v. Theuser can customize the threshold t (between two timestamps of u and v) to determine whether two log entriesare temporal correlated. We show the detection performance result of choosing different t in Section 4. d2 and d13 captures the relationship if u, v share thesame process id or process name. This feature is intended to capture the explicit/implicit correlations fromprocess creation and process operations. d3 and d4 demonstrate whether u and v share thesame destination IP or port when they make outboundconnection requests. The intuition is based on theobservation that u and v (two network requests) arehighly correlated if they communicate to the same IPaddress. d5 to d8 belong to the features that capture the correlation of u and v within HTTP log. They model thecausality relations of web page browsing events. Severalattack reports in Section 4 show that the initial stage ofTable 3: Features Described byEach 8d19d20d21d22d23d24d25d26d27d28d29Feature (u.timestamp, v.timestamp) tu.pid v.pidu.d ip v.d ipu.d port v.d portu.referer v.refereru.host v.hostu.referer v.hostu.host v.refereru.ppid v.ppidu.ppid v.pidu.pid v.ppidu.objname v.objnameu.pname v.pnameu.r ip v.d ipu.d ip v.r ipu.q domain v.h domainu.h domain v.q domainu.q domain v.refereru.referer v.q domainu.q domain v.res locu.res loc v.q domainu.get q v.pnameu.pname v.get qu.get q v.objnameu.objname v.get qu.pname v.objnameu.objname v.pnameu.r ip v.h ipu.h ip v.r ipan attack often involves a sequence of URL redirection.Thus, we aim to recover a complete browsing tracesthat are related to the attack story. d9 to d11 model the process creation correlations. Forinstance, we observe that many malicious operationsare done by a shell process so that we need to traceback the parent or predecessor process of that shell torecover more attack traces. d12 checks if u and v access to the same object. It isbased on the observation that some malicious processcreates the malicious executable (logged in u), andanother process executes the executable (logged in v).u and v belong to the same attack traces and henced12 1 denotes that u and v are causally related. d14 , d15 , d28 , and d29 model how outbound/inboundnetwork requests correlate to DNS queries. The intuition is based on the fact that most C&C client/servercommunications leverage DNS service to resolve dynamically changing server IP addresses [51]. d16 to d21 capture the correlation between DNS querybehavior and web page browsing behavior by examiningthe equality of several related fields. We seek to includein the attack story of DNS resolving query and thecorresponding browsing events on websites. d22 to d27 model how web browsing behaviors reflectedin HTTP log correlate to system-level behaviors, e.g., auser may download a malicious executable from the weband execute it locally. It can also spawn new processes,access objects and make network connections.It is possible that there exist more features beyond thosein Table 3. HERCULE is extensible in that users can add orremove features to customize the system.
Also, note that these features can lead to false-positiveconnections in our graphs. This is because any local noise inthese features will be discarded during community detection,which focuses exclusively on global patterns (communities)within the resulting global graph.With defined features on each edge, we build the connections for each log entry from all the input logs. The input tothe connection generation algorithm are the features selectedin Table 3 and all parsed structured logs. The algorithm onlygenerates edges with at least one feature vector value beingnon-zero. The algorithm iterates all possible log pairs thatcapture both intra-log correlations and inter-log correlations.3.2Weight AssignmentOnce the correlated log graph has been constructed, weuse a community detection algorithm to detect communities.Formally, given two community clusters of nodes A and B inan unweighted multi-dimensional graph G where A denotesattack-related log entries and B represents benign entries:optimally, we expect to get eA eAB and eB eAB where eA , eB , and eAB denote the number of edges incluster A, B, and between A and B, respectively. Note thatthese notations are valid throughout all this section.However, it is observed that in the unweighted multidimensional graph generated in Section 3.1, there exist casesof log entries that belong to the attack but have numerousconnections with benign entries ( eA eAB ). This casesignificantly reduces the effectiveness of any community detection algorithm that aims to maximize the intra-clusterdensity eA , eB and minimizes inter-cluster density eAB (we present the details of the algorithm in Section 3.4). Onthe other hand, we make the observation that the valuesof the feature dimensions between eAB and e A , e B (e A , e Band eAB denote the edge vector of eA , eB and eAB , respectively) are significantly different. This implies that we candistinguish eA , eB from eAB by their feature vector.Inspired by this observations, weight assignment algorithmis therefore proposed to deal with the above circumstances.Generally, the algorithm tries to assign different weights toedges that have different edge feature values so that theinequality still holds wA · eA wAB · eAB (wA is weightassigned for edges in eA and wAB is weight assigned foredges in eAB ). More specially, the algorithm tries to “learn”a global weight vector α that can be applied on each edge.Thus, the following equation still holds:kXXe eAe eBi 1αi · ei kXXe eABi 1kXXαi · ei kXXe eABαi · e ii 1(1)αi · e ii 1where k is the number of dimensions of edge vector and ei isthe i-th value of edge vector e.Intuitively, we can assignPthe dot product of the weightvector and edge vector w ki 1 αi ei as the weight on eachedge to construct a weighted graph. However, most of thelearning algorithms that we apply in weight assignment output α Psuch that the dot product has no bound on the value(w ki 1 αi ei ) R, which might generate negative weightw 0 and violate the requirement of input for the weightedgraph community detection algorithm. Consequently, weleverage a sigmoid function S to map the dot product tobounded real number range [0, 1] as our finalized weight asP1Psignment on each edge: w S( ki 1 αi ·ei ) kα ·e1 ei 1iiWe then transform the graph into a weighted graph W G.For evaluation of the weight assignment algorithm, we defineour training phase and testing phase as following: Given nunweighted graphs G1 , G2 , · · · , Gn , for each l (l [1, n]), (1)the training phase of the weight assignment looks for a bestassignment weight vector α k for G1 , · · · , Gl 1 , Gl 1 , · · · ,Gn ; (2) the testing phase takes the dot product of weightvector α l and all edge vectors e to generate a weighted graphW Gl . Then, the Community Detection Module takes W Gl asinput and outputs communities for Post Processing Module.Essentially, this training/testing process adopts the leaveone-out strategy.We have also built different algorithms for weight assignment for comparison. The first does not use any learningalgorithm, the second and third leverage existing supervisedlearning techniques that outperform the first, and the fourthis based on quadratic optimization that has the best performance results. We use the quadratic optimization algorithmas our finalized version of weight assignment in HERCULE,and compare their results quantitatively in Section 4.Feature Weight Summation. As a baseline solution,this algorithm treats each feature of an edge with the same“importance”: αi 1, i [1, k] where k denotes the numberof features. To hold Equation 1, this algorithm depends onthe assumption that edges in A or B have more correlationtypes than edges between A and B. More specifically, thisalgorithm assumes the edge vectors of e A and e B has more1’s than edge vectors of eAB . From the results presented inSection 4, we find that the performance is not ideal. Thereason is that there exist cases when two edge vectors, onefrom eA , eB and the other from eAB , (1) are not distinguishable by their number of 1’s of their vector values, but differin type of features where the 1 reside, such as two vectors[1 0 1] and [0 1 1], or even worse, (2) the edge vector in eAor eB has less 1’s in the vector values than those in eAB .Motivated by the discussed limitations, we adapt twolearning approaches (Logistic regression and SVM), whichassign different “importance” on the edge features.Logistic Regression. Logistic regression [44] can beapplied in our weight assignment as we abstract the weightassignment as a classification problem. We want to learn theglobal weight α that helps to classify edge vectors into oneclass eA , eB and another class eAB . Suppose there are mtraining edges, denoted E xi , yi , i [1, m] where xi is i-thedge vector e i , yi 1 if ei eAB and yi 0 if ei eA or ei eB . In training, we construct a prediction function, whichT1leverages logistic function g: hα (xi ) g(α xi ) 1 e αxiwhere hα (x) denotes the probability that ei eAB (yi 1):P (yi 1 xi , α ) hα ) 1 hα (xi ) and P (yi 0 xi , α (xi ).Then we should minimize the cost function in log likelihoodmmPP1format: m[ yi log hα(1 yi ) log(1 hα (xi ) (xi ))].i 1i 1The minimization problem can be solved by using gradientdescent. Please refer to [44] for more details of the algorithm.SVM. Another classification solution for learning the weight vector α is an SVM [19]. Suppose there are m trainingedges, denoted E xi , yi , i [1, m] where xi is i-th edgevector e i , yi 1 if ei eAB and yi 1 if ei eA orei eB . The purpose of the SVM is to learn a weight vectorα , which can accurately distinguish eAB from eA , eB . We
use the soft margin version; the detailed formulation can befound in [19].Quadratic Programming. The above two classificationlearning algorithms look for a decision boundary that classifies edges into two types (eA , eB vs. eAB ). However theiroutput weight vectors are not the global optimum, which arenot guaranteed to maximize the weight assigned to edge eAand eB , and minimize the weight assigned to edge eAB .Therefore, we design and develop a new solution, whichtransforms the weight assignment as a quadratic optimizationproblem. Adapted from Equation 1, our target function is:maxkXXe eAα λαi · e i i 1kXXe eABs.t.kXXe eBαi · ei i 1αi · eii 11 Tα ·α 2(2)0 α T e 1defined as:Q ki kj1 XAv,w δ(cv , cw )2m v,w2mwhere m 3.3DFS PropagationPrior to coming up with the community detection approach,we designed a heuristic algorithm that neither uses any learning techniques nor community detection, which we term“DFS propagation”. We note that without the knowledgeof any low-level program execution analysis or fine-grainedlog analysis, we cannot capture the accurate causality relationship between log entries. Thus in this algorithm, weconservatively treat any log entry t as malicious if there existsa path from a tainted attack-related start point s to t, whichwe define s can propagate to t. The input to this algorithmis the tainted entry point v and the graph generated fromLog Correlation Module. It then uses Depth-First-Search(DFS) to recover all l
HERCULE, an automated multi-stage log-based intrusion analysis system. Inspired by graph analytics research in social network analysis, we model multi-stage intrusion anal-ysis as a community discovery problem. HERCULE builds multi-dimensional weighted graphs by correlating log entries across multiple lightweight logs that are readily available on