Transcription
JWCL165 c14 674-725.qxd8/16/097:46 AMPage 67414Financial StatementAnalysisChapterSTUDYOBJECTIVESAfter studying this chapter, you should beable to:1 Discuss the need for comparative analysis.2 Identify the tools of financial statementanalysis.3 Explain and apply horizontal analysis.4 Describe and apply vertical analysis.5 Identify and compute ratios used inanalyzing a firm’s liquidity, profitability,and solvency.6 Understand the concept of earningpower, and how irregular items arepresented.7 Understand the concept of quality ofearnings.The Navigator The NavigatorScan Study Objectives Read Feature Story Read Preview Read text and answerp. 681 p. 694 Work ComprehensiveDo it!p. 699Do it! p. 701p. 703 Review Summary of Study Objectives Answer Self-Study Questions Complete Assignments Feature StoryIT PAYS TO BE PATIENTIn 2008 Forbes magazine listed Warren Buffett as the richest person in theworld. His estimated wealth was 62 billion, give or take a few million. Howmuch is 62 billion? If you invested 62 billion in an investment earning just4%, you could spend 6.8 million per day—every day—forever. How didMr. Buffett amass this wealth? Through careful investing.You think you might want to follow Buffett’s example and transform yourhumble nest-egg into a mountain of cash. His techniques have been widelycirculated and emulated, but never practiced with the same degree ofsuccess. Buffett epitomizes a “value investor.” To this day he applies thesame basic techniques he learned in the 1950s from the great value investor674
JWCL165 c14 674-725.qxd8/16/097:46 AMPage 675Benjamin Graham. That means he spends his timelooking for companies that have good long-termpotential but are currently underpriced. He invests incompanies that have low exposure to debt and thatreinvest their earnings for future growth. He doesnot get caught up in fads or the latest trend. Instead,he looks for companies in industries with soundeconomics and ones that have high returns onstockholders’ equity. He looks for steady earningstrends and high margins.Buffett sat out on the dot-com mania in the 1990s,when investors put lots of money into fledgling hightech firms, because he did not find dot-com companies that met his criteria. He didn’t get to enjoy thestock price boom on the way up, but on the other hand, he didn’t have toride the price back down to earth. Instead, when the dot-com bubble burst,and nearly everyone else was suffering from investment shock, he swooped inand scooped up deals on companies that he had been following for years.So, how does Mr. Buffett spend his money? Basically, he doesn’t! He stilllives in the same house that he purchased in Omaha, Nebraska, in 1958for 31,500. He still drives his own car (a Cadillac DTS). And in case youwere thinking that his kids are riding the road to easy street, think again.Buffett has committed to giving virtually all of his money to charity beforehe dies.So, given that neither you nor anyone else will be inheriting Mr. Buffett’sriches, you should start honing your financial analysis skills as soon as possible.A good way for you to begin your career as a successful investor is to masterthe fundamentals of financial analysis discussed in this chapter. The NavigatorInside Chapter 14. How to Manage the Current Ratio Keeping Up to Date as an Investor(p. 685)(p. 693) What Does “Non-Recurring” Really Mean?(p. 698) All About You: Should I Play the Market Yet?(p. 702)675
JWCL165 c14 674-725.qxd8/20/0911:11 AMPage 676Preview of Chapter 14We can learn an important lesson from Warren Buffett. The lesson: Study companies carefully if you wish toinvest. Do not get caught up in fads, but instead find companies that are financially healthy. Using some ofthe basic decision tools presented in this book, you can perform a rudimentary analysis on any U.S. company and draw basic conclusions about its financial health. Although it would not be wise for you to bet yourlife savings on a company’s stock relying solely on your current level of knowledge, we strongly encourageyou to practice your new skills wherever possible. Only with practice will you improve your ability to interpretfinancial numbers.Before unleashing you on the world of high finance, we will present a few more important concepts andtechniques, as well as provide you with one more comprehensive review of corporate financial statements.We use all of the decision tools presented in this text to analyze a single company—J.C. Penney Company,one of the country’s oldest and largest retail store chains.The content and organization of Chapter 14 are as follows.Financial Statement AnalysisBasics of FinancialStatement Analysis Need forcomparativeanalysis Tools of analysisHorizontal andVertical Analysis Balance sheet Income statement Retained earningsstatementRatio Analysis LiquidityProfitabilitySolvencySummaryEarning Power andIrregular Items Discontinuedoperations Extraordinary items Changes inaccounting principle ComprehensiveincomeQuality of Earnings Alternativeaccounting methods Pro forma income Improperrecognition The NavigatorBASICS OF FINANCIAL STATEMENT ANALYSISAnalyzing financial statements involves evaluating three characteristics: a company’s liquidity, profitability, and solvency. A short-term creditor, such as a bank, isprimarily interested in liquidity—the ability of the borrower to pay obligationswhen they come due. The liquidity of the borrower is extremely important in evaluating the safety of a loan. A long-term creditor, such as a bondholder, looks toprofitability and solvency measures that indicate the company’s ability to surviveover a long period of time. Long-term creditors consider such measures as theamount of debt in the company’s capital structure and its ability to meet interestpayments. Similarly, stockholders look at the profitability and solvency of the company. They want to assess the likelihood of dividends and the growth potential ofthe stock.Need for Comparative AnalysisSTUDY OBJECTIVE 1Discuss the need for comparativeanalysis.676Every item reported in a financial statement has significance. WhenJ.C. Penney Company, Inc. reports cash of 2,471 million on its balancesheet, we know the company had that amount of cash on the balance sheetdate. But, we do not know whether the amount represents an increase
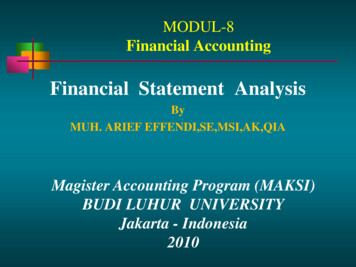
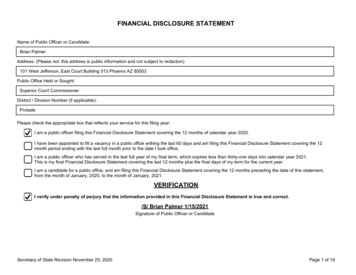
JWCL165 c14 674-725.qxd8/16/097:46 AMPage 677677Horizontal Analysisover prior years, or whether it is adequate in relation to the company’s need forcash. To obtain such information, we need to compare the amount of cash withother financial statement data.Comparisons can be made on a number of different bases. Three are illustratedin this chapter:1. Intracompany basis. This basis compares an item or financial relationshipwithin a company in the current year with the same item or relationship in oneor more prior years. For example, J.C. Penney can compare its cash balance atthe end of the current year with last year’s balance to find the amount of the increase or decrease. Likewise, J.C. Penney can compare the percentage of cashto current assets at the end of the current year with the percentage in one ormore prior years. Intracompany comparisons are useful in detecting changes infinancial relationships and significant trends.2. Industry averages. This basis compares an item or financial relationship ofa company with industry averages (or norms) published by financial ratingsorganizations such as Dun & Bradstreet, Moody’s, and Standard & Poor’s.For example, J.C. Penney’s net income can be compared with the average netincome of all companies in the retail chain-store industry. Comparisons with industry averages provide information as to a company’s relative performancewithin the industry.3. Intercompany basis. This basis compares an item or financial relationship ofone company with the same item or relationship in one or more competingcompanies. Analysts make these comparisons on the basis of the published financial statements of the individual companies. For example, we can compareJ.C. Penney’s total sales for the year with the total sales of a major competitorsuch as Kmart. Intercompany comparisons are useful in determining a company’s competitive position.IntracompanyXYZCo.2011 2012Industry averagesXYZCo. ACo.BCo.CCo.A B C3IntercompanyXYZCo.ACo.Tools of AnalysisWe use various tools to evaluate the significance of financial statementdata. Three commonly used tools are these: STUDY OBJECTIVE 2Identify the tools of financialstatement analysis.Horizontal analysis evaluates a series of financial statement data overa period of time.Vertical analysis evaluates financial statement data by expressing each item ina financial statement as a percent of a base amount.Ratio analysis expresses the relationship among selected items of financialstatement data.Horizontal analysis is used primarily in intracompany comparisons. Two features in published financial statements facilitate this type of comparison: First, eachof the basic financial statements presents comparative financial data for a minimum of two years. Second, a summary of selected financial data is presented for aseries of five to ten years or more. Vertical analysis is used in both intra- and intercompany comparisons. Ratio analysis is used in all three types of comparisons. Inthe following sections, we explain and illustrate each of the three types of analysis.HORIZONTAL ANALYSISHorizontal analysis, also called trend analysis, is a technique for evaluating a series of financial statement data over a period of time. Its purpose isto determine the increase or decrease that has taken place. This changeSTUDY OBJECTIVE 3Explain and apply horizontalanalysis.
JWCL165 c14 674-725.qxd6788/16/097:46 AMPage 678Chapter 14 Financial Statement Analysismay be expressed as either an amount or a percentage. For example, the recent netsales figures of J.C. Penney Company are as follows.Illustration 14-1J.C. Penney Company’snet salesJ.C. PENNEY COMPANYNet Sales (in millions)200720062005 19,860 19,903 18,781If we assume that 2005 is the base year, we can measure all percentageincreases or decreases from this base period amount as follows.Illustration 14-2Formula for horizontalanalysis of changes sincebase periodChange SinceCurrent Year Amount ⴚ Base Year AmountⴝBase PeriodBase Year AmountFor example, we can determine that net sales for J.C. Penney increased from 2005to 2006 approximately 6% [( 19,903 18,781) 18,781]. Similarly, we can determine that net sales increased from 2005 to 2007 approximately 5.7% [( 19,860 18,781) 18,781].Alternatively, we can express current year sales as a percentage of the baseperiod. We do this by dividing the current year amount by the base year amount, asshown below.Illustration 14-3Formula for horizontalanalysis of current year inrelation to base yearCurrent Results inCurrent Year AmountⴝRelation to Base PeriodBase Year AmountIllustration 14-4 presents this analysis for J.C. Penney for a three-year period using2005 as the base period.Illustration 14-4Horizontal analysis ofJ.C. Penney Company’snet sales in relation tobase periodJ.C. PENNEY COMPANYNet Sales (in millions)in relation to base period 2005200720062005 19,860105.7% 19,903106.0% 18,781100.0%Balance SheetTo further illustrate horizontal analysis, we will use the financial statements ofQuality Department Store Inc., a fictional retailer. Illustration 14-5 (page 679)presents a horizontal analysis of its two-year condensed balance sheets, showingdollar and percentage changes.
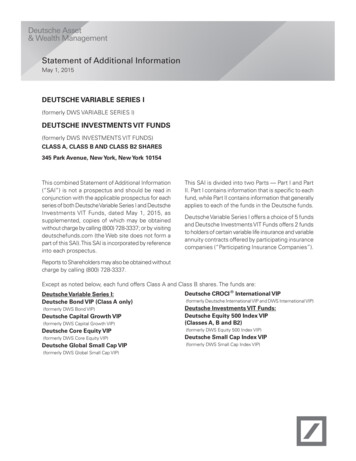
JWCL165 c14 674-725.qxd8/16/097:46 AMPage 679Horizontal AnalysisIllustration 14-5Horizontal analysis ofbalance sheetsQUALITY DEPARTMENT STORE INC.Condensed Balance SheetsDecember 31Increase or (Decrease)during 200720072006AmountPercentCurrent assetsPlant assets (net)Intangible assets 1,020,000800,00015,000 945,000632,50017,500 75,000167,500(2,500)7.9%26.5%(14.3%)Total assets 1,835,000 1,595,000 240,00015.0% 344,500487,500 303,000497,000 03,000795,000208,00026.2% 1,835,000 1,595,000 240,00015.0%AssetsLiabilitiesCurrent liabilitiesLong-term liabilitiesTotal liabilitiesStockholders’ EquityCommon stock, 1 parRetained earningsTotal stockholders’ equityTotal liabilities andstockholders’ equityThe comparative balance sheets in Illustration 14-5 show that a number of significant changes have occurred in Quality Department Store’s financial structurefrom 2006 to 2007: In the assets section, plant assets (net) increased 167,500, or 26.5% ( 167,500 632,500).In the liabilities section, current liabilities increased 41,500, or 13.7% ( 41,500 303,000).In the stockholders’ equity section, retained earnings increased 202,600, or38.6% ( 202,600 525,000).These changes suggest that the company expanded its asset base during 2007 andfinanced this expansion primarily by retaining income rather than assuming additional long-term debt.Income StatementIllustration 14-6 (page 680) presents a horizontal analysis of the two-year condensedincome statements of Quality Department Store Inc. for the years 2007 and 2006.Horizontal analysis of the income statements shows the following changes: Net sales increased 260,000, or 14.2% ( 260,000 1,837,000).Cost of goods sold increased 141,000, or 12.4% ( 141,000 1,140,000).Total operating expenses increased 37,000, or 11.6% ( 37,000 320,000).Overall, gross profit and net income were up substantially. Gross profit increased17.1%, and net income, 26.5%. Quality’s profit trend appears favorable.679
JWCL165 c14 674-725.qxd6808/16/097:46 AMPage 680Chapter 14 Financial Statement AnalysisIllustration 14-6Horizontal analysis ofincome statementsQUALITY DEPARTMENT STORE INC.Condensed Income StatementsFor the Years Ended December 31Increase or (Decrease)during 200720072006AmountPercent 2,195,00098,000 1,960,000123,000 235,000(25,000)12.0%(20.3%)2,097,00
Horizontal analysis, also called trend analysis, is a technique for evaluat- ing a series of financial statement data over a period of time.Its purpose is to determine