Transcription
Silicon Valley High-Tech EmploymentCrash and reboot: Silicon Valley hightech employment and wages, 2000–08On the whole, high-tech industries in Silicon Valley declinedsharply in employment and wages from 2000 to 2004 but increasedgradually in both respects from 2004 to 2008; though the industrymix changed during the 8-year period, Silicon Valley remainsthe world’s leading high-tech hubAmar MannandTian LuoAmar Mann is a regionaleconomist and Tian Luois an economist, bothat the Bureau of LaborStatistics’ West RegionalOffice for Economic Analysis and Information inSan Francisco, California.E-mail: mann.amar@bls.gov or luo.tian@bls.govSilicon Valley is the largest and most influential high-tech center in the worldand leads all other metropolitan regions in the United States in the breadth andscope of economic activity it creates throughtechnological innovation.1 Since the 1960s,when technology firms that were engagedin semiconductor manufacturing, computerdesign, and computer programming andservices began to symbiotically cluster inthe southern portion of the San FranciscoBay Area, Silicon Valley has become themost famous high-tech industrial clusterin the world. The network of people, firms,universities and research institutions, andgovernment agencies has provided an idealhabitat for high-tech firms to be born and togrow; the products of these high-tech firmshave improved business processes and models, generated economic growth, and improved standards of living around the globe.2This article examines trends in SiliconValley high-tech employment and wagesduring the 2000-to-2008 period, which encompasses the peak of the dot-com era, theensuing dot-com bust, and a resurgence ofhigh tech. It also discusses the factors affecting the decline and growth of specificSilicon Valley high-tech industries, such asincreased global and domestic competitionand higher demand from health-care indus-tries. Next, the analysis examines trends inhigh-tech wage distribution and generation.The performance of high-tech industries inSilicon Valley is compared with the performance of those in the rest of the Nation.Finally, the analysis assesses the extent towhich the clustering or geographic concentration of Silicon Valley high-tech industrieshas increased or decreased over the 8 yearssince the peak of high-tech industry performance.The word “silicon” in the term “SiliconValley” refers to the key ingredient of semiconductors, which formed the technicalbasis for the computer-based high-technology economic climate that appeared andgrew in strength in and around San Jose,California, in Santa Clara County. Thisarea attracted venture capitalists, computertechnologists, and entrepreneurs, resultingin a regional agglomeration of high-techindustries that spread into neighboringBay Area counties (specifically, Alameda,Contra Costa, San Francisco, San Mateo,and Santa Cruz). These industries have madeSilicon Valley synonymous with dynamic,technology-driven growth and created alarge and diverse base of high-paying jobsacross the region. (See map 1.) Silicon Valley continues to be at the cutting edge of innovation. According to the U.S. Patent andMonthly Labor Review January 201059
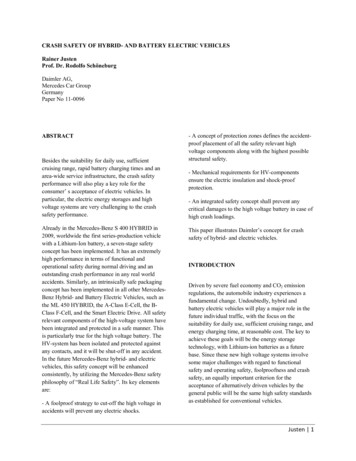
Silicon Valley High-Tech Employmentstock prices and in entire stockmarkets, such as the NASDAQ, onwhich many high-tech corporations are listed, and created the“dot-com bubble.”5 On March10, 2000, the NASDAQ reacheda peak of 5,132.52. As the enormous gap between valuation andperformance became apparent,Internet stocks collapsed, withSilicon Valley at ground zero ofthe crash.6 By December 2000,the NASDAQ had dropped bymore than 50 percent and stoodbelow 2,500. After the dot-combubble burst, Silicon Valley underwent a transformation. Reeling from massive hits to marketcapitalizations, many high-techfirms trimmed jobs or went outof business entirely. Others leftthe area and set up offices in lessexpensive locales.7From 2000, when high-techemployment and wages peaked,to 2008, Silicon Valley’s hightech industries lost more than108,400 jobs, or 19.9 percent oftheir employment.8 High-techindustries in the rest of the Nation lost 6.2 percent of employment. In addition, real wages fellby 13.5 percent among SiliconValley’s high-tech industries,while high-tech wages grew by1.3 percent in the rest of the Nation. The loss in employment andreal wages in Silicon Valley, however, was not the result ofa continuous decline. The 2000-to-2008 period is markedby two distinct phases. During the first phase—2000 to2004, a period during which the crash of dot-com stocksoccurred—real wages and high-tech employment declined precipitously. The decline in high-tech employmentlasted for 4 consecutive years and erased nearly a decadeof growth. High-tech employment declined in the rest ofthe Nation as well, but losses were more acute in SiliconValley, where jobs disappeared at a faster rate. During thenext phase, 2004 to 2008, most of Silicon Valley’s hightech industries “rebooted” and experienced a modest expansion in employment and wages. Manufacturing indus-MAP 1. Distribution of high-tech employment in Silicon Valley, by county, 2008San FranciscoContra Costa5.0%9.3%San Mateo13.6%Alameda16.4%San JoseSanta Clara54.8%Santa Cruz1.0%Trademark Office, in 2008, 11 of the 20 U.S. cities withthe most registered patents were in Silicon Valley.3From the mid-1990s to 2000, Silicon Valley’s new Internet sector, along with its related high-tech industries,rapidly grew, due in large part to widely available venture capital. The amount of venture capital pumped intoSilicon Valley between 1995 and 2000 was about 65billion, nearly one-third of total national venture capitalinvestment during the period. The capital that came intoSilicon Valley created a new wave of growth there.4 Approximately 172,000 high-tech jobs were created duringthis 5-year period. The infusion of venture capital andspeculation in stocks led to huge runups in individual60Monthly Labor Review January 2010
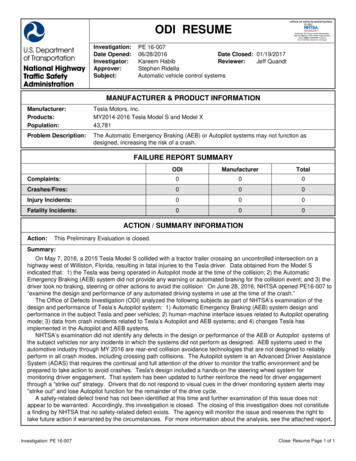
tries, which had been decimated following the dot-comcrash, saw employment levels finally stabilize; however,Silicon Valley high-tech employment did not recover tothe peak level reached in 2000. (See chart 1.)Using employment and wage data drawn from the database of the Bureau of Labor Statistics’ Quarterly Censusof Employment and Wages program, this article examinesemployment and wage trends in the Silicon Valley hightech sector from 2000 to 2008, dividing the data into thetwo periods mentioned earlier. Average annual employment data are computed, and average annual wages arecalculated by dividing total annual wages by employment. Real wages are used throughout the wage analysisand benchmarked to 2000 dollars by deflating nominalwages with the San Francisco-San Jose-Oakland averageConsumer Price Index. The periods covered include therecession beginning in March of 2001 and ending in November 2001, as well as some of the most recent recession,which started in December 2007.For this article, 11 “industries” have been identified as“high tech” through the use of the 2007 North AmericanIndustry Classification System (NAICS)9 codes. (The word“industry” is used in a general sense here, because theindustries that were analyzed vary with regard to theChart 1.number of digits they are assigned under NAICS.) Anindustry is considered high tech if “technology-orientedworkers” within the industry, as identified by occupationalstaffing patterns, account for 25 percent or more of totaljobs within the selected industry.10 Because of revisionsmade to some of the NAICS codes for the 2007 version ofNAICS, employees in the three subsectors of Internet services, telecommunications, and data processing, hosting,and related services have been aggregated under one industrial classification for this article. The employment andwage data reported in this article cover all sectors of theeconomy, sectors which comprise Federal, State, and localgovernments, and private organizations. Statistics on totalwages generated are in nominal dollars, and statistics onaverage annual wages are indexed to the year 2000.After the dot-com crash: 2000–04Silicon Valley high-tech employment. Following the crashof dot-com stocks in 2000, Silicon Valley’s landscapeof technology and its economic future were drasticallyaltered. Despite such a massive hit to the market capitalizations and financial projections of high-tech firms,employment in Silicon Valley was stalwart through theIndex of Silicon Valley high-tech employment, non-Silicon Valley high-tech employment, and totalnational employment, 2000–08Index(base year 2000)Index(base year 2000)1101101051051001009595909085858080Total national employmentNon-Silicon Valley high techSilicon Valley high nthly Labor Review January 201061
Silicon Valley High-Tech Employment–end of 2000 and into the early part of 2001. In SantaClara County, the heart of Silicon Valley, the unemployment rate stood at 2.4 percent in December 2000.Then, the aftershocks of the stock market crash—combined with the onset of economic recession and greatlyreduced venture capital financing—resulted in a suddencontraction of the Silicon Valley economy; by late 2001Silicon Valley had entered into a deep recession.11 Businesses, which had accelerated spending in preparation forthe Y2K switchover, found themselves with almost all theequipment they needed for some time. As orders for newtechnology and computing equipment fell, demand forprogramming and services also waned.12 As a result of allthese factors, as well as increased foreign and domesticcompetition, Santa Clara County’s unemployment ratejumped to 7.0 percent by December 2001. Some hightech companies responded by relocating certain phases ofproduction or moving out of Silicon Valley altogether toareas with lower commercial rents and housing costs. Thefuture of Silicon Valley as a crucible of innovation appeared in doubt.13The downturn in employment for Silicon Valley hightech lasted from late 2001 through 2004. High tech’sshare of total Silicon Valley employment dropped fromChart 2.17.2 percent in 2000 to 14.4 percent in 2004. During this4-year period about 140,400 jobs were lost in high-techindustries in Silicon Valley, a decline of 25.8 percent.About 60 percent of the job losses occurred in 2002, after the national recession had ended. (See chart 2.) Inaddition, many of the job losses occurred not only in theInternet startups that were associated with the dot-comcrash, but in the long-established, bedrock high-tech industry groups of computer and peripheral equipmentmanufacturing (henceforth referred to simply as “computer manufacturing”), and semiconductor and other electronic component manufacturing (hereafter referred to as“semiconductor manufacturing”). While not as severe asthe losses in Silicon Valley, the decline in employment inhigh-tech industries was 13.0 percent in the rest of theNation during the 2000-to-2004 period; as was the case inSilicon Valley, elsewhere in the country the majority of joblosses occurred in 2002.Silicon Valley high-tech wages. Average annual wagesin Silicon Valley’s high-tech sector fell sharply alongwith employment following the dot-com crash.14 Afteradjustment for inflation, average annual wages in SiliconValley high-tech industries dropped by 15.8 percent (fromSilicon Valley high-tech employment, 00200,000100,000100,000002000622001Monthly Labor Review January 20102002200320042005200620072008
120,064 to 101,057) from 2000 to 2004.15 OutsideSilicon Valley, the drop in average annual wages in hightech industries was far more subdued: the decline was only1.2 percent. (See table 1.) This difference—15.8 percentcompared with 1.2 percent—greatly reduced the wagedifferential between high-tech workers in Silicon Valleyand those in the rest of the Nation. In 2004, average annualwages for high-tech workers in Silicon Valley were 60.5percent higher than for those outside the Valley. Thoughstill a considerable gap, this was markedly less than the gapof 88.4 percent in 2000.The combination of lower average wages and lower employment levels in high-tech industries in Silicon Valley resulted in lower total wages. During the year 2000,high-tech industries in Silicon Valley generated 65.4billion in wages—1.4 percent of total wages earned inthe country and 12.8 percent of all high-tech wages inthe Nation. High-tech industries accounted for 34.5percent of all wages paid in Silicon Valley in 2000. From2000 to 2004, wages paid in high-tech industries in Silicon Valley fell by 31.1 percent—in nominal terms—to 45.0 billion. As a result, the share of total national wages emanating from Silicon Valley high tech decreased to0.9 percent and Silicon Valley’s share of total high-techwages fell below 10 percent by 2004. The share of SiliconValley wages that was produced by high-tech industriesfell to 26.9 percent. Just as average annual wages for hightech declined at a slower rate outside Silicon Valley, totalwages for high tech in the rest of the Nation declinedat a more restrained rate—5.6 percent—than did totalwages for high tech in Silicon Valley.The relatively larger declines in Silicon Valley’s average annual high-tech wages and total high-tech wagescan be explained by the Valley’s larger share of employment in computer and semiconductor manufacturing,which experienced large declines following 2000. Incomparison with Silicon Valley, the rest of the Nationhad a much greater share of workers in the comparativelystable architectural, engineering, and related services industry group (henceforth referred to simply as “architecture and engineering”).Silicon Valley reboots: 2004–08Silicon Valley high-tech employment. After 2004, hightech employment in Silicon Valley experienced 4 yearsof steady, continuous growth. The stable growth acrossmost high-tech industries during this period stands instark contrast to the boom and bust in high tech in theyears preceding and following the 2000 peak. (See chart2.) The rebooting of Silicon Valley following 2004 wasdriven by several factors. Despite absorbing a loss ofmore than 140,000 jobs since 2000, the region held onto much of its core talent and industry strengths.16 From2004 to 2007, technology companies benefited from agenerally strong economy. Robust consumer spending,coupled with increased business investment in new technology, also helped to boost high-tech employment.17 Inaddition, venture capital financing, which had decreasedsubstantially from 2000 to 2003, increased, though notnearly to the peak level seen in 2000. (See chart 3.) Someof this new financing went towards a new breed of Internet startups, which spurred the evolution of Web 2.0.18Another factor that buoyed employment after 2004 wasthe demand for products from nascent industries likebiotechnology, nanotechnology, and clean or green technology.19Employment in Silicon Valley’s high-tech sector expanded by more than 31,900 jobs, or 7.9 percent, between 2004 and 2008. This growth rate was nearly identical to that of high-tech employment outside of SiliconValley during these 4 years. (See table 2.) The share oftotal Silicon Valley jobs accounted for by employment inhigh-tech industries grew slightly, from 14.4 percent in2004 to 14.8 percent in 2008. Although the increase inemployment was more subdued than during the dot-comboom, Silicon Valley firms experienced strong growthin sales, revenues, and profits. Between 2003 and 2004,profits rose by 170 percent for the largest 150 companies in Silicon Valley; the next year, 2005, saw profitsgrow by 18 percent for the largest 150 companies.20These increases in profitability, though, did not translate into vigorous job growth. During the 2000-to-2004Table 1. Wages in Silicon Valley high tech, non-Silicon Valley high tech, and the United States as a whole; 2000, 2004, and 2008Area and industrySilicon Valley high tech.Non-Silicon Valley high tech.United States (all sectors).Real average annual wages(in year 2000 7935,874103,85064,53936,438Percent otal nominal wages(in billions of .656.0528.16,141.8Percent 0.7Monthly Labor Review January 201063
Silicon Valley High-Tech EmploymentChart 3.Venture capital investments in Silicon Valley, 1995–2008Venture capital(in billions ofdollars)Venture capital(in billions ofdollars) 35 200120022003 20042005200620072008SOURCE: MoneyTree Report, PricewaterhouseCoopers and the National Venture Capital Associationperiod, companies learned to get by with fewer workers by increasing productivity through automation or byoutsourcing functions to cut costs. Beginning in 2004,when the employment level of high-tech companies inSilicon Valley started to creep up again, employers putoff hiring full-time workers until absolutely needed andfavored higher skilled workers in the areas of researchand innovation.21 Mergers and consolidation activityalso dampened employment growth during the 2004to-2008 period and knocked many company names offthe list of Silicon Valley’s largest 150 companies.22 Thecombination of productivity gains, job cuts from mergers, and the high cost of living in the region caused manySilicon Valley high-tech companies to focus their expansion efforts on other parts of the country.23 It is noted,however, that the employment growth figures for SiliconValley during the 2004-to-2008 period may be understated because they do not include self-employed contractors or consultants.24Silicon Valley high-tech wages. Like high-tech employment in Silicon Valley, average annual wages in nearly allof Silicon Valley’s high-tech industries experienced growth64Monthly Labor Review January 2010during the 2004-to-2008 period. Real wages grew by 2.8percent (from 101,057 to 103,850).25 Outside SiliconValley, real average annual wages in high tech increased by2.5 percent. (See table 1.) Already paid considerably morethan high-tech workers in the rest of the Nation, SiliconValley workers saw a widening in the difference betweentheir wages and those in the rest of the Nation. By 2008,Silicon Valley high-tech workers were earning, on average,60.9 percent more than non-Valley high-tech workers.The slightly larger average wage growth in Silicon Valleycan be explained partly by the lower rate of inflationexperienced in the area during the 2004-to-2008 period.Also, many of the new jobs created after 2004 were highskill jobs and jobs in industries with higher wages. Inaddition, stock options are included in the calculationof wages, and the period following 2004 was marked bystrong gains for technology stocks.During 2008, high-tech industries in Silicon Valleygenerated 56.0 billion in nominal wages. Although thisrepresents a 24.4-percent increase in comparison withthe 2004 level, the shares of both total national wages(0.9 percent) and national high-tech wages (9.6 percent)accounted for by Silicon Valley’s high-tech industries
Table 2. Employment in Silicon Valley high tech, non-Silicon Valley high tech, and the United States as a whole; 2000, 2004, and 2008Area and industrySilicon Valley high tech.Non-Silicon Valley high tech.United States (all sectors).EmploymentNet changePercent re similar to the shares accounted for in 2004. Like total nominal high-tech wages in Silicon Valley, total nominal wages for high tech in rest of the Nation grew during the 2004-to-2008 period, expanding by 25.9 percent.Within Silicon Valley, high-tech industries accountedfor 27.4 percent of total wages paid in 2008 comparedwith 26.9 percent in 2004.Analysis of specific high-tech industriesIndustry employment. To more clearly delineate thefactors driving the changes observed in aggregate Silicon Valley high-tech employment, specific high-techindustries are analyzed for the 2000-to-2008 period.In general, goods-producing and service-providing industries displayed different patterns of growth. Duringthe 2000-to-2004 period, both goods-producing andservice-providing industries in Silicon Valley experienced steep employment declines: 29.3 percent and 23.2percent, respectively. During the following 4 years, whenaggregate high-tech employment in Silicon Valley recovered, goods-producing industries grew by only 0.2percent while industries in services added 13.1 percentto their jobs base. This shift away from goods-producinghigh-tech employment towards service-providing hightech employment mirrors the trend seen in high-techoutside of Silicon Valley as well as in the overall nationaleconomy.All high-tech industries had significant representationin Silicon Valley throughout the 2000-to-2008 timeframe. In 2008, the level of employment ranged from99,199 jobs in the computer systems design and relatedservices industry group (henceforth referred to simply asthe “computer systems design” industry group) to 9,053jobs in the aerospace product and parts manufacturing industry group (hereafter referred to as the “aerospace” industry group). Although 9 of the 11 industriesanalyzed experienced employment declines, 2 industrygroups—scientific research and development services(hereafter referred to as “scientific research”), and pharmaceutical and medicine manufacturing (henceforth referred to as “pharmaceuticals”)—exhibited employment2004–087.97.84.3growth from 2000 to 2008. During this period, overallSilicon Valley high-tech employment fell by around110,000 jobs to just under 436,000 jobs.The interrelated industry groups of scientific researchand pharmaceuticals were the only industries to experience job growth during both the 2000–04 period andthe 2004–08 period. These industry groups added morethan 2,700 jobs combined in the first 4 years analyzedand more than 6,400 jobs in the last 4 years analyzed.During both periods, employment growth in scientificresearch in Silicon Valley lagged behind the industrygroup’s employment growth in the rest of the Nation,while employment growth in pharmaceuticals in Silicon Valley outperformed pharmaceuticals’ employmentgrowth in the rest of the country. (See table 3.) Biotechnology firms, which fall primarily under scientific research, benefited from a substantial increase in venturecapital and government support in the earlier part of thedecade.26 In addition, biotechnology has been crucial inthe development of medicines, which have fueled growthin the pharmaceutical industry.27 Demand for both newdrugs and new medical devices boosted medical and biotechnological research throughout the 8-year period.28The scientific research industry group includes not onlyresearch in the broad field of biotechnology, but alsonanotechnology and green or clean technology. A separate analysis of green jobs estimates a 23-percent rise inSilicon Valley green jobs from 2005 to 2008.29Four of the industries analyzed declined during the2000–04 period but experienced job growth in the 2004–08 period: the computer systems design industry group;the cluster of the three subsectors of Internet services,telecommunications, and data processing, hosting andrelated services (hereafter, this third subsector is referredto as “data processing”); the architecture and engineeringindustry group; and the computer manufacturing industry group. Employment in all of these industries, apartfrom architecture and engineering, fell at a higher ratelocally than in the rest of the Nation during the first 4years; however, these industries also recovered at a fasterrate in Silicon Valley during the second 4-year period.With the exception of architecture and engineering,Monthly Labor Review January 201065
Silicon Valley High-Tech EmploymentTable 3. Employment by industry in Silicon Valley and the rest of the Nation; 2000, 2004, and 2008IndustryAll industries.High tech.Computer systems design and related servicesSemiconductor and electronic componentmanufacturing.Internet services, telecommunications, and dataprocessing, hosting, and related services.Computer and peripheral equipmentmanufacturing.Architecture and engineering services.Scientific research and development services.Electronic instrument manufacturing.Software publishers.Communications equipment manufacturing.Pharmaceutical and medicine manufacturing.Aerospace product and parts manufacturing.Employment in Silicon ValleyMonthly Labor Review January 2010Percent change,Silicon ValleyPercent change,Non–Silicon 13.7.015.1employment in every high-tech industry moved in thesame direction—positively or negatively—in SiliconValley as in the rest of the Nation between 2000 and2004. The engineering services part of this industrygroup accounted for nearly two out of every three jobsit lost during this time. During the 2004–08 period, employment in architecture and engineering grew by 10.4percent in Silicon Valley and by 13.8 percent in the restof the Nation.Computer systems design, which employed the largest number of employees in Silicon Valley throughoutthe period used for analysis, lost nearly 30,000 jobs from2000 to 2004. This industry group provides computersystems design, expertise, and support not only for hightech companies but for a broad range of professional andbusiness-related industries. Employment in this industrywas affected by the 2001 economic recession, which resulted in reduced businesses investment in informationtechnology and the increased migration of system designemployees and firms out of the area. In recent years, asbusinesses have increased their reliance on computer andinformation technology, they have turned to firms in thecomputer systems design industry group to meet theirspecialized needs.30The cluster of Internet services, telecommunications,and data processing experienced heavy job losses in boththe telecommunications and Internet segments becauseof increased consolidation in the telecommunicationsindustry and the failure of many Internet startups following the dot-com bust. Between 2004 and 2008, joblosses in telecommunications began to subside, whileInternet companies and web-search portals grew. Em66Net change2004–08ployment growth in the Internet services subsector wasdriven by a new breed of startups, which created manyof the innovations in web 2.0 technology. In addition,many Internet companies benefited from venture capitalfinancing.31The two bellwether industry groups within high-techmanufacturing in Silicon Valley—computer manufacturing and semiconductor manufacturing—both were hithard by job losses in the 2000-to-2004 period becauseof a substantial weakening in demand coupled with anincrease in imports.32 These two complementary industry groups together accounted for more than 50,000 jobslost during that time. A different pattern emerged during the 2004–08 period: computer manufacturing addednearly 5,000 jobs in the local economy, while outsideof the area it continued to lose jobs; in contrast, semiconductor manufacturing continued to lose jobs both inSilicon Valley and in the rest of the country, primarilybecause of increased foreign competition.33In addition to semiconductor manufacturing, fourother industry groups lost jobs in both the earlier andlatter 4-year periods. Three of these industry groupswere in the high-tech manufacturing arena—communications equipment manufacturing; navigational,measuring, electromedical, and control instrumentsmanufacturing (hereafter referred to as “electronic instrument manufacturing”); and aerospace. Because ofthe precision involved in the manufacturing process,communications equipment and electronic instrumentmanufacturing have become highly automated in recentyears.34 The employment decline in communicationsequipment manufacturing was much less pronounced in
Silicon Valley than in the rest of the Nation during the2004-to-2008 period; meanwhile, electronic instrumentmanufacturing grew in the rest of the Nation but fellby nearly 10 percent in the local area. Aerospace, whichis the smallest high-tech industry in Silicon Valley interms of employment, experienced a modest 1.5-percent decline during the 2000-to-2004 period. Duringthis timespan, the aerospace industry group was undergoing a period of consolidation and contraction in therest of the Nation, which resulted in a 14.8-percent national
Th e downturn in employment for Silicon Valley high tech lasted from late 2001 through 2004. High tech's share of total Silicon Valley employment dropped from 17.2 percent in 2000 to 14.4 percent in 2004. Dur ing this 4-year period about 140,400 jobs were lost in high-tech industries in Silicon Valley, a decline of 25.8 percent.