Transcription
Crash ManagementStrategy 2015-2017City of SydneyTown Hall House456 Kent StreetSydney NSW 2000Strategy and Assets Group - Fleet ServicesFebruary 2015
Version ControlLen Woodman – Driver Development OfficerChris Binns – Manager Strategy and AssetsAuthors:Document Commencement: 15 October 2014VersionPurposeContent ChangeIssue Date1.02.0Initial consultationUnit Managers ConsultationNil – initial draft Add version control table New cover photos Add driver evaluation process and form Add driver performance rating system Clarify zero tolerance to drugs and alcohol Reference to prescription drugs30-12-201431-12-20143.0Final draft Amended structure – present, past, future13-01-20154.0Final for Lumley’s review A3 summary document to communicateDisciplinary action aligned with MV PolicyAdditional objective for leadership capability06-02-20155.0Final for Director endorsement Minor amendments and clarification asrecommended by the City’s insurer23-02-2015EndorsedGarry HardingDirector City Operations2SignatureDate9/3/15Fleet Services – Crash Management Strategy – 2015-2017
ContentsContext. 5Objectives . 6Sydney 2030 - Connecting Our City . 6The City’s Values and Low-risk Driving . 6Crash Statistics – (current state) . 7Crash Frequency . 7Crash Mode . 7Crash Cost . 8Crash Fault . 8Accident Management Strategy 2010 – (past actions) . 10High Risk Business Units . 10Issues, outcomes and interventions . 11Zero-crash culture – (future state) . 13Fleet Management Strategy 2014-2016 . 13Benchmarking . 13Research, evaluation and implementation of systems to reduce crashes . 14Keywatcher system . 14Daily vehicle condition reports . 14Low-risk and Eco-driving Handbook . 15On-line low-risk driving refreshers . 15Communication . 15Driver evaluation . 16Driver coaching . 16Driver performance ratings. 16Recruitment of new drivers . 16Induction of new drivers . 16Driver competencies . 17Drivers’ licence checks. 17Safe System approach . 17Crash definition . 18Disciplinary and counselling procedure . 19Personal counselling . 19Returning driver procedure . 20Policy and Procedure . 21ISO 39001 – Road Traffic Safety Management . 21Crash Reduction Action Plan 2015 . 22Appendix 1 – Vehicle Inspection/Condition Report . 24Appendix 2 - Driver Evaluation Report . 25Appendix 3 - Driver Coaching Plans . 27Appendix 4 - Competencies required to drive for work . 28Appendix 5 – ISO 39001 – Road Traffic Safety Management . 29References . 303Fleet Services – Crash Management Strategy – 2015-2017
Was it an accident or a crash?Accidents occur by chance and circumstance. Nobody was at fault and acrash could not have been avoided. They are very rare.Crashes occur because at least one road user has done something wrong orunexpected, either through a mistake, lack of skill or lack of attention. They arevery common.Accountability for a crash questions what could have been done to prevent it.4Fleet Services – Crash Management Strategy – 2015-2017
ContextThe City of Sydney has over 187,000 residents, 7,000 people per km2, so great demands are placedon physical infrastructure and services. The vast majority of services are provided using some typeof motor vehicle or plant.The City also has a unique network of roads including high speed arterial roads, collector roads andaccess roads. Some areas have quiet residential streets whilst others have high density narrow,congested roads. With congestion and high numbers of parked cars, pedestrians and cyclists, thechallenge facing our drivers is complex and considerable. Regardless, the costs and productivityloss associated with driver-at-fault accidents is unacceptable and must be reduced.Our unique driving environment requires all drivers to demonstrate high standards of professionallow-risk driving when undertaking their daily work tasks.Regardless of our job, as soon as we take control of aCity of Sydney vehicle, in the eyes of our customers, we areseen as professional drivers.We must display an exemplary standard of driving ability.5Fleet Services – Crash Management Strategy – 2015-2017
ObjectivesThe six key objectives of the Fleet Services Crash Management Strategy are to; Promote and embed a zero-crash culture; Support and improve driver skills, behaviours and awareness; Develop staff pride in driving professionally; Enhance leadership capability in Supervisors and Team Leaders; Identify the root causes and contributing factors that result in vehicle crashes; and Guide business units with strategies and processes to minimise vehicle crashes.Sydney 2030 - Connecting Our CityThe City’s Transport Strategy and Action Plan, Connecting Our City, is the overarching documentthat outlines the targets for transport within the City. The two requirements relating to road safety asan organisation are ensuring safety on the City’s streets and roads for all residents and visitors; andensuring the safety of staff.The City’s key road safety target is:‘That by 2030 the level of road trauma in the City of Sydney shouldbe half of the 2012 number of people injured on the City’s roads. This means 512 orfewer casualties’.As a major fleet operator within the LGA the City itself has a responsibility to contribute to thisstrategic target.The City’s Values and Low-risk DrivingThe City of Sydney’s values are ideally suited to the principles of low-risk driving and give us goodreasons to drive well:Collaboration – we work together to create a low-risk driving environment.Courage – we accept our current limitations as drivers and strive to improve our low-risk driving.Integrity – we take responsibility for our driving and learn from our mistakes, not blaming others.Innovation – we invest in learning and share our knowledge to improve driver performance.Quality – we set an example to others as professional low-risk drivers.Respect – we must show consideration towards all other road users at all times.6Fleet Services – Crash Management Strategy – 2015-2017
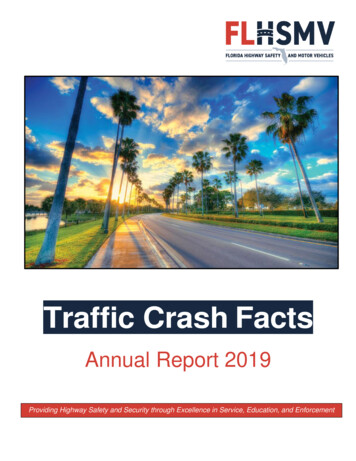
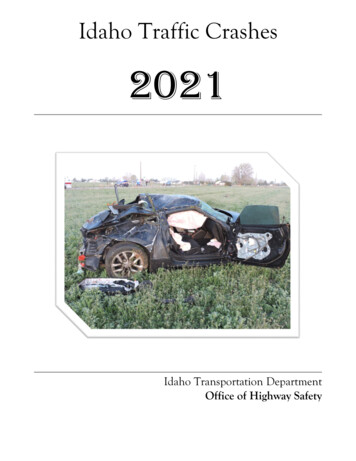
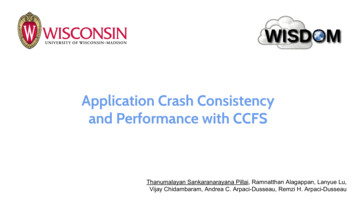
Crash Statistics – (current state)Crash Frequency1,628 crashes involving City of Sydney vehicles were recorded between 1 April 2009 and 31 March2014. Although declining in frequency since 2009/10, many of these crashes were preventable.Crashes involving City of Sydney vehicles380360Number of 1-20122012-20132013-2014373316283339317Crash ModeThe majority of crashed were whilst travelling in forward motion, however one-fifth of crashesoccurred whilst reversing at low speed.Crashes by by vehicle rReversingRightOfWay2013-2014Fleet Services – Crash Management Strategy – 2015-2017
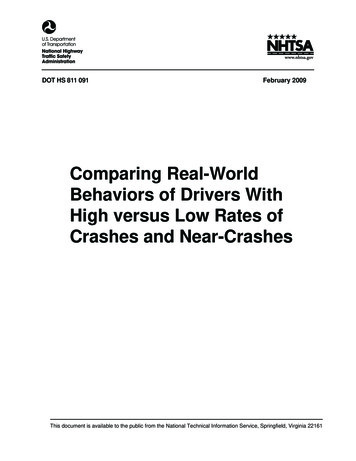
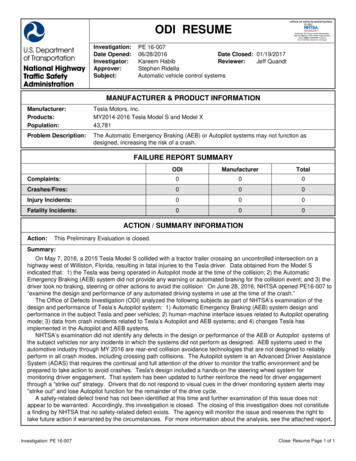
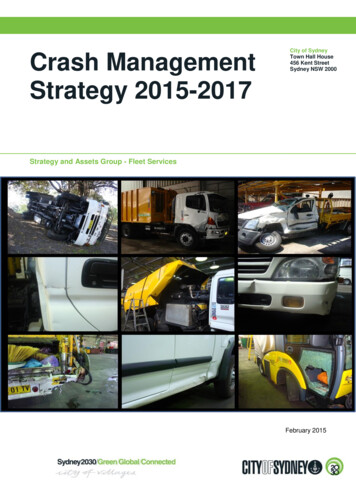
Crash CostThe insurance claims resulting from these crashes totalled 2,727,506.86, an average of 1,675 percrash.Cost of claims as a result of vehicle crashes 650,000 600,000 550,000 500,000 450,000 14Some important factors must be considered; There has been a downward trend in all crashes occurring within the City of Sydney LocalGovernment Area (LGA) over the past ten years;The cost of crashes will vary in line with CPI and the value of the Australian dollar;Greater demands will be placed on the provision of services as the City’s population grows;There will be changes to the traffic structure across the LGA as public transport andsustainable transport, such as cycling, increases in step with new developments, includingGreen Square, Barangaroo and Harold Park.The introduction of the Fleet Accident Management Strategy in February 2010 brought about anoticeable reduction in crashes involving City drivers. However, an increase in the number ofcrashes and especially the costs incurred was evident during the period 2012 to 2013. The period2013 to 2014 does indicate a drop in crashes, but the costs have still risen. This means that there isa continual need for attention to crash reduction, both in number and severity.Council loses in excess of 600,000 each year due to motor vehicle crashes. A targeted program ofpolicy review, data analysis and driver skills assessment will seek to reduce such losses and refineexisting reporting processes and detection systems.The review and implementation of the fleet Crash Management Strategy 2014 and activeinvolvement in developing a Zero-crash Culture aims to further minimise Council’s commercial andsafety risk exposure.Crash FaultA decline in the number of ‘client vehicle only’ incidents since 2011-2012 is evident, which is apositive step. However since 2011-2012 there has been a dramatic increase in crashes where‘driver-at-fault’ is recorded. This reflects driver skill levels and/or behaviours.8Fleet Services – Crash Management Strategy – 2015-2017
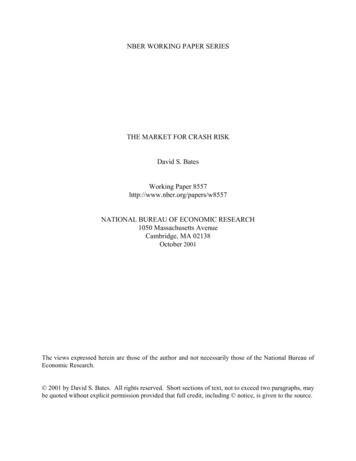
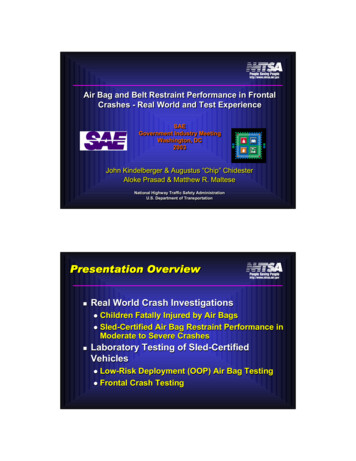
Crash data is captured and reported by ‘who is at fault?’ and is broken down into; Driver at fault (our driver error in colliding with another vehicle); Client vehicle only (our driver error in colliding with other than a vehicle); Third party at fault (another driver’s error in hitting our vehicle); or Unknown third party at fault (our vehicle damaged by persons or incidents unknown).Crashes by fault 2010 - 20141009080706050403020100Client Vehicle OnlyDriver at Fault2010-20112011-2012TP at Fault2012-2013Unknown TP at Fault2013-2014Many small crashes occur in congested city areas with dense traffic and tight parking. ‘Reversing’ isnoted as a key cause of many minor, yet costly incidents. Detailed claims data also confirms ‘atfault’ crashes are not incurred by a few drivers with repeat incidents, but by many drivers across theorganisation - a further indicator of general skills and organisation-wide driver awareness.Unknown ‘third party-at-fault-incidents’ are increasing and are mainly minor damage of less than 5,000. They are mainly reported as drive-off parking incidents or malicious damage/vandalism.‘Third party-at-fault’ crashes have not continued to increase and are not a significant cause ofcrashes.A number of factors have contributed to the increased frequency and cost of claims across allcause/fault categories in recent years.They include; Improved capture and reporting of all accident damage and centralised claims managementin recent years; Steadily increasing city traffic and parking congestion; Increased delivery of services and kilometres travelled (an extra 100,000 km per year) withgreater demands on drivers and crew; and Fleet vehicle numbers have not increased but the vehicles are more complex andspecialised, resulting in more expensive repair costs.Regardless, the increasing claims rate must be addressed to minimise financial exposure and toimprove workplace health and safety through improved driver skills and behaviours. This will alsoimprove our public image. Crash reduction is a key challenge for unit managers.9Fleet Services – Crash Management Strategy – 2015-2017
Accident Management Strategy 2010 – (past actions)The City’s first Accident Management Strategy was implemented in 2010 and although many of itsrecommendations have now been implemented, most of the causes and impacts of driver-at-faultcrashes continue today. The strategy comprised of four basic elements;1.Analysis of crash data to identify high risk business units;2.A series of unit-specific workshops to understand their operating environment. Workshopsincluded key management and supervisory staff capable of, and responsible for, effectingworkplace change;3.Documentation of workshop findings on causes (issues) and strategies (interventions);4.Implementation of an ongoing action plan to minimise and mitigate vehicle crashes.The project identified a need to consider crash management strategies which relate specifically tothe operations of individual business units. Each unit has its own culture and driving requirementsand can benefit from a tailored solution. Initial workshop findings by business unit have now beenreviewed and refreshed to account for changes in business and driving environments.High Risk Business UnitsCrashes by unit 2009-2014250200150100500City Infrastructureand TrafficOperationsCity Rangers2009-2010Cleansing & Waste Social Programs and Parks Trees &ServicesAquatic Facilities2010-20112011-20122012-2013Strategy Assets /THH Pool2013-2014Approximately 90 per cent of the crashes incurred in recent years have been within the CityOperations Division. This division is Council’s largest and deploys the use of more than 90 per centof the City’s diverse fleet in its daily operations. The Cleansing and Waste unit has 24 hour shifts,drives large specialised vehicles and covers significantly more distance and time on the road thanother units. Because of this, it is most exposed to risk.Crash numbers for car pool users at Town Hall House are also considerable and confirm the needfor improvement across all divisions. The highest crash frequencies were attributable to; Cleansing and Waste Services;City Rangers;City Infrastructure and Traffic Operations;Social Programs and Services; andCity Greening and Leisure.10Fleet Services – Crash Management Strategy – 2015-2017
In 2010 unit-specific crash data was presented to each high risk business unit in a series ofconsultative workshops and conveyed an understanding of their performance against industrybenchmarks. The workshops enabled ‘white-board’ capture of information on:a.The unit-specific operating conditions and driving environment that may contribute to thecause of accidents.b.Any unit-specific strategies that may mitigate the frequency and value of vehicle crashes andclaims.Issues, outcomes and interventionsEach unit workshop consulted staff on the accident causes specific to their operations and soughtintervention strategies to mitigate them.Cleansing and WasteIssueOutcomePoor driver attitude andbehaviour.Bad public image, lowrespect for vehicles andequipment, high crashrate.Driver skills & experience.Mix of vehicles (size).Over-familiarity of vehicles.Unfamiliarity with vehicles.Bad public image, highcrash rate, drivingoffencesTight streetsDamage to third partypropertyDedicated drivers, observers and mentoringTraffic congestionDelays and frustrationBetter training for new staff on equipment.In-vehicle GPS and traffic adviceOver and unfamiliarity ofstreets in LGAIncreased potential forcrashesDriver assessments.Tight depot parkingDamage to vehicles andequipment.Compliance with RoadRulesLow driving standardsBad public imageDriving offencesInterventionsRegular toolbox talksCounselling of poor performersDriver assessments and reportingPerformance reviewsRoad Rule and Low-risk driving awarenessAssessments for licence upgradingAnnual licence checksAll drivers hold minimum LR licenceTesting for all new driversLocal driver trainers and mentorsSystem for parking assistance and directionsUse of guides when reversing or in tight areasSpecific workshops on;o Fatigue awarenesso Pedestrian safetyo Cyclist safetyo Speed limits and signsDriver infringementsCity RangersIssueOutcomeFrequency of stop/startTime delaysPotential for crashesCrash riskTight Town Hall Houseparking and reversingMultiple minor damagecrashesVehicle sizeDriver difficulty drivinglarger vehiclesMalicious vehicle damageVehicles unserviceableInner city traffic conditions11InterventionsIn car driver assessment and trainingNavigation training on inductionReinforced requirements for legal parkingNew staff assessed on driving skills in inductiontrainingReversing lookout, additional staff to assistSelected driving staff with adequate skillsQuarterly licence checksCorrect & detailed reporting – on-lineDaily inspections – reportingFleet Services – Crash Management Strategy – 2015-2017
Social Programs and ServicesIssueOutcomeInterventionsLarge vehiclesTight streetsTraffic congestionPotential for crashesSource skilled driver pool from CommunityTransportLow skills – VolunteersLow skills - CasualsPotential for crashesRecruitment – testingDriver assessment and trainingFamiliarity with routesDrop off/pick up patternsTree & awning damageKerbside pull upsPotential for crashesAchievable scheduling & timetablingDriver assessment and trainingOutcomeInterventionsPotential for crashesRecruitment – training and testing.Driver assessment and training.Toolbox talksPotential for crashesLR/MR/HR – correct licensing for vehicle.Minimum LR licence for trucksQuarterly licence checksCity Greening and LeisureIssueParking within ParksTight street parkingNarrow streetsTowing trailersLarge vehiclesEveryone drives anythingDriver experience (largetrucks)Mirror width & viewTailgates swinging openUnnecessary damageand potential injuryWHS operating procedures & compliance.Face to face training - Compliance training.Minimum LR licence for all trucksCity Infrastructure and Traffic OperationsIssueOutcomeDriver behaviourDriver attitudeComplacencyDriver abilityBad public image, lowrespect for vehicles andequipment, high crashrate.Large trucksCar licence for small trucksPotential for crashesUnfamiliarity (streets &trucks)Narrow streetsTraffic in CBDMirror width & viewTailgate heightFogged mirrorsPotential for crashesTime delaysInterventionsRecruitment – training and testingDriver assessment and trainingPerformance reviewsInduction and Low-risk Driving Handbook.Key watcher accountabilityMinimum LR licence for all trucksDriver assessment and training.Recruitment – testing.Quarterly licence checks.In-vehicle GPS and traffic advice.Pool cars operating from Council facilitiesIssueOutcomeInterventionsParking crashesPoor public imageVehicle damageDriver assessment and trainingRoad user skillsPotential for crashesDriver infringementsInduction – Low risk driving HandbookDriver assessment and trainingBriefings at Unit meetings12Fleet Services – Crash Management Strategy – 2015-2017
Zero-crash culture – (future state)It has been demonstrated that by encouraging a zero-crash culture across an organisation,crashes can be reduced substantially (National Road Safety Partnership Program, NationalTransport Commission, June 2013).Implementing a safe system for fleet driving that promotesand embeds a zero-crash culture through safer people,safer vehicles and safer roads.It is a responsibility for all business unit managers, section managers, coordinators, supervisors andteam leaders to continue to implement and improve strategies to reduce crashes involving the City’sfleet vehicles.A raft of tools and strategies are available to support managers in establishing a zero-crash culturewithin their operations. They include:Fleet Management Strategy 2014-2016The City’s Fleet Management Strategy 2014-2016 exposes concern about the frequency andresponsibility for vehicle accidents and claims. It cross references this Crash Management Strategyand lists broad recommendations on strategic reviews, driver training, RMS self-assessment, therole of a ‘driver educator’, the City’s Low-risk and Eco-driving Handbook, corporate riskmanagement, WHS compliance and accident reporting. The strategy will continue to be reviewedon a two year cycle.BenchmarkingLumley Insurance provides fleet insurance services to many fleet operators across NSW includingthe City of Sydney. The table below compares Lumley Insurance state-wide benchmarks with theCity of Sydney actual statistics since arkDriver at fault37%34%42%44%15%Client vehicle only38%43%34%32%15%Third party at fault10%9%11%9%50%Unknown third party at fault12%11%11%12%10%Note: Tallied columns do not reach 100% due to pending claims and shared liability incidents.13Fleet Services – Crash Management Strategy – 2015-2017
Lumley Insurance’s data indicates that most fleet operators have significantly fewer driver-at-faultand client-only crashes, and a greater percentage of third party-at-fault crashes. Even consideringthe difficult conditions in which we operate our services, the City of Sydney is a long way behind thebenchmark for all at-fault categories, and is getting worse. Improvement is required.Fleet Services will continue to benchmark our crash data against other public and private fleetoperators and identify where improvements can be made.Research, evaluation and implementation of systems to reduce crashesTogether with Lumley Insurance, the City will; Research and analyse crash data; Identify causal and outcome trends; and Determine why crashes happen.Risk analysis systems will be investigated to determine the efficacy of their use and see how theycan influence behaviour and attitudinal change in drivers within achievable time frames.Research by AustRoads and the National Transport Commission into the use of best practiceprinciples in fleet crash management will be evaluated and practices implemented whereappropriate.Keywatcher systemThe Keywatcher vehicle access system is provided for all drivers of operational and pool vehicles ateach of the City’s main depots and administrative facilities. The system promotes driver and incidentaccountability by enabling identification of drivers and accurate times and patterns of vehicle use.Accountability for vehicle use and any crashes or incidents rests with the recorded driver. Access tovehicles in Keywatcher requires registration with Council’s Fleet Services section, including licencevalidation and a commitment to complying with the City’s vehicle policies and handbooks.Daily vehicle condition reportsAll drivers are required to check and report on their vehicles and plant for damage and defects priorto use. Supervisors at operational depots are required to sign-off all daily Vehicle Condition Reports(VCRs) for referral to Fleet Services should a problem arise. All supervisors and team leaders mustensure that their drivers do not drive un-roadworthy vehicles. All depot based operational trucks and plant must be checked daily prior to use as set out inthe WHS Plant and Equipment Procedure, the RMS Road Users Handbook and reported inline with City of Sydney VCR daily reporting form.(See Appendix 1 – VehicleInspection/Condition Report). Drivers of heavy vehicles (GVM greater than 4.5 Tonnes) must check their vehicles andloads to the same standard required for the Heavy Vehicle Driving Test and as detailed in theNSW Roads and Maritime Heavy Vehicle Driver Handbook. Fleet Services must be advised of any damage or defects as soon as possible after theincident and documentation must be completed immediately.Vehicle checking and reporting requirements will be a key topic in refresher and training content foroperational staff through 2015.14Fleet Services – Crash Management Strategy – 2015-2017
Low-risk and Eco-driving HandbookGood driving reduces the chances of causing a crash.Low-risk driving increases the chances of avoiding a crash.In 2008 the City contributed to the development of theSSROC ‘Safe Driving Handbook’. This handbook wascustomised to suit the City’s specific business needsand distributed to operational staff during the first halfof 2009. Road safety and fleet specialists developedthe ‘Safe driving wheel’ that identifies all therequirements to drive safely.Now referred to as the ‘Low-risk and Eco-drivingHandbook’ it been revised to reflect the latest strategiesin safe driving principles and now includes informationon driving a vehicle in an environmentally friendlymanner, as well as a low-risk manner.The ‘Low-risk and Eco-driving Handbook’ forms thebasis of our internal training programs. It drives thecontent for ongoing annual on-line or face-to-face‘Policy and Procedure’ training for all driving staff.All City of Sydney staff who drive a motor vehicle must read the Low-risk and Eco-drivingHandbook and the appropriate RMS handbooks.Drivers must declare that they have done so and are familiar with the City’s handbook and theappropriate RMS handbooks.On-line low-risk driving refreshersTo complement the Low-risk and Eco-driving Handbook there is an on-line knowledge test that alldrivers registered in the Keywatcher system are required to complete each year. Fleet Services willassist any driver who does not have access to a computer and those staff working with the heavyvehicle fleet.CommunicationTo effectively communicate and embed a zero-crash culture across the organisation, content andprograms
The review and implementation of the fleet Crash Management Strategy 2014 and active involvement in developing a Zero-crash Culture aims to further minimise Council's commercial and safety risk exposure. Crash Fault A decline in the number of 'client vehicle only' incidents since 2011-2012 is evident, which is a positive step.