Transcription
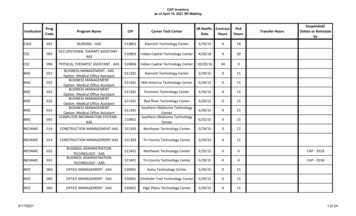
THE TECH INDUSTRY IN CALIFORNIA AND LOS ANGELESThe Tech Industry in Californiaand Los AngelesWilliam YuEconomist, UCLA Anderson ForecastSeptember 2018The tech industry is doing very well these days in theU.S. Over the past eight years, while the S&P 500 stockindex has increased by 154%, the NASDAQ index, whichconsists of about 50% of tech companies, has increased by275%. Many of the most valuable companies are tech companies, such as Apple, Amazon, Google, or Facebook. TechTable 1employees are compensated nicely due to this tech boom.For example, in 2017, while the annual median wage forall occupations was 37,700 in the U.S., it was 84,600 forthe computer occupations, second only to 102,600 of themanagement occupations as shown in Table 1.2017 Median and Mean Wages and Employment in Major Occupations in the U.S.CodeTitle11-0000 Management Occupations15-0000 Computer and Mathematical Occupations23-0000 Legal Occupations17-0000 Architecture and Engineering Occupations13-0000 Business and Financial Operations Occupations29-0000 Healthcare Practitioners and Technical Occupations19-0000 Life, Physical, and Social Science Occupations25-0000 Education, Training, and Library Occupations27-0000 Arts, Design, Entertainment, Sports, and Media Occupations47-0000 Construction and Extraction Occupations49-0000 Installation, Maintenance, and Repair Occupations21-0000 Community and Social Service Occupations33-0000 Protective Service OccupationsMedianMeanwage ( ) Wage ( 05,728,4605,528,3902,096,7403,408,68043-0000 Office and Administrative Support Occupations34,74037,95021,965,48053-0000 Transportation and Material Moving Occupations31,60037,0709,978,39051-0000 Production Occupations31-0000 Healthcare Support Occupations41-0000 Sales and Related Occupations37-0000 Building and Grounds Cleaning and Maintenance Occupations45-0000 Farming, Fishing, and Forestry Occupations39-0000 Personal Care and Service Occupations35-0000 Food Preparation and Serving Related Occupations00-0000 All 05,159,10013,193,090142,549,250Source: Occupational Employment StatisticsUCLA Anderson Forecast, September 2018California–59
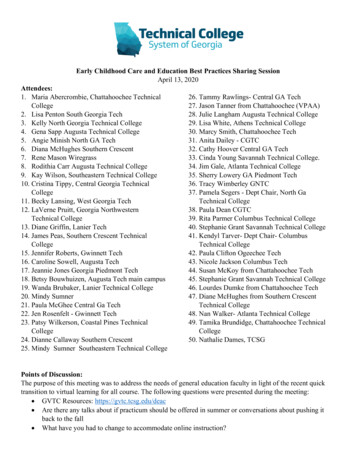
THE TECH INDUSTRY IN CALIFORNIA AND LOS ANGELESThe Tech Industry and Employment in SixCalifornia RegionsCalifornia is the center of high-tech and innovationin the world. Let’s take a closer look at how well the techindustry and tech employment are doing in its six majormetro regions. Note that there is no strict definition of ahigh-tech firm. To simplify the analysis, we use two ways toexamine the growth of the tech industry for the six regions.We use the major industry categories defined by NAICS(North American Industry Classification System) as the firstmethod. We assume the following three industries includetech industry employment: (1) Computer and electronicproduct manufacturing (NACIS: 334000) and the aerospaceproduct and parts manufacturing (NACIS: 336400) in thedurable manufacturing sector, (2) Information sector excluding publishing industries, and (3) Professional, scientific,and technical services sector.These three categories are not exclusively tech industrypositions, however. For instance, law, accounting, and architectural firms (professional, scientific, and technical services)Figure 1are not high-tech. It is difficult to distinguish those from thewhole category from monthly payroll data released by theCalifornia Employment Development Department. This iswhy we will introduce the second method with more refinedcategories to analyze the tech industry later on.Figure 1 shows the total jobs in the three categories weare using to get an idea of tech industry growth since 2002 forthe six regions: Los Angeles (County), Silicon Valley (SantaClara County), San Francisco (San Francisco, San Mateo andMarin Counties), Orange County, San Diego (County), andthe East Bay (Alameda and Contra Costa Counties). Withthe largest economy size (total jobs of 4,494,000) , L.A. hasthe largest tech workforce (446,000) followed by SiliconValley’s 346,000, and San Francisco’s 268,000 in July 2018.From Figure 1, we see that tech employment in allregions has recovered since 2010. Among them, two regionshave outstanding growth over the past 8 years: Silicon Valley and San Francisco. In particular for San Francisco, thecurrent tech job level has surpassed the peak (191,000) ofTech Jobs in 6 California Metros from 2002 to 2018500,000Los Angeles450,000400,000Silicon Valley350,000300,000San Francisco250,000San Diego200,000Orange County150,000100,000East Bay200220042006200820102012201420162018Source: California Employment Development Department1. L.A. has a prominent film and broadcasting industry. Therefore, when we calculate the tech jobs, we only assume 20% of employment are in thetech sector.60–CaliforniaUCLA Anderson Forecast, September 2018
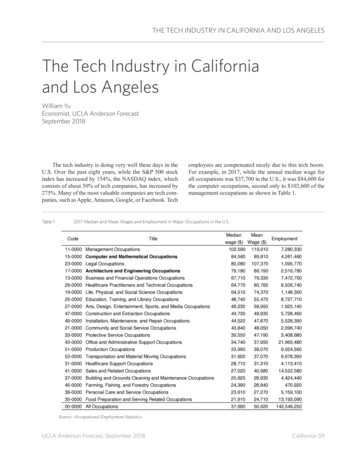
THE TECH INDUSTRY IN CALIFORNIA AND LOS ANGELESFigure 2Monthly Year-over-year Growth Rate of Tech Jobs in 6 California Metros from 2011 to 201816%San Francisco12%8%Silicon Valley4%0%San Diego-4%20112012East BayOrange CountyLos Angeles201320142015201620172018Sources: California Employment Development Departmentthe Internet bubble in November 2000. Figure 2 displays themonthly year-over-year growth rate of tech employment forthese 6 regions. Tech employment growth rates are higher inthe Bay area and San Diego than those in L.A. and OrangeCounty.A Closer Look at Tech Occupation in6 California RegionsNow, let’s use Occupational Employment Statistics toexamine the trend of tech jobs by a more precise method.As shown in Table 1, we suggest part of the positions inComputer and Mathematical Occupations and Architectureand Engineering Occupations belong to the core of the techindustry. Here we assume that the median wages shouldbe at least 77,000 in L.A. to qualify as a tech job givenits definition of high-skill and high-compensation. Table 2displays 23 positions we suggest as tech jobs, with medianwage ranging from 77,000 to 135,000.UCLA Anderson Forecast, September 2018With a more refined definition of tech, Figure 3 showsthe core tech workforce for the six California regions in 2010and 2017. Consistent with Figure 1, we can see two regions-- San Francisco (99%) and Silicon Valley (44%) -- havingthe largest growth in jobs. And it is not surprising to seeSilicon Valley with the biggest tech workforce (152,000)followed by Los Angeles’s 124,000 and San Francisco’s90,000. For most regions, their tech job growth rates arehigher than their overall job growth rates.Figure 4 presents the annual median wage for thesecore tech positions in 6 regions in 2010 and 2017. We seeacross-the-board wage growth between 2010 and 2017 from12% in Silicon Valley to 25% in San Francisco. In 2017,median wages are around 100,000 in the Southern California regions, lower than Northern California’s (East Bay’s 110,000 and 120,000 plus for San Francisco and SiliconValley) where the cost of housing is also higher.California–61
THE TECH INDUSTRY IN CALIFORNIA AND LOS ANGELESFigure 3The Number of Core Tech Jobs in 2010 and 2017 for 6 California 00020,000-East BayOrange County San DiegoSan Francisco Los Angeles20102017Silicon ValleySources: Occupational Employment StatisticsFigure 4The Annual Median Wage for Core Tech Jobs in 2010 and 2017 for 6 California Regions 00060,000Orange County San DiegoLos Angeles2010East Bay San Francisco Silicon Valley2017Source: Occupational Employment Statistics62–CaliforniaUCLA Anderson Forecast, September 2018
THE TECH INDUSTRY IN CALIFORNIA AND LOS ANGELESTable 22017 Annual Median Wage and Employment in Tech Position in L.A.AnnualCodeTitleMedianWage ( )15-1111Computer and Information Research uter Systems Analysts92,17014,450Computer Programmers88,1006,74015-1132Software Developers, Applications109,96016,97015-1133Software Developers, Systems Software122,18014,61015-1141Database Administrators97,6702,50015-1142Network and Computer Systems Administrators15-1143Computer Network Architects15-1199Computer Occupations, All 1Aerospace Engineers130,69017-2031Biomedical Engineers92,86055017-2041Chemical Engineers96,57023017-2051Civil Engineers108,8908,06017-2061Computer Hardware Engineers125,4901,84017-2071Electrical Engineers115,4505,40017-2072Electronics Engineers, Except Computer135,8005,51017-2081Environmental Engineers101,5002,04017-2111Health and Safety Engineers108,6308706,15017-2112Industrial Engineers101,70017-2131Materials Engineers104,83053017-2141Mechanical Engineers94,3305,87017-2171Petroleum Engineers123,85066017-2199Engineers, All Other105,9703,550Sources: Occupational Employment StatisticsThe Tech Industry in Los AngelesLet’s go back to the first definition of tech jobs (durablemanufacturing, information, and professional, scientific,and technical services) in order to look at the geographicfocus within L.A. County. Because we don’t have the datafor durable manufacturing (only for total manufacturing),we only discuss the current state and the change of the information sector and professional, scientific, and technicalservices sector. As a whole, the average wage was 111,800in the information sector and 93,000 in the professional,scientific, and technical services sector in 2017.Figure 5 shows the number of employment in the information sector by zip code in L.A. in 2017. Darker redmeans more employment as opposed to darker blue meaningUCLA Anderson Forecast, September 2018less employment. It is clear to see the information sector isclustered in West L.A., Culver City, and through West Hollywood to Burbank.Figure 6 displays the number of employees in the professional, scientific, and technical sector by zip code in L.A.in 2017. This sector is less concentrated than the informationsector and ranges from West L.A., Westlake, South Bay,West Hollywood, Downtown L.A., Burbank, and Monroviaup to Santa Clarita. Table 3 lists the top 10 zip codes foremployment in these two sectors in L.A. County in 2017.For the information sector, they are in Burbank, UniversityCity, Santa Monica, West L.A. Hollywood, Culver Cityand Venice. For the professional, scientific, and technicalservices, they are in Downtown L.A., El Segundo, CenturyCity, West L.A. Warner Center, Santa Monica, etc.California–63
THE TECH INDUSTRY IN CALIFORNIA AND LOS ANGELESFigure 5Employment in the Information Sector by Zip Codes in L.A. in 2017Source: California Employment Development DepartmentFigure 6Employment in the Professional, Scientific, and Technical Services Sector by Zip Codes in L.A. in 2017Source: California Employment Development Department64–CaliforniaUCLA Anderson Forecast, September 2018
THE TECH INDUSTRY IN CALIFORNIA AND LOS ANGELESTable 3The Top 10 Zip Codes for Employment in Tech in L.A. in 2017InformationZip CodeRegionEmployment91504Burbank66,34191608 University City14,01290404 Santa Monica8,75191505Burbank7,06790064West L.A.6,17890028Hollywood5,55890245El Segundo5,27391521Burbank5,00990232Culver City4,77190291Venice4,585Professional, Scientific, and TechnicalServicesZip 90245El Segundo11,42690067Century City9,54391505Burbank7,96590025West L.A.5,65791367 Warner Center5,29890404Santa Monica5,01390010 Wilshire Center4,55990064West L.A.4,460Source: California Employment Development DepartmentFigure 7Percentage of Jobs in the Information and the Professional, Scientific, and Technical Services Sectors Over the Total Jobs,by Zip Codes in L.A., 2017Source: California Employment Development DepartmentFigure 7 presents the percentage of jobs in the information and professional, scientific, technical services sectorsover the total jobs by zip code in L.A. in 2017. Similar toUCLA Anderson Forecast, September 2018Figures 5 and 6, the high density of tech jobs (shown in darkred) occurs in the West L.A., West Hollywood, Burbank,Westlake, and Pasadena areas.California–65
THE TECH INDUSTRY IN CALIFORNIA AND LOS ANGELESTable 4YearWe can see that San Francisco (including EastBay) region has the most active startup investments. In 2017, there were 909 funding deals,amount to 22.2 billion with 12 exits. SiliconValley comes as second with 643 funding dealstotaling 18.3 billion with 15 exits in 2017. LosAngeles is the third with 307 funding deals totaling 9 billion with 11 exits. San Diego ( 1.7 billion)and Orange County ( 2 billion) come last withmuch lower startup funding investments. It is worthnoting that startup investments in Los Angeleshas been accelerating in recent years, from 2.75billion in 2011 to 9 billion for the first 9 monthsin 2018.Financing of Startups in 5 California Regions, 2011 to2018 (January to September)Total# ofFinancing# ofAmounts( Billion)ExitsYearSan Francisco (including East Bay)Total# ofFinancingAmounts( Billion)# ofExitsSilicon 845113.814Los 1114.04492016951.882201531925867.46Using the growth rate of tech employmentin Figure 2, we forecast the tech job growth overthe next year for these 6 California regions: LosAngeles: 2%, San Francisco: 2.2%, Silicon Valley:2.5%, Orange County: 1%, San Diego: 2.5%, andEast Bay: 2%. We suggest that exceptionally highgrowth in San Francisco and Silicon Valley we sawin the past several years will slow down, partlydue to rising cost of housing, and will converge toa normal growth range of 2% similar to SouthernCalifornia.120142016ForecastOrange .532San lusionsThe takeaways of the report are as follows: By and large, tech industry and jobs remain robust inmajor California metro areas. They are the main driverof a strong California economy because of their highproductivity, high income, and high purchasing power. In terms of core tech jobs, Silicon Valley has the largest number: 152,000, followed by L.A.’s 124,000,San Francisco’s 90,000, San Diego’s 71,000, OrangeCounty’s 66,000, and East Bay’s 50,000. Silicon Beach (the region from West L.A. and WestHollywood to Burbank) enjoyed a higher growth oftech jobs than the surrounding areas, in particular forthe information sector with high skills and high wagesin the past few years. In recent years, we also see risingstartup investments in Silicon Beach due to its vibrantenvironment for innovation and entrepreneurship.Source: CB InsightsStartups InvestmentsIn addition to the tech industry, the startups activities areanother indicator to present the vibrancy of innovation andentrepreneurship of local economies. Table 4 lists the numberof financing and total funding amounts for startups or privatecompanies. The funding includes seed/angel, venture capital(Series A to E ), private equity, debt, grant, M&A, and IPO.We also show the number of exits, meaning the successfuloutcome of the startups by either becoming public company(IPO) or acquired/merged by other companies. The industryincludes all kinds of businesses, ranging from health care,internet, consumer products, to software.66–CaliforniaUCLA Anderson Forecast, September 2018
City, Santa Monica, West L.A. Hollywood, Culver City and Venice. For the professional, scientific, and technical services, they are in Downtown L.A., El Segundo, Century City, West L.A. Warner Center, Santa Monica, etc. Code Title Annual Median Wage ( ) Employ-ment 15-1111 Computer and Information Research Scientists 119,850 1,040