Transcription
Implications of Grid Modernizationfor Renewable Portfolio Standard(RPS) Goals and ImplementationLori BirdRPS Summit, Washington DCNovember 30, 2016
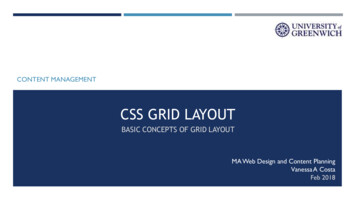
Evolution of Renewable Portfolio Standards (RPS)Expansion of SolarDG TargetsExpansion of RPSTargets While initial RPS targets were often 15-20% renewables, overtime, many states have increased targets (several at 50% RE) Solar and DG carve-outs in many states (18) are leading tosubstantial amounts of distributed generationSource: Barbose LBNL, U.S. Renewables Portfolio Standards 2016 Annual Status Report2
How Much Renewable Energy Can the Grid Handle?NREL has conducted a series of modeling studies to examine grid impacts ofIncreasing penetrations of renewable ems-design-studies.html3
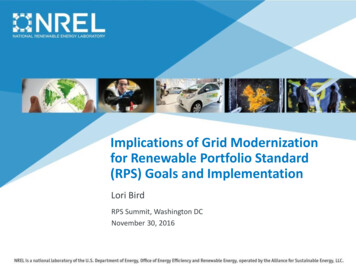
Recent Changes in State RPS Targets6 states recently increased RPStargets to 50% RE or greaterVT: 75% by 2032OR: 50% by2040OH: 2-year RPS freezeNY: 50% by 2030KS: SB 91 made RPSvoluntaryRI: 38% by2035DC: 50% by2032CA: 50% by 2030HI: 100% by 2045RPS State with Recent ModificationRPS State4
RPS Solar Carve-outs Driving Distributed SolarSource: Barbose, LBNL, U.S. Renewables Portfolio Standards 2016 Annual Status Report5
Wind Energy Installations by State6
Renewables are One Driver for Grid ModernizationGrid modernization addresses a variety of trends, newtechnologies, and new demands on electric energyinfrastructure in the coming years7
DOE Grid Modernization Initiative ObjectivesObjective: to help shape the future of our nation’s grid andsolve the challenges of: integrating conventional and renewable sources withenergy storage and smart buildings, while ensuring that the grid is resilient and secure towithstand growing cybersecurity and climatechallenges.Goals: 10% reduction in the societal costs of power outages 33% decrease in cost of reserve margins whilemaintaining reliability 50% cut in the costs of wind and solar and other DGintegration8
Grid Evolution to Adapt to Changing Resource MixNew Generation/Use CharacteristicsGrid Impacts and Needs Increased variability anduncertainty of generation(wind/solar) Time of renewable generationmay not correspond with loads More prosumers –more on-siteconsumption and grid exports Shifting system peaks with solarconsumption (duck curve) Rapid growth of distributedgeneration on feeders, clusteringof DG in some cases Need for additional grid flexibilityto address variability Accommodate greater consumerinteraction (e.g. AMI, smartinverters) Address distribution system andreliability impacts of more DERs Greater visibility of distributedsystem needed (improved sensingand measurement) Changing needs for distributionsystem planning9
Grid Flexibility is Needed to Manage Higher Amounts of RECan manage higher penetrations of renewables on the gridthrough flexibility in grid and resourcesBoth supply and demand sideflexibility can help address gridchallengesDemand side flexibility can beachieved through variousmeans: Demand response/time ofuse rates Storage New loads (e.g., EVs)10
Renewable Energy Integration Options – Western Study1.2.3.4.Fast dispatch & schedulingEnergy imbalance marketImproved RE forecastingGeographic diversity ofresources5. Improve reservesmanagement6. Use demand response tocomplement variable RE7. Access greater flexibility indispatch of existinggenerating plants8. Focus on flexibility for newgenerating plantsMeeting Renewable Energy Targets in theWest at Least Cost: The Integration -west-least-cost11
Emerging Distribution System Issues with DERWith more adoption of DER technologies, we are askingthe distribution system to perform new functions:Interconnect generation resources Export power, accommodate two-way flows Determine real-time energy prices Value and compensate ancillary services Evaluate and defer investments in wires 12
Where Can DER be Hosted on the Grid?Jurisdictions increasingly evaluating grid hosting capacity forDER. Three levels of sophistication: Restricted zones (where can’t I build a system?) Address-level search (can I build a system here?) Feeder mapping (where should I build a system?)Burlington Electric (VT), Green Mountain Power (VT), PSE&G (NJ)13
Example: Grid Modernization Solutions for Solar California concerned aboutlarge solar energyconsumption mid-day – duckcurve Potential solutions includeincreased demand response,storage Moving to Time-of-use (TOU)rates to encourage customerload shifting Grid must be capable of theconsumer interaction (e.g.,advanced metering needed,customer needs automaticload controls)14
DOE Grid Modernization Efforts15
Contact information:Lori Birdlori.bird@nrel.gov
Future Electric Regulation Project – Technical Assistance Grid Modernization Future of Electric Utility Regulation Projectincludes state technical assistance (TA) NREL can provide TA to evaluate rate or regulatory changes toaddress the changing generation mix and grid issues, such as:oooNew rate designs to address grid issues (e.g., TOU rates)Distributed generation adoption under rate designsDistribution system impacts of DER loads and consumer interaction Some of NREL tools:oooSystem Advisor Model (SAM)Distributed Generation Market Demand Model (dGen)Integrated Energy Systems Model (IESM)17
Lori Bird RPS Summit, Washington DC November 30, 2016. 2 Evolution of Renewable Portfolio Standards (RPS) While initial RPS targets were often 15-20% renewables, over time, many states have increased targets (several at 50% RE) Solar and DG carve-outs in many states (18) are leading to