Transcription
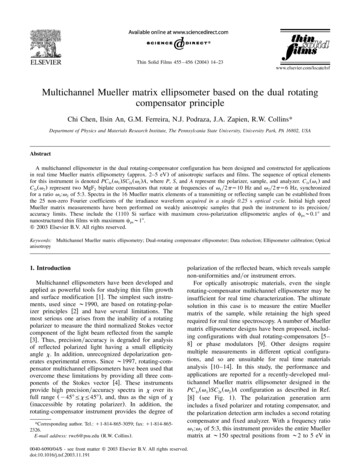
Thin Solid Films 455 – 456 (2004) 14–23Multichannel Mueller matrix ellipsometer based on the dual rotatingcompensator principleChi Chen, Ilsin An, G.M. Ferreira, N.J. Podraza, J.A. Zapien, R.W. Collins*Department of Physics and Materials Research Institute, The Pennsylvania State University, University Park, PA 16802, USAAbstractA multichannel ellipsometer in the dual rotating-compensator configuration has been designed and constructed for applicationsin real time Mueller matrix ellipsometry (approx. 2–5 eV) of anisotropic surfaces and films. The sequence of optical elementsfor this instrument is denoted PC1r(v1 )SC2r (v2 )A, where P, S, and A represent the polarizer, sample, and analyzer. C1r(v1 ) andC2r(v2) represent two MgF2 biplate compensators that rotate at frequencies of v1 y2ps10 Hz and v2 y2ps6 Hz, synchronizedfor a ratio v1:v2 of 5:3. Spectra in the 16 Mueller matrix elements of a transmitting or reflecting sample can be established fromthe 25 non-zero Fourier coefficients of the irradiance waveform acquired in a single 0.25 s optical cycle. Initial high speedMueller matrix measurements have been performed on weakly anisotropic samples that push the instrument to its precisionyaccuracy limits. These include the (110) Si surface with maximum cross-polarization ellipsometric angles of cps;0.18 andnanostructured thin films with maximum cps;18.䊚 2003 Elsevier B.V. All rights reserved.Keywords: Multichannel Mueller matrix ellipsometry; Dual-rotating compensator ellipsometer; Data reduction; Ellipsometer calibration; Opticalanisotropy1. IntroductionMultichannel ellipsometers have been developed andapplied as powerful tools for studying thin film growthand surface modification w1x. The simplest such instruments, used since ;1990, are based on rotating-polarizer principles w2x and have several limitations. Themost serious one arises from the inability of a rotatingpolarizer to measure the third normalized Stokes vectorcomponent of the light beam reflected from the samplew3x. Thus, precisionyaccuracy is degraded for analysisof reflected polarized light having a small ellipticityangle x. In addition, unrecognized depolarization generates experimental errors. Since ;1997, rotating-compensator multichannel ellipsometers have been used thatovercome these limitations by providing all three components of the Stokes vector w4x. These instrumentsprovide high precisionyaccuracy spectra in x over itsfull range (y458FxF458), and, thus as the sign of x(inaccessible by rotating polarizer). In addition, therotating-compensator instrument provides the degree of*Corresponding author. Tel.: q1-814-865-3059; fax: q1-814-8652326.E-mail address: rwc6@psu.edu (R.W. Collins).polarization of the reflected beam, which reveals samplenon-uniformities andyor instrument errors.For optically anisotropic materials, even the singlerotating-compensator multichannel ellipsometer may beinsufficient for real time characterization. The ultimatesolution in this case is to measure the entire Muellermatrix of the sample, while retaining the high speedrequired for real time spectroscopy. A number of Muellermatrix ellipsometer designs have been proposed, including configurations with dual rotating-compensators w5–8x or phase modulators w9x. Other designs requiremultiple measurements in different optical configurations, and so are unsuitable for real time materialsanalysis w10–14x. In this study, the performance andapplications are reported for a recently-developed multichannel Mueller matrix ellipsometer designed in thePC1r(v1)SC2r(v2)A configuration as described in Ref.w8x (see Fig. 1). The polarization generation armincludes a fixed polarizer and rotating compensator, andthe polarization detection arm includes a second rotatingcompensator and fixed analyzer. With a frequency ratiov1:v2 of 5:3, this instrument provides the entire Muellermatrix at ;150 spectral positions from ;2 to 5 eV in0040-6090/04/ - see front matter 䊚 2003 Elsevier B.V. All rights reserved.doi:10.1016/j.tsf.2003.11.191
C. Chen et al. / Thin Solid Films 455 – 456 (2004) 14–2315Fig. 1. Schematic diagram of the dual rotating-compensator multichannel ellipsometer.a time as short as 0.25 s, a single optical period of thedual rotating-compensators.2. Theoretical descriptionFor the dual rotating-compensator multichannel ellipsometer with v1s5v and v2s3v, the time-dependentwaveform predicted at each pixel of the array detectorcan be expressed in terms of the Mueller matrix of thesample w8x. The waveform used for theoretical analysisis given byS16Vns1TIŽt.si0 Ua q 8 wya2ncosŽ2nvtyf2n.T 0xHere, (CS1, CS2) are defined by the equations C1 9s5(vtyCS1) and C2 9s3(vtyCS2), where C1 9 and C2 9are the true angles of the fast axes of the first andsecond compensators. Thus, y5CS1 and y3CS2 are theangles of the fast axes at ts0, defined as the onset ofdata acquisition for the given pixel (or pixel group).The d.c. and d.c.-normalized a.c. coefficients can bewritten collectively as {I0, (a2n, b2n); ns1,«,16} andare given by I0sa0i0, a2nsa2n ya0, and b2nsb2n ya0.The average irradiance in the waveform I0 can beexpressed as the product of three factors (i) the ellipsometer spectral response function I00, (ii) the d.c.coefficient a0, and (iii) the (1,1) Mueller matrix elementM11 of the sample.3. Data collectionWzT2n XTYqb2nsinŽ2nvtyf . , (1a)where {a0, (a2n, b2n); ns1,«,16} define the d.c. andunnormalized a.c. Fourier coefficients. Among the 32possible a.c. Fourier coefficients under the summationin Eq. (1a), the eight coefficients with ns9, 12, 14 and15 vanish even for the most general Mueller matrix.The phases of the individual Fourier components, {f2n;ns1,«,8, 10, 11, 13, 16} in Eq. (1a) are given interms of the phase angles (CS1, CS2) of the two rotatingcompensators as follows:f2ns{sgn(3Ly5K)}{3LCS2y5KCS1};(Ks0, 2, 4; Ls0, 2, 4),(1b)where 2ns)3Ly5K), applicable for ns1,«, 7, 10; andf2ns3LCS2q5KCS1; (Ks2, 4; Ls2, 4),(1c)where 2ns3Lq5K, applicable for ns8, 11, 13, 16.For an error-free system in the dual-rotating compensator configuration with the angular frequencies v1s5vs2p(10) sy1 and v2s3vs2p(6) sy1, theirradiance at any given pixel (or pixel group) obeys thefollowing experimental expression w8x:ST16WTI9Žt.sI0 9U1q 8 Ža2n 9 cos2nvtqb2n 9 sin2nvt.X,TTVns1(2)Ywhere {I09, Ža2n 9, b2n 9.; ns1, 2,«, 16} are the d.c. andd.c.-normalized a.c. Fourier coefficients to be determined experimentally. Eq. (2) differs from Eq. (1a) inthat the former waveform does not include the compensator phase angles f2n. These terms are omitted fromthe experimental phases because they cannot be determined until a calibration is performed that yields (CS1,CS2). If the detector is read N times per fundamentaloptical period (p y v)s0.25 s, each read-out with thesame exposure time of tesp y(Nv)s(4N)y1 s, then Nirradiance waveform integrals are generated. For Ns36and tes6.94 ms, one can form a set of 36 equations in
C. Chen et al. / Thin Solid Films 455 – 456 (2004) 14–231636 unknowns for each spectral position by extendingthe series in Eq. (2) to include all even Fourier coefficients up to b36 9 (but not including a36 9). The corresponding 36 36 matrix of coefficients can be invertedto deduce {I0 9, a2m 9 (ms1,«,17), b2n 9 (ns1,«,18)}.Of these 36 quantities, 11 Fourier coefficients shouldvanish (corresponding to m, ns9, 12, 14, 15, 17; ns18).m22qim23s(a0 ys1s2) exp(y2iP9) {B8 exp(2iA9)4. Data reductionm32qim33s(ia0 ys1s2) exp(y2iP9) {B8 exp(2iA9)Once the d.c. and normalized a.c. Fourier coefficients{I0 9, Ža2n 9, b2n 9.; ns1,«,8, 10, 11, 13, 16} are determined and calibration data for (CS1, CS2) are available(see Section 5), the next step is a phase correction ofthe coefficients performed by applyingqB32 exp(y2iA9)},m24qim34s(y2ia0 ys2 sind1){B22 expwy2i(P9qA9)x},(4f)yB32 exp(y2iA9)},y2b14 cos2(2P9yA9)qt1a6 sin2A9yt1b6cos2A9},(3)where T denotes the transpose of the row vector andR(f2n) is the 2 2 rotation transformation matrix forthe angle f2n w8x. From the phase-corrected Fouriercoefficients, the normalized Mueller matrix elements{mijsMij yM11; is1,«,4; js1,«,4} can be determined.For the upper left 3 3 block of mij, there is only onepossible set of equations for this purpose, whereas forthe 4th row and column, multiple methods are possible.Here, the following set of equations is applied:a0st1t2µt1t2qa8 cos4ŽP9yA9.qb8 2b20sin4P9qa32cos4ŽP9qA9.qb32sin4ŽP9qA9. y1,(4a)m12qim13s(a0 ys1t2) exp(y2iP9)(4b)m14s(a0 yt2 sind1){2a22 sin2(P9q2A9)y2b22 cos2(P9q2A9)yt2a10 sin2P9qt2b10 cos2P9},(4c)m21qim31s(a0 yt1s2) exp(y2iA9) {yB8* exp(4iP9)qt1B12yB32 exp(y4iP9)},(4h)m42qim43s(2ia0 ys1 sind2) {B26 expwy2i(P9qA9)x},(4i)m44s(2a0 ysind1sind2){ya4 cos2(P9yA9)yb4 sin2(P9yA9)},(4j)along with M11sI0 y(I00a0). In Eqs. (4a)–(4j), B2nsa2nqib2n, B2n*sa2nyib2n, sjssin2(dj y2), and tjstan2(dj y2) ( js1,2), where dj ( js1,2) represent theslow-to-fast axis phase shifts for the first and secondrotating compensators. For the evaluation of MijsM11mij from {I0, (a2n, b2n), ns1,«,8, 10, 11, 13, 16}in data reduction, one requires I00, d1, d2, P9sPyPS,A9sAyAS, all of which are determined in calibration.Here P9 and A9 are the true angles of polarizer andanalyzer transmission axes given in terms of nominalreadings, P and A, and offset corrections, PS and AS.5. Calibration {yB8 exp(4iA9)qt2B20yB32 exp(y4iA9)},(4g)m41s(a0 yt1 sind2){2a14 sin2(2P9yA9)Ža2n b2n.TsRŽf2n.Ža2n9b2n 9.T;Žns1, 2,«, 8, 10, 11, 13, 16.(4e)(4d)For the dual rotating-compensator multichannel ellipsometer, the usual calibration sequence involves: (i)measurement of the retardance spectra d1 and d2 instraight-through, (ii) determination of the optical element offset and phase angles (PS, CS1, CS2, AS) withthe sample in place after its alignment, and (iii) measurement of the ellipsometer spectral response I00 frominitial measurements of the starting sample w15x. Thus,with this sequence, d1 and d2 are determined once inthe initial development of the ellipsometer (or after anymajor system realignment) using the straight-throughPC1r(5v)C2r(3v)A configuration without a sample. Theoffset and phase angles are determined in a separatestep after mounting and aligning the sample. Although
C. Chen et al. / Thin Solid Films 455 – 456 (2004) 14–2317self-calibration (i.e. calibration using the measured Fourier coefficients without a separate step) is possible foran isotropic sample, higher accuracy is achieved byperforming calibration vs. polarizer and analyzer angularreadings. Finally, slight differences in beam path throughthe second compensator, resulting when measuring samples with differing alignments, can lead to variations inthe appropriate d2 for data analysis of such samples.This problem can be minimized in an alternative calibration in which d2 is measured with the sample inplace after the offset and phase angle calibration, butbefore the spectral response calibration.5.1. Retardance calibrationIn general, an internal alignment procedure is necessary to ensure that the fast axes of the two plates ofeach MgF2 biplate compensator are precisely orthogonal,and thereby to minimize artifacts in their retardancespectra w16,17x. Here, it is assumed that such a procedurehas been performed for both compensators. For measurements in the straight-through PC1r(5v)C2r(3v)A configuration, in the absence of errors, only the Fouriercoefficients in Eq. (2) with ns2, 4, 6, 8 and 10 arenon-zero. Under these conditions, the amplitudes of themeasured ns4, 6 and 10 Fourier coefficients can provide d1 and d2 directly, according to:1y2d1s2tany1µ)B89)y)B129) ,(5a)1y2d2s2tany1µ)B89)y)B209) ,wy2(5b)2z1y2 w15x. Eqs. (5a) andwhere )B2n 9)s Ža2n 9. qŽb2n 9.(5b) do not employ phase-corrected coefficients; thus,(CS1, CS2) are not required for this calibration. Fig. 2a,bshow the resulting spectra in d1 and d2 The solid linefits adopted for subsequent data reduction assume thatthe birefringence of MgF2 is a fourth-order polynomialin photon energy. Quarterwave points of EQ1s3.594 eVand EQ2s3.491 eV are determined. The open and closedcircles in Fig. 2c denote the differences between theexperimental and best-fit spectra in d1 and d2, respectively. Maximum random deviations of ;"0.28 areobserved; systematic deviations are smaller, -"0.18.xFig. 2. Spectra in the compensator retardances (a) d1 and (b) d2,obtained experimentally in straight-through (points). The solid linefits in (a) and (b) are based a fourth-order polynomial in photonenergy for the birefringence of MgF2 . The open and closed circles in(c) denote the differences between the experimental and best-fit spectra in d1 and d2. 5.2. Offset and phase angle calibrationThe angular offsets and phase shifts can be determinedin the actual PC1r(5v)SC2r(3v)A configuration by combining data collected either in a separate step aftersample mounting and alignment or during the actualsample measurement, i.e. in the self-calibration mode(most often using the starting sample surface prior tofilm growth or sample processing) w8,15x. In the offsetand phase angle calibration, the following phase functions are exploitedQ92nstany1Žb2n 9ya2n 9.stany1Žb2nya2n.qf2n;ns1, 2,«,8, 10, 11, 13, 16.(6)Quadrant corrections to the phase functions will beneeded for self-consistent results. These corrections willdepend on the instrument values (P9, CS1, CS2, A9). It isuseful to pre-align the fast axis of each compensatorrelative to its motor shaft to ensure that C19 and C29 arenear zero at the onset of data collection (ts0) for areference pixel. In this way, approximate calibrationvalues are known in advance. Although there are manypossible ways of employing the phase functions forcalibration, a procedure will be described here that workswell for a nearly isotropic sample. Employing Q2n9 withns2, 4 and 8, the following expressions can be derivedPyPSq5CS1sŽ1y4.ŽQ4 9qQ16 9.,(7a)AyASq3CS2sŽ1y4.ŽQ16 9yQ4 9.,(7b)
C. Chen et al. / Thin Solid Films 455 – 456 (2004) 14–2318Fig. 3. (a) PS and AS vs. photon energy, including the spectral average and standard deviation (S.D.) range, and (b) CS1 and (c) CS2 vs. photodiodearray pixel number, including the best linear fits and the differences between the experimental data and best fits. These results were measured inreflection from an isotropic a-Si:H film.(7c)5CS1y3CS2sŽ1y2.ŽQ8 9yQ4 9.Eqs. (7a) and (7b) are valid for the most generalMueller matrix, whereas Eq. (7c) is valid only whenm23sm32, e.g. for an isotropic sample in which caseboth of these elements vanish. A third equation isneeded, and one of the following two functions isemployed:22wxyz µ 16cos Žd y2.tan D ysin d )B69) y)B49) f42121 ŽPyPS.2; PfPS22wxy(8a)z µ 16cos Žd y2.tan D ysin d )B109) y)B49) f4 ŽAyAS.2; AfAS2222the array was operated without grouping. Because AS inFig. 3a is determined in a procedure in which theanalyzer reading is stepped, it exhibits a lower standarddeviation (approx. 0.018) than that of PS (approx.0.078). In Fig. 3b–c, CS1 and CS2 exhibit linear relationships vs. pixel number over the ks400–800 pixel rangewith identical slopes y0.0035908 to within (1 10y6)8.These linear relationships arise because the time originsfor the readout of successive pixels are offset by thesingle pixel readout time tx of 5 ms. The slopes of thelinear fits in Fig. 3b–c are in close agreement with theexpected value of vtxsy0.00368. The difference canbe ascribed to a stable motor speed of 1.994 Hz (ratherthan 2 Hz). Agreement in the measured slopes of CS1and CS2 in successive calibrations over long periodsattests to the high stability of the 5:3 frequency ratiow15x.(8b)5.3. Spectral response calibrationEqs. (8a) and (8b) are valid for an isotropic samplewith the polarizer and analyzer aligned near the pdirection, respectively. To employ these functions, theellipsometric phase angle D for the sample must not benear 08 or "1808, and the amplitude ratio at the left ofEq. (8a) or Eq. (8b) is plotted as a function of thepolarizer or analyzer reading near PS or AS, respectively.Such a plot is fitted to a parabola whose minimumoccurs either at PsPS or at AsAS. If PS or AS isdetermined in this way, then Eqs. (7a)–(7c) can besolved for the remaining three calibration angles.As an example of calibration results applying Eqs.(7a)–(7c) and Eq. (8b), Fig. 3 shows (a) PS and ASvs. photon energy, and (b) CS1 and (c) CS2 vs. photodiode array pixel number as measured in reflection fromisotropic amorphous silicon (a-Si:H). For these results,For a sample measured in transmission or reflection,in the absence of depolarizing effects, M11 is the speculartransmittance or reflectance for incident unpolarizedlight. The critical step in the measurement of M11 is thedetermination of the ellipsometer spectral response function I00 w8,15x. In the transmission geometry, I00 can beobtained easily by removing the sample; in this case,M11s1 so I00sI0 ya0. For a real time measurement inreflection, if the nature of the initial starting surface atts0 is known, then this surface can be employed as acalibration standard for subsequent measurements. Usingthis approach, one can write:M11Žt.sI0 9Žt.a0Ž0.I0 9Ž0.a0Žt.RuŽ0.(9)
C. Chen et al. / Thin Solid Films 455 – 456 (2004) 14–23(12d)where I0 9Ž0. and I0 9Žt. are the measured d.c. componentsof the waveform obtained from the known startingsurface at ts0 and from the unknown surface at time t,respectively. The a0 spectra are obtained for the corresponding surfaces after substituting the Fourier coefficients Ža2n9, b2n9. into Eq. (3), and in turn substitutingthe transformed coefficients into Eq. (4a). Finally,Ru(0)sM11(0) and M11(t) are the assumed known andunknown (1,1) elements of the unnormalized Muellermatrices for the surface at ts0 and time t, respectively.whereps(b2qc)1y2yb,(13a)6. Mueller matrix conversion to complex n of the three complex amplitude ratiosfrom the Mueller matrix starts from the Jones-to-Muellerconversion equation w18x,MPsAØ(JØJ*)ØAy1,(10)where MP is the Mueller matrix assuming a perfect, i.e.non-depolarizing, sample. In the reflection geometry, Jis the unnormalized Jones matrix with elements J11srpp, J12srps, J21srsp, and J22srss. Thus, the followingdefinitions have been adopted for the reflection coefficients:rjj'w(Er)j y(Ei)j x(Ei)is0andrij'w(Er)i y(Ei)jx(Ei)is0, where the inner subscripts indicate thereflected (r) and incident (i) electric fields and the outersubscripts (i, j) denote the possible combinations of (p,s) or (s, p) directions. Finally, in Eq. (10), A is the4 4 Jones-to-Mueller conversion matrix with A11sA14sA21syA24sA32sA33s1, A42syA43si, andwith all other elements Aijs0 (adopting the eivt timeconvention for the electric fields as in Ref. w18x). If oneallows the possibility of sample imperfections that generate completely random depolarization, thenMspMPq(1yp)MD,(11)where MD is the Mueller matrix for a perfect depolarizerw(MD)11sM11; all other elements (MD)ijs0x, and pdescribes the fraction of the polarized irradiance reflected from the sample w19x.Substitution of Eq. (10) along with the measurednormalized elements of M, mijsMij yM11, into Eq. (11)followed by inversion yields expressions for the complexamplitudereflectionratiosrpp'rpp yrssstancpp exp(iDpp), rsp'rsp yrssstancsp exp(iDsp ), andrps'rps yrssstancps exp(iDps) that define MP:rppsw(m33qm44)qi(m34ym43)x yD1, (LR)(12a)rspsw(m13ym23)qi(m14ym24)x yD1, (UR)(12b)rpssw(m31ym32)yi(m41ym42)x yD1, (LL)(12c)D1spym12ym21qm2219At the right of Eqs. (12a)–(12c) ‘LR’, ‘UR’, and ‘LL’indicate that the numerator is evaluated from the lowerright, upper right, and lower left 2 2 blocks of M.The parameter p is also derived in the inversion,yielding an expression that utilizes all 15 elements ofthe normalized Mueller 1ym32)2q(m41ym42)2q(m34ym43)2q(m33qm44)2x y3.(13c)This parameter can be used, for example, to accountfor the collection of multiply-scattered light by thepolarization detection arm, an effect that may occur inthe measurement of sculptured thin films due to sampleimperfections such as macroscopic roughness or voidstructures (see Section 7). The parameter may also beused to simulate the effect of spectrograph stray light,an ellipsometer imperfection w20x. In fact, the secondterm at the right in Eq. (11) gives rise to an additionald.c. irradiance contribution at the detector, i.e. abovethat generated by a perfect sample, and the stray lightcontribution at the detector is expected to appear similarly in form.Second independent expressions for the off-diagonalamplitude reflection ratios can be derived using moreinvolved expressions from combinations of Muellermatrix 43)w(m41qm42)yi(m31qm32)x} yD1D2, m34ym43)w(m14qm24)qi(m13qm23)x} yD1D2, (URqLR)(14b)whereD2spqm12qm21qm22.(14c)Only the amplitude squares of the complex reflection
20C. Chen et al. / Thin Solid Films 455 – 456 (2004) 14–23ratios can be deduced from the upper left block: rpp 2sD2 yD1,(UL)(15a)NrspN2s(pqm12ym21ym22)yD1, (UL)(15b)NrpsN2s(pym12qm21ym22)yD1, (UL).(15c)It is of interest to consider very weak anisotropy, forexample, that induced at the surface of a cubic semiconductor w21x. Then in Eqs. (12a)–(12d) and Eqs.(15a)–(15c), D1f4cos2cpp, and so measurements ofweak anisotropy will fail when cppf908. Similarly inEqs. (14a)–(14c), D1D2f4sin2 2cpp and these measurements will fail when cppf08 or 908. Finally, Eqs. (15b)and (15c) are insensitive to the presence of weakanisotropy owing to the measurement of amplitudesquared ratios.7. ApplicationsThree different sets of results from the dual rotatingcompensator multichannel ellipsometer will be presented: (i) assessment of the isotropy of an a-Si:H filmprepared by plasma-enhanced chemical vapor deposition(PECVD); (ii) measurement of the surface-inducedoptical anisotropy in (110) Si; and (iii) measurement ofthe local form birefringence of a chiral thin film.Fig. 4 shows the normalized Mueller matrix elementsfrom the 2 2 URB and LLB for a PECVD a-Si:H filmmeasured in reflection at an angle of incidence of uis69.90"0.058. The calibration data obtained prior to thismeasurement are given in Fig. 3. For an isotropic samplesuch as this one, the 8 depicted matrix elements shouldvanish. The waveform spectra used for the determinationof the entire Mueller matrix for a-Si:H were obtained asan average of 20 optical cycles, yielding an overallacquisition time of 5 s. Fig. 4 shows that the spectrallyaveraged values of the eight depicted Mueller matrixelements are 1 10y3 or less, and the spectral standarddeviations are 3 10y3 or less. Such results attest to thevery high accuracy of the multichannel instrument, aswill be discussed further in the second demandingapplication.Fig. 5 shows all normalized Mueller matrix elementsfor a (110) Si wafer surface measured in reflection atuis69.90"0.058. These spectra were collected in 12 s,taking an average of 48 detector waveforms over 24mechanical cycles. In this case, the sample was etchedin situ in a windowless cell using 5 vol.% HF inmethanol and was subsequently measured under N2 gasflow in order to maintain a clean surface. The waferwas oriented for a ;458 angle, denoted f, between thew001x principal axis in the sample surface and the lineof intersection of the plane of incidence with the surface.For this surface the eight elements of the 2 2 URBFig. 4. Normalized Mueller matrix elements from the 2 2 URB andLLB for a-Si:H measured in reflection at an angle of incidence ofuis69.90"0.058. The waveform spectra were obtained as an averageof 20 optical cycles, for an overall acquisition time of 5 s.and LLB of the Mueller matrix do not vanish, but showmaximum amplitudes of ;6 10y3, attributed to surface-induced optical anisotropy. In support of this interpretation, the amplitudes of these matrix elements vanishwhen the sample is rotated so that the angle f is ;0or 908.Fig. 6 shows the results for rpp, rps, rsp, and p derivedfrom the Mueller matrix under the same measurementconditions as Fig. 5, combining selected results fromEq. (12a)–Eq. (12d), Eq. (13a)–Eq. (13c), Eq. (14a)–Eq. (14c), and Eq. (15a)–Eq. (15c). In Fig. 6, rpp wasobtained from Eq. (12a), whereas the low energy (-3eV) parts of Re(rsp) and Re(rps) were obtained fromEqs. (14a) and (12c), respectively. For Re(rsp) andRe(rps) at higher energy and for Im(rsp) and Im(rps)over the full energy range, the results from Eqs. (12b)and (12c) were averaged with those of Eqs. (14a) and(14b), respectively. This overall approach provided thehighest accuracy spectra in rsp and rps. In fact, for avery thin uniaxial surface layer, it can be shown thatrspsyrps w22x, and Fig. 6 reveals this characteristic ata high level of accuracy, within ;1 10y4. Finally, thedeviations of p from unity in Fig. 6 are attributed toinstrument imperfections, dominated in this case byspectrograph stray light. Allowing p to deviate fromunity in the analysis has no effect on the determinationof rps and rsp; however, it significantly improves theagreement of the cpp spectra obtained independently
C. Chen et al. / Thin Solid Films 455 – 456 (2004) 14–2321Fig. 5. Normalized Mueller matrix elements for a clean (110) Si wafer surface measured in reflection at ui s69.90"0.058. The waveform spectrawere obtained as an average of 48 optical cycles, for an overall acquisition time of 12 s.from Eqs. (12a) and (15a), reducing the difference at3.5 eV, for example, from 0.2 to 0.058. Interpretation ofthe spectra in rpp, rps, and rsp of Fig. 6 in terms of thebulk isotropic and surface anisotropic optical propertieswill be provided in a separate article in these Proceedings w23x.Fig. 7 shows all normalized Mueller matrix elementsmeasured in transmission at normal incidence for a 4.7mm thick MgF2 chiral thin film deposited by glancingangle deposition with simultaneous substrate rotation. Atotal of 12.3 turns yields a right-handed helicoidalstructure (counterclockwise rotation in progression fromsubstrate to film surface) with a pitch of 0.382 mm. Thespectra in Fig. 7 were derived from an average of 10detector waveforms for an acquisition time of 2.5 s. Inthe absence of optical anisotropy, the Mueller matrixshould revert to the identity matrix. The dominantfeature of anisotropy present in all off-diagonal Muellermatrix elements is a resonance analogous to the Cottoneffect w24x near l0s440 nm or E0s2.8 eV. Thisresonance occurs when the wavelength of light in thematerial l ynav, matches the helicoid pitch P. Here, navis the average of the two principal indices of refractionthat describe the local uniaxial structure. At the resonance, the electric field vector for left-circularly polarized light rotates spatially in phase with the right-handedhelicoids when the sample is illuminated from theambient side, as is the case here. Applying the expression navsl0 yP, yields navs1.16 which is consistentwith the large volume fraction of voids (0.58) estimatedfor this film w25x.Fig. 8 shows the results for the complex amplitudetransmission ratios tpp, tsp, and tps, derived from theMueller matrix of Fig. 7 combining the expressionsfrom Eqs. (12a)–(12d), Eqs. (13a)–(13c), Eqs. (14a)–(14c) and Eq. (15a) (but with r replaced by t). Inthese plots, which focus on the spectra in the resonanceFig. 6. Results for rpp, rps, rsp, and p derived from the Mueller matrixfor clean (110) Si obtained from Eqs. (12a)–(12d), Eqs. (13a)–(13c)and Eq. (14a).
22C. Chen et al. / Thin Solid Films 455 – 456 (2004) 14–23Fig. 7. Normalized Mueller matrix elements measured in transmission at normal incidence for a 4.7-mm thick MgF2 chiral thin film. The waveformspectra were obtained as an average of 10 optical cycles, for an overall acquisition time of 2.5 s.region, the real and imaginary parts of tsp and tps havebeen obtained in two different ways, as has tpp 2stan2cpp. Results designated tsp and tps have beenobtained from the analogs of Eqs. (12b) and (12c),whereas those designated tsp1 and tps1 have beenobtained from the analogs of Eqs. (14a) and (14b). Inaddition, the results for tpp 2 have been obtained eitherby computing the modulus of tpp as in Eq. (12a), ordirectly as in Eq. (15a). Overall excellent agreement isfound for results calculated independently from differentparts of the Mueller matrix. It is clear that higher qualityresults are obtained for Re(tsp) and Re(tps) by applyingFig. 8. Results for tpp, tsp , and tps, derived from the Mueller matrix of Fig. 7 for the MgF2 chiral thin film. Results designated tsp and tps havebeen obtained from the analogs of Eqs. (12a)–(12d) whereas those designated tsp1 and tps1 have been obtained from the analogs of Eqs. (14a)–(14c). The results for tpp 2 have been obtained by computing the modulus of tpp as in Eq. (12a) (solid points), and directly as in Eq. (15a)(open points).
C. Chen et al. / Thin Solid Films 455 – 456 (2004) 14–23Eqs. (14a)–(14c); however, equally good data can beobtained for Im(tsp) and Im(tps) either from Eqs.(12a)–(12d) or from Eqs. (14a)–(14c). In fact, theagreement of these latter two pairs of spectra wwithin;(1–3) 10y4x is remarkable considering their relatively low amplitude and different origin. The analysisof the spectra of Fig. 8 in terms of the structure andoptical properties of the chiral film is beyond the scopeof the present article and will be treated elsewhere w26x.To summarize, such modeling has shown that a birefringence Dn(l0) of 0.066 associated with the local uniaxialstructure is required to generate the observed magnitudesof the features in tpp, tsp, and tps in Fig. 8.8. ConclusionsA multichannel ellipsometer in the dual rotatingcompensator configuration has been designed and constructed using optical elements fabricated from MgF2 toensure a wide spectral range, e.g. making it possible toadd a D2 lamp to the standard Xe lamp in the nextgeneration design. For a
rotating-compensator multichannel ellipsometer may be insufficient for real time characterization.The ultimate solution in this case is to measure the entire Mueller matrix of the sample, while retaining the high speed required for real time spectroscopy.A number of Mueller matrix ellipsometer designs have been proposed, includ-