Transcription
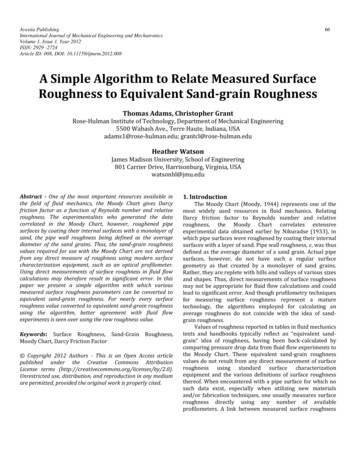
The influences of roughness on film t icknessby Mueller matrix eiiipsometrymeasurementsDavid A. RamseyAT&T Bell Labs, Allentown, Pennsylvania 18105-1000Kenneth C. LudemaMechanical Engineering Department, University of Michigan, Ann Arbor; Michigan 48109-2125(Received 4 October 1993; accepted for publication 24 April 1994)The accuracy of measurement of the thickness of uniform thin films on solid substrates by nullellipsometry is severely limited when the substrate is rough. It is impossible to separate these twoeffects experimentally with the null ellipsometer, and there is no theoretical basis or generally usedmodel available to separate these effects. Thus, a dual rotating-compensator Mueller matrixellipsometer has been constructed to carry out film thickness measurements on rough substrates.Measurements were made on a set of specially prepared specimens of 8630 steel, roughened by gritblasting with aluminum oxide. Grit sizes and blasting pressures were varied to produce 11 differentroughness values ranging from 0.01 to 1.295 ,um R, , as measured with a stylus tracer device. Uponeach of the 11 roughness groups, films of magnesium fluoride were-overlaid to thicknesses of 89,180, 254, and 315 nm. One set of specimens was left uncoated. Experimental results for filmthickness measurements on rough surfaces matched the ideal (for smooth surfaces) form well forroughnesses up to 0.13 ,um R,, at most angles of incidence. For rougher specimens, significantdeviations in results were observed for all but the largest angles of incidence. The nonideal datawere attributed to the cross-polarization effects of surface geometry, and apparent depolarization.The resolution of thickness measurements was 1 run for polished specimens, and decreasedcontinuously to 10 nm for the roughest specimens examined.1. INTRODUCTIONThe practical difficulty when using the null ellipsometerfor the measurement of thin films on rough surfaces is thatthe settings of the polarizer and analyzer for minimum lightat the photometer are different for smooth than for roughsurfaces of the same material. Further, there is often considerable residual light at these settings, probably because roughsurfaces produce a spatial distribution of polarization statesof light, some of which will pass through the analyzer. Thisis particularly a problem in such areas as monitoring corrosion rates and other surface changing processes, after thesurface becomes “rough.” No theoretical work or modelssuggested for handling this problem have been found to bevalid.’ Thus a study of rough surfaces was done with a typeof photometric ellipsometer known as the Mueller matrixellipsometer.II. THE MUELLER MATRIX ELLIPSOMETERAn automated ellipsometer was constructed followingthe description and theory of Azzam’ and Hauge,3 and summarized in a more general form by Hauge.4 A sketch of theoptical train is shown in Fig. 1. The instrument continuouslydetermines all four Stokes parameters of the polarized lightthat is incident upon a specimen surface, {S}? (see Fig. l),after passing through a rotating compensator. It then determines the Stokes parameters, (S13, of the light that is reflected from the specimen. The description of polarizationalteration properties of the surface is given as a 4X4 trans2874Rev. Sci. Instrum.85 (9), September1994formation matrix, [lw], between the two measured states ofpolarized light, known as the Mueller matrix. In full formSOSls2s3 MooMO1MCI2Ml0Ml1Ml2Ml3M,,,M,,M,zM,,M31M32M33m3 M,o-MO3.soSlxs2s3’?I(2A time-varying irradiance arrives at the photometer, provided by the rotating wave plates, and is comprised of 12distinct harmonic frequencies superimposed on some steady(dc) signal. Fourier analysis of the signal yields ‘25 coefficients, which in turn are used to (over) determine the 16elements of the specimen Mueller matrix.The newly constructed instrument has many subsystemsin which inaccuracies could adversely influence the results.Defects in. the components in the optical train are readilycompensated by calculation. Data are obtained when theangle of incidence is 90”, i.e., with no specimen in place. A,typical Mueller matrix for this case is shown in Table I. Themagnitude of the accumulated defect parameters is seen inthe magnitude of departure of the Mueller matrix numbers inTable I from the ideal values in Eq. (4). However, the defectsin the optical train are readily “backed out” in two steps. The:first is to calculate the individual element defect parametersfrom the data in Table 1. In the second step, during dataacquisition from real specimens those same element defectsare accounted for, i.e., “subtracted from” the specimen data.There are yet several system defects that cannot be removedby this method. These include effects due to inaccuracies in0034-8748/94/s5(9)/2874/8/ 8.00Q 1994 AmericanInstituteof Physics
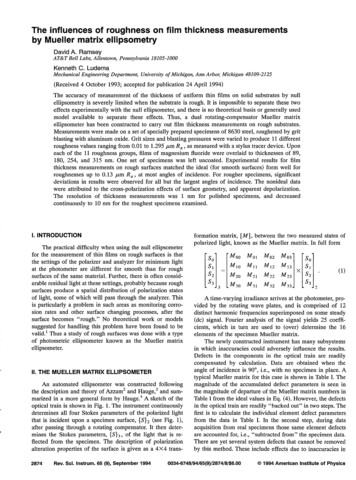
The polarizer and analyzer are Glan-Thompson prisms set into dfvider.heads of O.O1 angular resolution.Their fast axes are parallel with the plane of mcrdence.The quarter-wave plates are zero order quartz elements, made for 633 nm lightThey are rotated to an angular accuracy of 1 part in 12,000 of a revolution.The detectors are silicon photo-diodes. \OO,dto ADC systemFIG. 1. Optics configuration of the Mueller matrix ellipsometer.setting the angle of incidence, the effect of these errors indirecting the light to different locations on the photometersensing plane, instabilities in the intensity and polar state ofthe laser, errors in reading the angular position of the compensators, and perhaps more. The magnitude of these arebest evaluated by comparison of data from the new instrument with that from a top quality null ellipsometer.Ill. VALIDATION OF THE MUELLER MATRIXELLIPSOMETERSeveral specimens were prepared and data from thesewere taken with both the null ellipsometer (research instrument by Rudolph) and the new instrument. The data derivedfrom the two instruments do not correspond exactly witheach other in form. From the null ellipsometer values of A,-r; r:J-y--land are obtained, from which one calculates the reflectioncoefficients, p, in the equations of ellipsometry.’(R,/R,) ‘[( ) -( ) lp (Ep/E,)eir(GP)t-( ‘a)il ’where E and R are the amplitudes of the incident (i) andreflected (r) waves, p and s refer to the p and s waves, and Srefers to the absolute phase position from whichRJR,E&Q(3)For optically ideal surfaces the results of the two systems canbe connected by4-cos 2*00-cos 2@10000sin 2r,b cos Asin 2@ sin Ao-sin2 sinsin2 cosA tan 9,[( ,),- ,),l-ll( ,)i- ,,il3 .1IO0)(4)AlIwhere rP and Y, in the “matrix multiplier” are scalar amplitude reflection coefficients and are related to the irradiance oflight received by the photometer.TABLE I. Typical “straight-through”X 632.8 nm.1.000-0.00010.0058-0.0001Rev. Sci. Instrum.,0.00011.0121-0.0197-0.0020normalized Mueller matrix, usingFor less ideal surfaces the elements in the Mueller matrix are not exactly symmetric about the diagonal and forsuch cases the values of A and may be calculated as follows:* 0.5cos-I{[-M(O,l)-M(1,0)]/2),(5)A tan-r{[M(2,3)-M(3,2j]/[M(2,2) M(3,3)]}.10.03890.00650.01801.0124-0.0004Vol. 85, No. 9, September-0.00080.00170.99901994Test specimens of five materials (oxidized silicon, goldcoated glass, polished aluminum, polished brass, and polished steel’) were used to compare the two ellipsometers. Foreach comparison specimen, measurements were repeated forEllipsometry2875
TABLE II. Comparison of null and Mueller matrix ellipsometer measurements.Angle ofinc., 6Avg. Anull(deg)Avg. 9530.4827.63SpecimentypeAvg. 4Avg. @three physical alignments (remove and remount the specimen) of the specimens on each machine, and for three anglesof incidence. Very “deep” minima were obtained with thenull ellipsometer and “four-zone” averaging was used.The averaged values for A and (CIproduced by both ellipsometers are presented in Table II. It can be seen that the@ values for the Mueller matrix ellipsometer (MME) averaged 0.28% higher and the A values were 0.18% lower thanthose for the null ellipsometer. These differences are attributed to the surfaces being less than ideal, as indicated byslight, reproducible, nonsystematic asymmetry in the Mueller matrix. The repeatability of both instruments were thesame.IV. ELLIPSOMETRYOF ROUGH SURFACESSpecimen preparation. Specimens of conducting material, with Gaussian height distributions of asperities havebeen selected The specimens were 8630 steel substrateshardened and tempered to approximately 45 Rockwell“(C).” The intent was to obtain single phase martensite, tem-pered to reduce residual stresses to a low level, without softening to the point where the stylus tracer measurementswould be compromised.The surfaces were prepared by various combinations ofpolishing and some solid particle erosion processes toachieve a range of Gaussian roughness from 0.01 ,um R,(arithmetic average asperity height) to 1.295 pm R, . Bycontinuously rotating specimens during erosion the surfaceroughness was not only Gaussian but also anisotropic.Roughness was measured with a stylus tracer system using adiamond stylus with a special small tip radius of 2.5 pm.Average roughness values of three traces per specimen aregiven in Table III, and the specimen groups are loosely separated into three different families according to the final process.The material selected for the dielectric overlaid filmswas magnesium fluoride, for which the real component ofthe index of refraction in the form deposited was measuredto be n 1.38 at X 632.8 nm. Films of various thicknesseswere deposited on most of the steel specimens using physicalvapor deposition. Four film thickness groups were planned.One group was not coated and was intended for studies ofthe effects of surface topography alone.The first measurements were made on the polished anduncoated specimens by null ellipsometry and Mueller matrixellipsometry to determine the optical properties of the steel.This was found to be 2.501-3.4081’ (for h 632.8 nmj,which compares well with 2.485 - 3.4331’ found in Ref. 6.The small differences are probably due to differences in microstructure and oxide film between the materials used inRef. 6 and the present work. Next the polished and coatedspecimens were used to determine the thickness of the MgF,films in the four coated groups. Using n 1.3 8 for MgF, thefilm thicknesses for the four groups was found to be 89, 180,254, and 315 nm. Since all specimens of various roughnesseswithin one film thickness group were coated simultaneouslyit was assumed that the rough specimens had the same filmthickness of MgF, as the smooth (polished) specimens. Finally, 55 specimens were selected for study with the identitycodes given in Table IV.For the 55 specimens, ellipsometer measurements weremade in the specular direction for angles of incidence ranging from 45” to 85”. Values for A and as calculated fromselected Mueller matrices are presented in a series of graphs.TABLE III. The surface process sequence and final roughness of specimens.Grouppolished, 0.05 qAU specimens wereprocessed by a seriesof abrasives,ending with oil basedpolishing slurrycontaining 6 pmdiamond particles,which producedsurfaces of -0.02,um R, , followed bythe processes Iisted2878Rev. Sci. Instrum.,using by &O,ofvariousgritsizesVol. 85, No. 9, SeptemberLinde A1994R, llipsometry
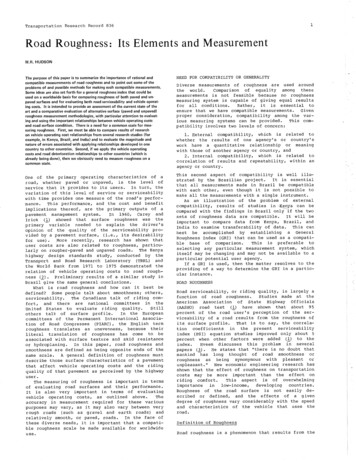
TABLE IV. Array of specimens by film thickness and surface roughness.Group (film)Set ASet BSet CSet DSet Enone89 nm180 nm254 nm315 nm1,2.3.4.5.R,-O.Ol.OpmR, O.O34pmR, O.O48pmR, O.O92pmR, .10.11.R, 0.256pmR, 0.492pmR, 0.557pmR, 0.798pmR, l.O02pmR, oupV. RESULTSB. A and @for polished specimensA. Mueller matrices for rough surfacesValues of A and I&, calculated from Mueller matrices forspecimens 1A through 1E are presented in Figs. 2(a) and2(b). These plots show the effects of increasing film thickness on near-ideal smooth substrates. The data points produce smooth curves which progress in an ordered, thoughseemingly cyclic, fashion with increasing film thickness.Calculations for all curves from optical properties of the materials produce similar results, i.e., differences no greaterthan 0.04”.In Table V typical experimental matrices are presentedfor a polished specimen with the 315 nm film of MgF,,measured at angles of incidence, 45O, 60”, and 75”. The experimental matrices are acceptably near the ideal form givenpreviously.The magnitude of the matrix multiplier increases somewhat with increasing angle of incidence, and is in each casea significant fraction of 1.0 as compared with the valuesobserved for rougher surfaces. AIso, though it is a small difference in this instance, the matrix corresponding to the largest angle of incidence is slightly closer to matching the idealform than the others [particularly in the (2,2), (3,3) equality].Again, this effect is more pronounced for rougher specimens.In Tables VI-VIII,typical Mueller matrices are presented for specimens of increasing roughness, all with 315nm films. The rougher the surface the farther the Muellermatrix departs from ideal at low angle of incidence, and thelower is the matrix multiplier. But all of the matrices approach the ideal at high angles of incidence and the matrixmultipliers also become larger.TABLE V. Qpical Mueller matrices-specimen(0.01 w R,) with 315 nm film (X 632.8 run)].1E [roughness polishedAngle of incidence 942- 0.8565Angle of incidence 36-0.6451Angle of incidence 0.0294-0.02850.0537- 0.2600-0.74590.0017-0.02380.7462-0.2624Rev. Sci. Instrum.,Vol. 85, No. 9, September1994(matrixmultiplier)C. A and @for specimenswith roughnessThe influence of a moderate roughness may be seen forspecimens 5A through 5E with a roughness of 0.127 pm R, ,shown in Figs. 3(a) and 3(b). In these plots, the most notablefeatures are:(i!(ii)There is little reduction in ability to resolve film thickness as roughness increases.The 0 and 315 run specimens always exhibit similarresults in the smooth surface case, though with in-TABLE VI. Typical Mueller matrices--specimen 5E [roughness 0.127 pmR, , 315 nm film (X 632.8)].Angle of incidence 524-0.5702X 0.4072Angle of incidence 050.0203X 0.4291Angle of incidence 81-0.7077x0.3523(matrixmultiplier)X 0.1255 X 1O-3x 0.2589 X IO-’X 0.4811 X 10-lEllipsometry2877
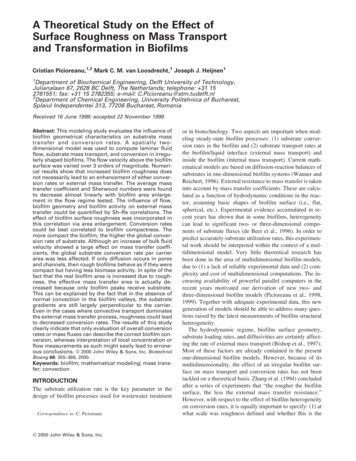
TABLE VII. ‘Qpical Mueller matrices-specimen,um R, with 315 nm film (X 632.8 nm)].Angle of incidence -0.0395Angle of incidence 0.2983-0.26848E [roughness 0X lo-’45x0.5511x 1o-5II5565-- ,*onm----I----254 nm.”3,s “m. x-I8576ANGLE OF INCIDENCE r)(a)6040Angle of incidence .18390.673530XO.3257X1O-4s2 20-10L---OC(iii)creasing roughness the A curves no longer intersect,and the intersection of the Ic, curves shifts leftwardwith roughness.The plots for the 254 nm film specimens show a fairlyabrupt change in A at an angle of incidence in therange of 65” to 70”, along with a corresponding deepvalley for . Also, the A curves rise from 160” to 360”in two of the roughness groups, but decrease from160” to near 0” for the other three. These trends areseen in the results of the calculation using opticalproperties, though accurate values of the latter are notavailable for the case of high roughness.5545l6O”nl254 nm--x-315 nm-47566 -.-. “.”85ANGLE OF INCIDENCE (‘)(b)FIG. 2. (a) Experimental variation of A with angle of incidence for MgF, onsteel, film thickness as indicated, polished substrate (X 632.8 nm). (b) Experimental variation of fi with angle of incidence for MgE, on steel; tilmthickness as indicated, polished substrate (h 632.8 nm).The curves for both A and @ become increasinglyerratic in form with increasing roughness.It is considerably more difficult to differentiate onefilm from another on the basis of J alone. [Thecurves, not shown here, are fairly well orderedthrough the eighth roughness group (0.557 ,um R,),but become quite erratic for subsequent groups].(ii)(iii)Data for rougher specimens produce a different effect. Atypical example is shown for specimens 6A through 6E, allwith 0.256 pm R,, with various film thicknesses, in Figs.4(a) and 4(b). Observations from all curves include:The plots of A versus angle of incidence show a goodability to differentiate between the various films (except 0.315 nm), though not at large angles of incidence.onm-Boom360300-()----- 0 “m240--O--69nmE 180----I60 “Ind----264 ml-x-315 ml12060046TABLE VIII. Typical Mueller matrice pecimenpm R, with 315 nm film (h 632.8 nm)].11E [roughness 1.29555867565ANGLE OF lNCh3ENC.E(‘)(a)50Angle of incidence -0.0127Angle of incidence 60”- 9Angle of incidence .32690.3481-0.3412(matrixmultiplier)X 0.3639 X IO-’--30@L 20Rev. Sci. Instrum.,0.0929-0.20560.21800.3194-X 0.4691 X lo-’89 nm180 7-0.32770 nq X 0.9654 X lo Vol. 65, No. 9, September199455667585ANGLE OF INCIDENCE (‘)FIG. 3. (a) Experimental variation of A with angle of incidence for MgFa onsteel; ftlm thickness as indicated, substrate roughness 0.127 pm R, (A-632.8 nm). (6) Experimental variation of I with angle of incidence forMgFs on steel; film thickness as indicated, substrate roughness 0.127 pmR, (X 632.8 nm).Ellipsometry
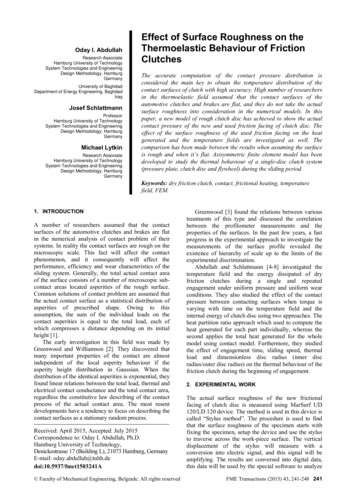
(9There is a marked jump from the curves for the “intermediate” roughness category [see, e.g., Figs. 3(a)and 3(b)], to those of the second. It should be noted,though, that there is a significant increase in roughness, from 0.256 to 0.492 pm.In all of the plots, there is an observable, albeit erratic,progression of results with increasing substrate roughness.In Fig. 5(a), it is seen that once again one of the 254nm film specimens shows a progression for A ratherdifferent from the rest of the members of the coatinggroup, attributable to minor differences in film thickness and surface conditions.----o---o”m- --89 nm-1aonm----254 nm---a-315 “Ill(ii)(iii)(a)ANGLE OF INCIDENCE (4-0OnmA80nm45556575-180 nm.i-254 ml-k-315 nm85ANGLE OF INCIDENCE (‘)(b)FIG. 4. (a) Experimental variation of A with angle of incidence for MgF, onsteel; film thickness as indicated, substrate roughness 0.256 p m R, (A 632.8 MI). (b) Experimental variation of I/ with angle of incidence forMgF, on steel; film thickness as indicated, substrate roughness 0.256 p mR, (X 632.8 nm).In all cases, trends in the data are clearly evident,even if individual data points are scattered.(iv)The data have also been plotted by comparing roughnesseffects for each film thickness group. Figures 5(a) and S(b)are typical plots for 254 mn film. In viewing these plots, it isseen that-0.258 pm-0.492 pmD. Film measurement capabilitiesIn the case of an ideal specimen, it is generally statedthat ellipsometric measurements can reliably differentiate between, or resolve, films differing in thickness by only 1 nm.For the polished specimen, consider Figs. l(a) and l(b) andnote the spacing between the curves. In making experimentalmeasurements such as these, is easily repeatable to betterthan O.l”, and A to something on the order of 0.5”. Interpolating between the curves in Fig. 1, these accuracies of measurement translate to approximately 1 nm or less for resolution of film thickness. Figures 4(a) and 4(b) provide similarplots for the roughest specimens measured. A similar analysis shows a resolution capability on the order of 10 nm. Theability to resolve films of different thicknesses is continuously diminished as substrate roughness increases.This ability to resolve film thickness can be demonstrated for any number of A and @ pairs using these curves.An exception to this ability, however, is seen in Fig. 2 for the0 and 315 nm specimens for which both A and plots crossat 70”. The reason is as follows. For a filmed substrate, areflection coefficient takes the form’-0557&m----0.798 pm-x---1.002pmR t-01 f-,&f2Pji ( - .r, jd-j p)’where rut and rt2 involve the terms listed below, andl.- .--. -L-.“.““.“““. .4555(a)657sP 2nfdllX)(nf-n a5ANGLE OF INCIDENCE r)and reflection coefficients become cyclic functions of thefilm thickness.Consider the case where---o----0.25Spn 0.557pm0.798!An .-no I.On r 1.3 8 (magnesium fluoride), o 70” (angle of incidence),1.002 pm1.295 pmdl 3 15 nm (film thickness),X 63355(b)5575ANGLE OF INCIDENCE P)Vol. 65, No. 9, Septembernm (wavelength of light),85FIG. 5. (a) Experimental variation of A with angle of incidence for MgFz onsteel; substrate roughness as indicated, tilm thickness 254 n m (X 632.8nm). (b) Experimental variation of q with angle of incidence for MgF, onsteel; substrate roughness as indicated, film thickness 254 n m ih 632.8nm).Rev. Sci. Instrum.,(ambient, air),0.492pm--- -x-45sin2 &,j1/21994and the resulting p 2rrXO.503.It is seen that /I is nearly W , producing a full cycle for theexponential terms. The same intersection of data for the 0and 315 nm film is not seen at other angles, and thus the filmdiscrimination for 315 nm of MgF2 is worse at 70” than atany other angle.Ellipsometry2679
85ANGLE OF ,NClDENCE (“)ANGLE OF INCIDENCE (3155545756585100 ----I4555ANGLE OF INCIDENCE (“)(b)E. Effects of specimen preparation methodOne final point concerns the methods used for preparingthe various specimens. In producing specimens for the 11roughness categories, the only intended variable in movingfrom one category to the next is that of surface roughness.Other factors apparently became inadvertently involved, butdid not affect the conclusions mentioned above. This is seenin the large difference between the curve for the smoothsurface and those of the “intermediate” rough surfaces inFigs. 6(a) and 6(b) and may be seen between Fig. 6 and Fig.7 as a comparison between two roughness groups. Table IIshows three different preparation groups, which apparentlyintroduced three classes of surface chemistry, correspondingto polished, water-based grit blasting, and air-based 798 pm-x---1.00* pm-1.295 pm85ANGLE OF INCIDENCE (7(b)FIG. 6. (a) Experimental variation of A with angle of incidence for MgFz onsteel; substrate roughness as indicated, no film (h 632.8 nm). (b) Experimental variation of with angle of incidence for MgF, on steel; substrateroughness as indicated, no film (X 632.8 nm).I1-FIG. 7. (a) Experimental variation of A with angle of incidence for MgF, onsteel; substrate roughness as indicated, no film (X 632.8 nm). (bj Experimental variation of (I- with angle of incidence for MgF, on steel; substrateroughness as indicated, no film (X 632.8 nm).The form of this matrix is far from ideal. The calculatedvalues for A and using the equations previously given areA 314.302 and e49.935. Furthermore, the matrix multiplier, 0.1633X10-‘, is very small indicating that relativelylittle light is reflected in the specular direction. (The nullellipsometer results provide no perspective on the “quality”of the data.)At least two nonideal effects can be shown in this case.First, assume that linearly “p” polarized light is to be reflected from this specimen. The Stokes’ vector for such aninput is given by7{S}2 kl110 .(8)0F. Nonideal effectsWhen rough or other problem surfaces are encountered asimple A and characterization is not representative of theideal reflection process. Other phenomena become apparent.Consider the Mueller matrix for a specimen with a roughnessof 0.256 pm R, on which there is a film of MgFz 89 runthick, for an angle of incidence of 50”. The matrix takenfrom the data .3690’(7)2880Rev. Sci. Instrum.,Vol. 85, No. 9, September1994The Stokes’parameters for the reflected light may be foundby taking the product of the experimental Mueller matrixwith this input vector, resulting in{S13 k21.16310.41210.4271*(9)0.0481Fractional polarization. The first nonideal effect is exhibited in the “degree” of polarization of the reflected light.If the reflected light were totally polarized its Stokes vectorwould be of numerical form such thats; s; s sg.(10)However, from the above {S}, , the total reflected irradiance?is S (1.1631 ‘ 1.3528, whereas the polarized irradi:ante is S S S O.3546.Ellipsometry
The polarization fraction is 0.3546/1.3528 0.262, i.e.,some 74% of the reflected irradiance is unpolarized whereasall of the incident light was polarized.Depolarization effects have consistently been referred toas “apparent,” and finally expressed as the “polarizationfraction.” Certainly, to the ellipsometer, some portion of thereflected light from rough surfaces has no identifiable polarization state. This probably arises from the fact that the facets of the rough surface geometry provide several differentpolarization states simultaneously, which is interpreted as anunpolarized component of the total irradiance.Cross polarization. The second such effect is cross polarization. In the ideal smooth surface case, a p-polarizedinput should reflect as a p-polarized output (and s input produces s output”, and the reflected output vector would haveto be proportional to that of the input-whichclearly it isnot. In fact, this form of the output vector indicates the presence of both p and s polarized components in the reflectedlight. Thus, a cross-polarization effect is observed. (A secondcalculation for an “s” input would show a similar effect.) Asdescribed by Beckmann,‘,’ components of the electric helddo act independently when they are parallel or perpendicularto the plane of incidence. In the case of a rough surface,however, there is not only a nominal plane of incidence,there are innumerable such local planes. Thus, field components which, in the global coordinate system should apparently be immune to cross polarization, intercept surface features at oblique angles, many of which arrive at the activearea of the detector.The magnitude of the cross-polarization effect can becalculated as follows. First, the Stokes’ vector for the reflected light can be separated into polarized and “unpolarized” por&ons. Thus 0.5676000polarizedill)unpolarizedConsidering only the polarized portion of this output, therelative amplitudes of orthogonal components of the electricfield vector areRev. Sci. Instrum.,Vol. 65, No. 9, September1994& E; E,2 0.5955,E, 0.7098,Sr E;--E,2 0.4121,E, 0.3028.wThus? a p-to-s “cross-polarization fraction” could be definedassE-0.3028-EP 0.7098 0.4266.It is also possible to calculate such ratios for p inputs, sinputs, circular inputs, etc.G. Modified Mueller matricesNonideal effects notwithstanding, it is interesting to extract more realistic A and Cc,values from the experimentalMueller matrices. That is, it would be useful to have someway to separate the real optical properties of the surface material from roughness effects. Apparent depolarization effectscan be “stripped” off the matrix by forcing {S}, into a totally polarized form and the specimen Mueller matrix can bealtered for extraction of a more useful A and . No way hasbeen found to remove cross-polarization effects. Williamshas attacked the problem by way of the Poincari representation of polarizati0n.l’ Unfortunately several other effectswere found in addition to “depolarization” and cross polarization and it is not known which are independent effects.’D. A. Ramsey, Ph.D. thesis, University of Michigan, 1985.‘R. M. A. Azzam, Opt. L&t. 2, 148 (1978).‘P. S. Hauge, J. Opt. Sot. Am. 68, 1519 (1978).4P. S. Hauge, Surf. Sci. 96, 108 (1980).‘R. M. A. Azzam and N. M. Bashara, Ellipsomehy and Polarized Light(North-Holland, Amsterdam, 1977).“D. Clarke and J. P. Grainger, Polarized Light and Optical Measurement(Pergamon, Oxford, 1976).7E A. Jenkins and H. E. White, Fundamentals of Optics (McGraw-Hill,New York, 1976).s P. Beckmann, Scattering of Electromagnetic Wavesfrom Rough SzlrfacestMacmillan, New York, 1963).‘P. Beckmann, The Depolarization of Electromagnetic Waves (Golem,Boulder, Colorado, 1968).‘eM. W. Williams, Appl. Opt. 25, 3616 (1986).Ellipsometry2881
An automated ellipsometer was constructed following the description and theory of Azzam' and Hauge,3 and sum- marized in a more general form by Hauge.4 A sketch of the . ment by Rudolph) and the new instrument. The data derived from the two instruments do not correspond exactly with each other in form. From the null ellipsometer values of A