Transcription
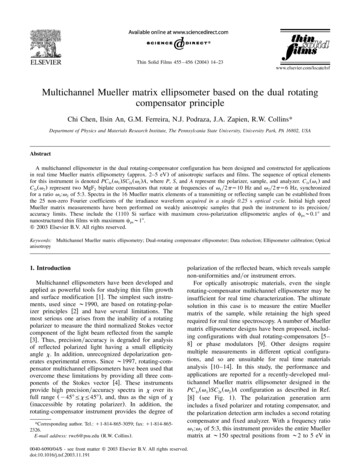
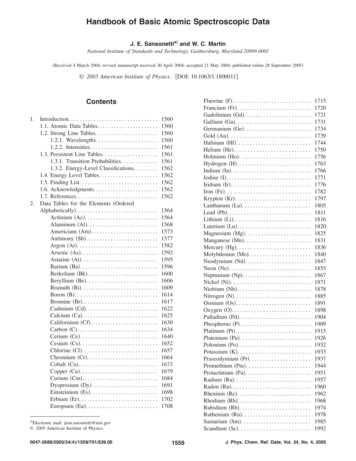
Spectroscopic Ellipsometer --- J. A. Woollam alpha-SEFigure 1: J. A. Woollam alpha-SE spectroscopic ellipsometerIntroductionAn ellipsometer measures the change in polarization as light reflects or transmits from amaterial structure. The measured data is fitted to models to determine the material’s thicknessand the optical properties (n and k). Ellipsometers have high sensitivity and are extensivelyused to characterize layers from a few angstroms to 100 nm.Feature and specifications1) Wavelength 380 - 900 nm2) The measurement angle is set at 70o. Contact staff if you need a different or multipleangles.3) Auto sample alignment4) Fast data acquisition: 3 30 sec depending on the mode5) Light spot diameter 3 mm6) Focus probes reduce the light spot diameter to 0.3 mmSafety1) Keep hands/fingers/body parts away from the instrument when the sample stage ismoving.2) Never look directly into the light beam.Precautions
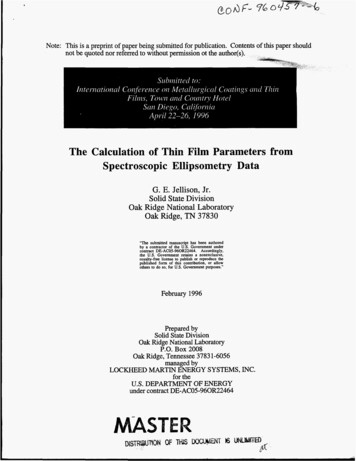
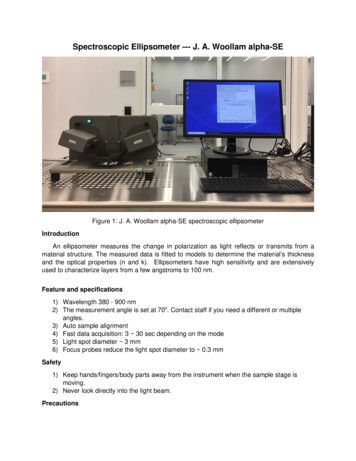
1) Contact staff if you need to use the focus probes.2) Turn off the equipment after use. The lamp has a limited lifetime.Operating Procedure1) Activate the equipment in FOM.2) Switch on the power switch of the ellipsometer.Angle ofIncidenceIndexerPower SwitchSource UnitDetector UnitSample vacuum switchSample Chuck (up to 8”)Figure 2: Parts of the ellipsometer3) Mount the sample on the sample chuck. Switch on the vacuum (Figure 2).4) Double click the ‘CompleteEASE’ on the desktop.5) The system will automatically initialize. Wait until ‘Waiting to Acquire Data’ is displayed(Figure 3).Figure 3: Set up data acquisitionSelect measurement ‘Mode’, ‘Sample Alignment’, ‘Model’ for data analysis, and whetherto ‘Save Data after Measurement’. Table 1 provides details for each of these choices.
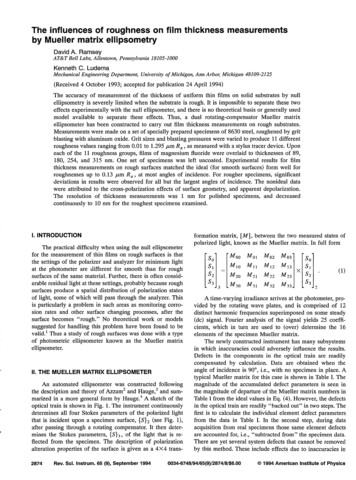
The measurement angle is set at 70o. Please contact staff if you need a different ormultiple measurement angles. If your sample is not well described by the models in thelibrary, select ‘None’ and build your model later (in step 8).Note: For most measurements, the “Standard” mode and “Standard” samplealignment sufficient.Please contact staff if you need to use focus probes. Otherwise, don’t check thebox of ‘Focuse Probes Installed’.Table 1: Measurement setting6) Click on “Measure”. The ellipsometer will align the Z-height to detect reflected light fromthe sample and then collect data.If a model is selected, the collected data will be analyzed to determine the film properties.Otherwise, go to the ‘Analysis’ tab after the measurement.If the “Save Data after Measurement” is checked, a dialog box will appear for saving thedata.7) If your sample cannot be described by the models in the library, you can build yourmodel following these steps:8.1) In Analysis tab, click ‘Open’ under ‘Model’. Select ‘Blank.mod’ in the Basic folder.(Figure 4)8.2) In Layer Commands, click ‘Add’. In the prompt window, click above the substrate(Figure 5)8.3) Choose the material of the film from the library. One material may have several filessourcing from different references. Please refer to the comment of each file (Figure 6).8.4) Similarly, click on the ‘Substrate Si’ and choose the substrate material.8.5) Click on the ‘Thickness #1 0.00 Å” next to the layer material. Enter the estimatedvalue of the thickness and check ‘Fit’ on the right (Figure 7).
8.6) If you don’t have a good estimation of the thickness, click the ‘ ’ on the left of the‘FIT Options’ to open the list and click the ‘OFF’ next to ‘Perform Thickness Pre-Fit’ toswitch it to ‘ON’ (Figure 7).Note: Here we only describe the most general case. If you have transparentfilms/substrates, absorbing layers, or materials not in the library etc., please contact staffand seek assistance for building a model.8.7) Click ‘Save’ under ‘Model’ to save the model.Figure 4: for step 8.1
Figure 5: for step 8.2Figure 6: for step 8.3 and 8.4
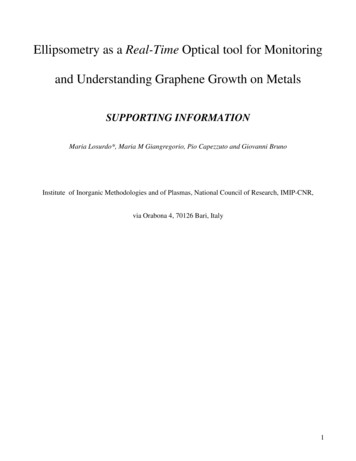
Figure 7: for step 8.6 and 8.78) Click ‘Fit’ under ‘Fit’ (Figure 8). The curves will be fitted and the results will be displayed.The parameter Mean Squared Error (MSE) is used to examine how well the model datafits the experimental data. The lower the MSE value, the better the data fit. A valuebelow 3 is considered excellent, below 20 is good.9) The n and k values can be displayed by clicking the data and choosing Pseudo Transforms (Figure 9)10) Right-click on the blank under ‘Fit’, you will be able to copy the MSE and thicknessvalues to a clipboard.Right click on the graph to copy the data to the clipboard.11) Open NotePad, paste and save the data.12) Turn off the vacuum and unload the sample.13) Close the ‘CompleteEASE’. Switch off the vacuum and the main power.14) Log off in FOM.
Figure 8: fit the curve and save the result.Figure 9: display n and k data.
An ellipsometer measures the change in polarization as light reflects or transmits from a material structure. The measured data is fitted to models to determine the material's thickness and the optical properties (n and k). Ellipsometers have high sensitivity and are extensively