Transcription
FY2017FINANCIAL RESULTS
DISCLAIMERImportant NoticeThis investor presentation has been prepared by EML Payments Limited ABN 93 104 757 904 (EML) and is generalbackground information about EML’s activities current as at the date of this presentation. This information is givenin summary form and does not purport to be complete. Information in this presentation should not be considered asadvice or a recommendation to investors or potential investors in relation to holding, purchasing or selling securitiesand does not take into account your particular investment objectives, financial situation or needs. Before acting onany information you should consider the appropriateness of the information having regard to these matters and seekindependent financial advice.An investment in EML securities is subject to known and unknown risks, some of which are beyond the controlof EML. EML does not guarantee any particular rate of return or the performance of EML.This presentation may contain forward looking statements including statements regarding our intent, belief orcurrent expectations with respect to EML’s businesses and operations, market conditions, results of operation andfinancial condition, capital adequacy, specific provisions and risk management practices. Readers are cautioned notto place undue reliance on any forward looking statements.Unless otherwise specified all information is for the year ended 30 June 2017, and is presented in Australian Dollars.EML Payments Results Presentation 20172
MORE OPPORTUNITYON A GLOBAL SCALE01 FY2017 OVERVIEWTom Cregan02 FINANCIAL OVERVIEWBruce Stewart03 OUTLOOKTom CreganEML Payments Results Presentation 2017Managing Director& Group CEOGroup CFOManaging Director& Group CEO3
MORE OPPORTUNITYON A GLOBAL SCALE01 FY2017OVERVIEW4
FY2017 OVERVIEWHIGHLIGHTS 4.42bnGROSS DEBIT VOLUME (GDV)348%Group GDV totalled 4.42bn, an increase of 348% to the prior year(AUD’ millions)50004000 3.55bnGDV generatedin North AmericaFull year impact of EML North America1existing customers at acquisition approx. 2.75bn20001000FY2017FY2016FY201548% of year on year GDV growth driven fromorganic customer acquisition0FY2014Growth fromorganic customer acquisitionAmericaEuropeAustraliaFY201348%30001. EML North America acquired 1 June 2016EML Payments Results Presentation 2017EML generates revenues from processing payment volumes of prepaid stored value products on ourprocessing platforms. The gross value of these transactions are defined as Gross Debit Volumes (‘GDV’)and are a key indicator of current & future revenues.5
FY2017 OVERVIEWHIGHLIGHTS 58.0mREVENUE149%Group revenue for FY2017 of 58.0m, up 149% on prior year(AUD’ millions)6050 38.1mRevenue generatedin North AmericaFull year impact of EML North America was 38.1mincremental revenue403020EML Payments Results Presentation 2017FY2017FY2016FY20150FY2014FY2018 Analyst consensus is for the Revenue / GDV metricto reduce to 100bps with an increase in GDV to 7—8bn10FY2013The Revenue / GDV metric reduced to 1.3% as a result of a shiftin mix from Non-Reloadable products to Reloadable and B2BVirtual Payments which generated 2.49bn of total GDVEML generates revenues from processing payment volumes of prepaid stored value products on ourprocessing platforms. The gross value of these transactions are defined as Gross Debit Volumes (‘GDV’)and are a key indicator of current & future revenues.6
FY2017 OVERVIEWHIGHLIGHTS 14.5mEBTDA189%Group EBTDA for FY2017 was 14.5m, up 189% on prior yearGroup continues to leverage scale with diversification acrosscurrencies, geographic regions, products, segments and customers(AUD’ 6FY2015FY2014EML generates interest income on Stored Value balances and as such is a source of core revenue.Earnings Before Tax, Depreciation & Amortisation (‘EBTDA’) is used as the most appropriatemeasure of assessing performance of the group.FY2013-4EBTDA includes R&D tax offset & excludes share based payments, and is reconciled to thestatutory profit and loss within the FY2017 Annual Report.EML Payments Results Presentation 20177
FY2017 OVERVIEWHIGHLIGHTS 302mSTORED VALUE 50mStored value closed at 302m, an increase of 50m or 16%on the prior yearExpectations of increases in the official interest rates wouldbenefit the group in future years(AUD’ millions)35030025020015010050EML Payments Results Presentation 2017FY2017FY2016FY2015EML generates interest on Stored Value balances as a function of prevailing interest rates,commercial agreements with our banks and the Stored Value balances.FY2014EML holds funds on behalf of our customers and cardholders across all regions and variousself issued and BIN sponsored programs. We refer to this as Stored Value.FY20130AmericaEuropeAustralia8
FY2017 OVERVIEWHIGHLIGHTSRESULTS — 5 YEAR CAGRRevenue 2017Gross Debit Volume 2017 4.4bn101%EBTDA 2017 58.0m(AUD’ millions)(AUD’ millions)50006063% 14.5m237%(AUD’ 054210-45EML Payments Results Presentation 01309
FY2017 OVERVIEWHIGHLIGHTSSUCCESSSuccessful Integration of EML USA and CanadaSuccessful launch of initial Reloadableprogram in the UK (bet365)PREPAIDVALIDTHRUSuccessful launch of initial Reloadableprogram in the USA (LuLaRoe)Successful launch of Salary PackagingReloadable programs in AustraliaEML Payments Results Presentation 201710
FY2017 OVERVIEWSUCCESSEML Payments Results Presentation 2017300020001000AcquisitionOrganic0FY2017Completed pilot testing1 on our first self-issuedReloadable program in Australia under ourdirect license with MasterCard4000FY2016EBTDA of 14.5m translated to operating cash flowof 12.3m25000FY2015GDV from our established Australian gaming verticalgrew by 59% on the prior year, driven by a 59% increasein issued cards in market(AUD’ millions)FY2014Signed several B2B Virtual Payments contracts in theUSA that will generate significant GDV in future periodsGDV (Organic vs Acquisition) 2017FY2013HIGHLIGHTSOrganic GDV derives from new customers not signed upon acquisition of either EML Europe or EML North America.Growth in GDV from existing customers on acquisition of either EML Europe or EML North America is treated asacquisition growth. EMLs ability to launch new programs from our acquisitions is key to our growth & diversification strategy.1. Partner progressed program to commercial launch in August 2017.2. Statutory operating cash flow was 19.3m which included 7m of breakage receipts which had not been paid out underour revenue sharing agreements.11
MORE OPPORTUNITYON A GLOBAL SCALE02 FINANCIALOVERVIEW
FINANCIAL OVERVIEWGROUP FINANCIALSPROFIT & LOSSRevenue( ’000s)FY 2016FY 2017% 58,097-14%Americas2,15329,0561249%GROSS ed payments(2,073)(5,317)-156%Depreciation and amortisation aEuropeAmericasTOTAL REVENUEOVERHEAD EXPENDITURE (Incl. R&D tax offset)AmericasEBTDA (Incl. R&D tax offset)Other non-cash itemsAdd back R&D offset incl. in EBTDANet Profit / (Loss) before taxIncome tax benefitNet profit / (loss) for the yearEML Payments Results Presentation 2017EBTDA EXCEEDED ANALYST CONSENSUSFY17 EBTDA of 14.5m exceeded analyst consensus of 14.3mSTRONG REVENUE GROWTHStrong revenue growth of 149% from prior year drivenby both acquisition and organic growthANALYST CONSENSUS OF FY18 GDV 7BN — 8BNStrong growth expected to continue with FY18 supported by astrong pipeline of opportunities across all regions supported byanalyst consensus of GDV ranging 7bn - 8bnACQUISITIONS PERFORMANCE ABOVE INVESTMENT CASENorth America businesses, acquired 1st June 2016, exceededinvestment case in first full year of EML ownership.13
FINANCIAL OVERVIEWGROUP FINANCIALSPROFIT & LOSSSalary Packaging successfully launchedin Australia on 1 July 2017Growth in Australia excludes any material impact from the key newvertical of Salary Packaging which successfully launched on 1 July 2017.Depreciated and amortisation expenseprimarily relates to intangible assets recognisedin accordance with AASB3 on acquisition ofEML Europe and EML North America.Share options expense of 5.3mIncludes 3.98m related to performance and retention of grantsin connection with the North America and European acquisitions.EML Payments Results Presentation 2017Eliminating the impact of adverse movementsin exchange rates would have seen an EBTDAhigher by 1.1m or 8%In local currency European EBTDAexceeded PY by 19%Europe negatively impacted by strengthening of AUD/GBPexchange rate following Brexit.USD exchange rates have weakened relativeto the AUD early in FY18 which could impactEBTDA by approximately 1.0m if rates remainat current levels14
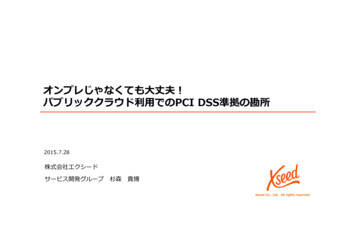
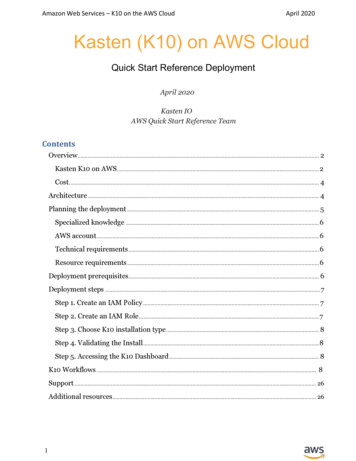
FINANCIAL OVERVIEWGROUP FINANCIALSPROFIT & LOSSBreakage comprised 52% of revenue, up from 43% in the prior year,largely due to the acquisition of EML North AmericaBreakage was 59% of revenues in the 1HFY17, so breakage hasdeclined as a percentage of revenue as Reloadable and B2B VirtualPayments increasedInterchange revenues increased from 10% to 17% of total revenues,driven by Reloadable and B2B Virtual Payments3%EML Payments Results Presentation 201715%17%52%FY2017EML expect that breakage will decline as a percentage of revenueto approximately 40% of total revenues in FY18Revenue streams increasingly diversified in Australia, continuedprogress in Europe & North America following launch of Reloadableprograms in FY17.6%11%43%FY201626%17%10%Establishment incomeTransaction Fee RevenueInterchange FeeBreakageOtherEstablishment incomeTransaction Fee RevenueInterchange FeeBreakageOther15
FINANCIAL OVERVIEWGROUP FINANCIALSPROFIT & LOSSGross Profit MarginOverheads as a % of revenue76.3%51.3%on PCPDown on PCP due to large B2B Virtual Payments contracts forprocessing only in North America and lower margin establishmentfees in Australia related to Salary Packaging vertical.(AUD’ 0208%9%400Improved 5.2% to 51.3% in FY17 as the group continues to seeleverage on its growing scale(%)605.2%ReloadableNon-ReloadableB2B Virtual PaymentsOther GPGross Profit MarginEML Payments Results Presentation 2017AustraliaEuropeAmericaEmployee EntitlementsProfessional FeesOffice ManagementICTTravel & AccomodationOtherEmployee EntitlementsProfessional FeesOffice ManagementICTTravel & AccomodationOther16
FINANCIAL OVERVIEWGROUP FINANCIALS 14.5mPROFIT & LOSS189%Another record year as EBTDA improved 189% to 14.5m withimproving EBTDA margin reflecting leverage on group scale(AUD’ millions)(%)163014125108-206EML Payments Results Presentation 2017-450-2-70FY2017FY2016-4FY2015In the absence of material year on year changes inNon-Reloadable GDV, the Group does not expect therewill be a material impact on earnings.2FY2014The new accounting standard confirms the Group accountingpolicy of accruing breakage revenue for expected residual fundson card expiry.4FY2013The Group expects to adopt AASB15 –Revenue from Contracts with Customers in FY19.17
FINANCIAL OVERVIEWGROUP FINANCIALSCURRENCYThe Group operates in 13 countriesthrough four reporting currencies(AUD, GBP, USD & CAD)Exchange rates moved adversely inthe year, at constant FY16 exchangerates the Group’s FY17 results wouldhave been approx. 3.2m of Revenueor 1.1m of EBTDA higher thanreportedThe region most impacted wasour European operations followingthe ‘Brexit’ vote and the resultingweakening of Sterling.At constant FY16 exchange ratesthe European operations EBTDAresult would have exceeded the priorcomparative period.EML Payments Results Presentation 201718
FINANCIAL OVERVIEWGROUP FINANCIALSBALANCE SHEETCash & Cash equivalents( ’000s)FY 2016FY 2017% INCREASECash and cash equivalents26,94239,87248%Breakage accrued8,81613,32651%Other receivables and other assets8,26614,92381%Deferred tax asset15,20118,83424%Receivables from financial 4120%Deferred Tax Liabilities2,7353,47527%Other ,206120,5811%( ’000s)FY 2016FY 2017% -100%Plant and equipmentGoodwill and intangiblesTOTAL ASSETSTrade and other payablesLiabilities to stored value account holdersTOTAL LIABILITIESCashflows from operating activitiesCashflows used in investing activitiesCashflows from financing activitiesEML Payments Results Presentation 2017 39.9m48%Cash & Cash equivalents were 39.9m,an increase of 48% to the prior yearBreakage accrual 13.3m51%Breakage accrual as at 30 June 2017 was 13.3m.More than 75% is expected to convert to cash in FY2018.Breakage accrual is up 51% to the prior yearReceivables from financial institutions and liabilities to storedvalue account holders relate to our self-issued programs andoffset each other19
FINANCIAL OVERVIEWGROUP FINANCIALSBALANCE SHEETDuring the year the group invested 3.6m inPayWith Worldwide, Inc. to increase our staketo a diluted c. 17% investment.Our investment in PayWith is accounted for within other receivablesPayWith is a financial technology companyfocused on building merchant coalitions.EML and PayWith have partnered on a number of programs, includingthe Salary Packaging solution, to differentiate that product in the marketInvested in additional development resourcingThe group invested in additional development resourcing to assistwith the launch of major new programs for Salary Packaging(Australia), Self-Issued Mastercard (Australia) and Reloadableprograms in USA and UKEML Payments Results Presentation 2017Group has significant tax lossesThe Group has significant tax losses, primarily in Australia & USAthat will be utilized in future periods and are recognized as adeferred tax assetOperating cashflow was a record 19.3mOperating cashflow included approximately 7m of breakage receiptswhich had not been paid out to our customers under our revenue sharingagreements. Excluding this amount, operating cashflow was 12.3mInvested in new premises for growing NorthAmerica businessThe group invested in the relocation of our USA business to a newfacility which was completed during the year20
REGIONAL SUMMARYAUSTRALIAGDVNEW SALARY PACKAGINGCOST CONTROLGDVGrowthRecurringRevenuesEBTDAAdvancesGDV from gaming verticalgrew 59% offsetting declinefrom lending and Non-Reloadablecards.Successfully launched a newSalary Packaging vertical with6 customers, first recurringrevenues in July 2017.We expect recurring revenueof more than 25m over thelife of the contracts.EBTDA improvement representsthe continuation of a 3 yearjourney of building scale and tightcost control.AGILITY & MARGINSRELOADABLE GAMINGProcessEfficiencyCardsGrew 59%Increased process efficiencyfollowing the successfulcompletion of our self-issuedproduct for Mastercard giving usthe ability to settle directly withMastercard improving our agilityand margins. SportsBet launchedon this product in August 2017.Our established Reloadablegaming vertical grew with cardsin market up 59% to exceed350,000 cards.EML Payments Results Presentation 201721
REGIONAL SUMMARYAUSTRALIAGross Debit Volume 671mRevenue18.4%Gross Profit 9.78m20.0%1080086007.3%( 0.17m)15.1%(AUD’ Y2014FY2017FY2016FY2015FY2014FY2013EML Payments Results Presentation 2017FY201320-2.52FY2013200-2.0FY20144FY20134000 7.09m(AUD’ millions)(AUD’ millions)(AUD’ millions)EBTDA22
REGIONAL SUMMARYEUROPERELOADABLE PRODUCTS LAUNCHEDRELOADABLE PRODUCT LAUNCHA STRONG FOCUS ONbet365LaunchProducts& MallsItalianFuel CardIn April 2017 we successfullylaunched our first winnings cardwith bet365.European focus is on Reloadableproducts & shopping mallopportunities.Our first Reloadable product inEurope commenced in FY17 withthe launch of an Italian fuel cardin partnership with TBS.BREAKING GROUND INNEW MALLS DELIVERINGReloadableProgramsOrganicGrowthWe expect these programs tobe the first of many Reloadableprograms in Europe in yearsto come.Organic growth delivered in FY17through launches of new malls incontinental Europe.STRENGTHENINGAUD vsGBP & EURRevenue reported in AUDdecreased due to thestrengthening AUD vs GBP &EURGAINED MOMENTUM INNonReloadableProgramsLaunched with Auchan, Bit Kash,Blackhawk, and Pandora.EML Payments Results Presentation 201723
REGIONAL SUMMARYEUROPE 8.1m14.2% 4.5m963100642503210000EML Payments Results Presentation 2017FY2017FY2016(AUD’ 15200FY20145FY201310FY201715FY2016250FY2015(AUD’ millions)FY2014(AUD’ millions)FY2013(AUD’ millions)3.8%FY201720.06%FY2016 10.1mEBTDAFY201514.3%Gross ProfitFY2014 207mRevenueFY2013Gross Debit Volume24
REGIONAL SUMMARYNORTH AMERICAEML Payments Results Presentation 2017COMMITTED TOLOOKING FORWARDSHOPPING North American businessacquired 1 June 2016 which atthat time was only providinggift card solutions to shoppingmalls. Focus in FY17 has been todiversify and provide Reloadableproducts and B2B VirtualPaymentsFY18 focus will remain on growthin the Reloadable and B2B VirtualPayments Verticals17 shopping malls were signed,including West Edmonton MallSTRONGSIGNED CONTRACTSOrganicGrowthNewCustomersSignificant organic growth inFY17 including signing LuLaRoeas first Reloadable client( 20% of FY17 GDV)Signed several B2B VirtualPayments contracts, includingWide Open West, Sprint andmost recently Mize Hauser25
REGIONAL SUMMARYNORTH AMERICAGross Debit Volume 3,546mRevenue1,382%(AUD’ millions)4,000Gross Profit 38.1m1,355% 29.1m1,252% 10.2m(AUD’ millions)(AUD’ millions)(AUD’ EML Payments Results Presentation 143,000FY20133026
GLOBAL OVERVIEWPRE-EXISTING 2017 CUSTOMER BRANDSNon-ReloadableEMLGROUPReloadableEML Payments Results Presentation 2017B2B VirtualPayments27
GLOBAL OVERVIEWNEW CUSTOMERS FY17 AND BEYONDNon-ReloadableEMLGROUPReloadableEML Payments Results Presentation 2017B2B VirtualPayments28
GLOBAL OVERVIEWNORTH AMERICA USA NEW LAUNCHESNon-Reloadable SegmentReloadable SegmentLargest shopping mall in North AmericaGenerated more than 20% of FY17 GDVWest Edmonton Mall, located in Edmonton, Alberta, Canada, is thelargest shopping mall in North America and the tenth largest in theworld by gross leasable area.First Reloadable product launched in 2HFY17.EML Payments Results Presentation 201729
MORE OPPORTUNITYON A GLOBAL SCALE03 OUTLOOK
OUTLOOKCOMPANY FUNDAMENTALS SCALABILITYEML operates in large, fast growingmarkets and holds a relatively smallmarket share, offering significantmarket potential in future years.Global Trends2:Growing shift towardsnon-cash paymentsRising demand for Open LoopPrepaid CardsGrowing popularity of VirtualPrepaid Payment CardsNORTH AMERICAREGIONEUROPEUS US 2.6bnEML GDV 2017US 3.1tnREGION156mEML GDV 2017US 1.77tnESTIMATED MARKET 20221ESTIMATED MARKET 20221Growing retailer acceptanceof card based paymentsAUSTRALIAREGIONUS 500mEML GDV 20171. S ource from ‘Prepaid Card Market By Card Type, Usage and Industry Vertical: GlobalOpportunity Analysis and Industry Forecast 2014-2022’ Allied Market Research dated 3/5/17);correlated to Mercator Advisory Group research forecast for Canada of CAD 710bn in 2018.2. S ourced from ‘Prepaid Cards: A Global Strategic Business Report’, April 2016, Global IndustryAnalysts, Inc. Forecast to 2020, extrapolated to 2022 by EML.EML Payments Results Presentation 2017US 18bnESTIMATED MARKET 2022231
OUTLOOKINNOVATIONWHY DON’T THE BIG BANKS DO THIS?12341 repaid-idUSBREA080XM201401092 ex-finds-serve-no-longer-serves/3 in/4 t-bank-in-the-us-exit-the-prepaid-businessEML Payments Results Presentation 201732
OUTLOOKA UNIQUE UTIONINNOVATIONBeing quick andresponsiveHigh level systemintegrationsB2B White labelledcustomised offeringDiligence andcommitment to localsupportConstantly evolvingproduct suite aimedat eliminating frictionpoints by being quickand responsiveLong-termexclusive contractsEML Payments Results Presentation 2017Full end to end solutioncomprising issuing,processing, fraudmonitoring, treasury,regulatory, customersupport and accountmanagement33
OUTLOOKINNOVATIONMORE THAN PLASTIC CARDSEML Payments Results Presentation 201734
OUTLOOKINNOVATIONINNOVATIVE E-WALLETTECHNOLOGYWEARABLESDIGITAL:THE PAYSEACHWAY CASHTOP-UP LOADINGEML Payments Results Presentation 2017Signed contract withFrank Green to providepayment services forreusable cups35
OUTLOOKKEY DATA 3 YEARSKEY METRICS ( ’000s)H1 2015AH2 2015AFY2015AH1 2016AH2 2016AFY2016AH1 2017AH2 2017AFY2017A6mnths6mnths12 mnths6mnths6mnths12 mnths6mnths6mnths12 mnthsHeadcount (closing)55555559150150168170170Average Headcount for the period405548577164158169160Gross debit volume (GDV) 194,006 253,509 447,515 383,419 602,302 985,720 1,930,241 2,492,532 4,422,774Non reloadable 100,572 152,033 252,605 178,432 133,088 311,521 438,181 223,003 661,184 93,434 101,476 194,910 204,986 251,941 456,928 272,565 999,628 1,272,193 0 0 0 0 217,596 217,596 1,219,495 1,269,902 2,489,397 91,196 75,330 75,330 131,499 219,620 219,620 392,819 302,001 302,001 380 434 814 399 496 894 549 647 loadableB2B Virtual PaymentsTotal Stored ValueInterest on Stored Value (excludes group funds)Effective Interest Rate (%)EML Payments Results Presentation 201736
OUTLOOKKEY DATA 3 YEARSKEY FINANCIALS ( ’000s)H1 2015AH2 2015AFY2015AH1 2016AH2 2016AFY2016AH1 2017AH2 2017AFY2017A6mnths6mnths12 mnths6mnths6mnths12 mnths6mnths6mnths12 mnthsRevenue (includes interest income) 5,079 9,357 14,437 10,560 12,751 23,311 32,440 25,520 57,960Non reloadable 2,933 7,469 10,402 8,820 9,934 18,754 28,206 19,707 47,913Reloadable 2,075 1,841 3,916 1,691 2,860 4,551 3,277 4,611 7,887 0 0 0 0 127 127 682 1,001 1,683 71 48 119 49( 170)( 120) 275 202 477Gross profit 3,746 7,538 11,284 8,121 10,080 18,201 25,433 18,813 44,246Non reloadable 2,511 6,187 8,698 6,907 7,841 14,748 22,307 14,922 37,229Reloadable 1,235 1,351 2,587 1,214 2,129 3,343 2,389 3,300 5,689 0 0 0 0 110 110 617 621 1,238 66 53 119( 13)( 193)( 206) 120( 29) 91( 3,603)( 5,400)( 9,002)( 6,059)( 7,636)( 13,695)( 16,040)( 15,074)( 31,114)( 292)( 55)( 347) 0( 456)( 456)( 35)( 15)( 51)Research and development credit 698 0 698 997( 6) 990 605 834 1,439EBTDA 549 2,084 2,633 3,058 1,981 5,040 9,963 4,558 14,52111%22%18%29%16%22%22%%31%18%25% 4,496 5,288 4,496 4,264 4,094 4,264 26,942 31,811 26,942Operating activities( 1,398) 1,046( 352) 317 1,661 1,978 9,640 9,615 19,255Investing activities( 11,105)( 2,070)( 13,175)( 543)( 34,012)( 34,555)( 4,888)( 1,594)( 6,482) 13,295 0 13,295 56 55,199 55,255 117 40 157 5,288 4,264 4,264 4,094 26,942 26,942 31,811 39,872 39,872B2B Virtual PaymentsGroup interest & adjustmentsB2B Virtual PaymentsGroup interest & adjustmentsOverheads (excl acquisition costs)Acquisition related overheadsEBTDA marginCash openingFinancing activities (incl FX)Cash closingEML Payments Results Presentation 201737
Interchange Fee Breaae Ote 15% 26% 10% 43% 6% Estasment nme Transaction Fee Revenue Interchange Fee Breaae Ote Breakage comprised 52% of revenue, up from 43% in the prior year, largely due to the acquisition of EML North America Breakage was 59% of revenues in the 1HFY17, so breakage has declined as a percentage of revenue as Reloadable and B2B .
![Index [beckassets.blob.core.windows ]](/img/66/30639857-1119689333-14.jpg)