Transcription
ostLEXINGTON’S HOMELESSSCHOOL CHILDRENAugust 2016AbstractWide differences exist in the incidence of homelessness in elementary schools in Fayette CountyLexington Fair Housing Council207 E Reynolds Rd #130, Lexington, KY 40517lexingtonfairhousing.com
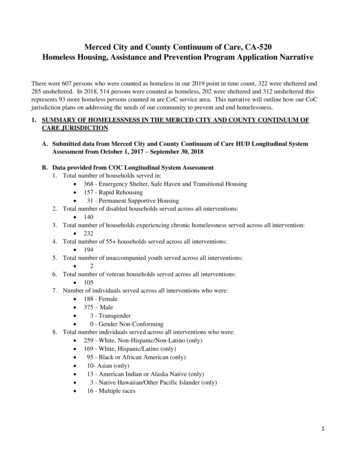
data points comparing each school in thedistrict as part of its School Report Cardprogram.In August 2015, the Lexington HeraldLeader published an investigative storyabout homeless school children inKentucky. Major highlights from thisarticle are summarized in Appendix A. Inbrief, the report noted that Kentucky hasthe highest rate (nearly 5%) of homelessschool children of any state in the UnitedStates. The report also noted that theproblem is increasing, funding forsolutions is scarce, and familyhomelessness has profound negativeimpacts on children’s educationalachievement.In an effort to better understandhomelessness in our schools, theLexington Fair Housing Council hasundertaken an analysis of this mostrecent data in Fayette County schools. Asindicated in the following table,homelessness among students in FayetteCounty has been increasing dramatically.For all grades in aggregate, the increaseover this three-year period was 94%,nearly doubling since 2013. Althoughschool officials indicate that some of thisincrease resulted from improved effortsto ascertain homeless status amongchildren in school, there is no doubt thatnumbers have increased significantly.In the fall of 2015, Fayette County PublicSchools released its final tabulation ofhomeless school children (for school year2014-15) along with a number of otherTABLE 1: NUMBER OF HOMELESS STUDENTS REPORTED IN FAYETTECOUNTY PUBLIC SCHOOLS OVER THE LAST THREE 117%165%147%Grade 1292127Aggregate Total410644795Source: Kentucky Department of Education200%94%Fayette CountyAge 3-5KindergartenGrade 01Grade 02Grade 03Grade 04Grade 05Grade 06Grade 07Grade 08Grade 09Grade 10Grade 111
A detailed comparison of eachpoints, including state percentileelementary school in the district is listedrankings, eligibility for the free andin Table 2. There are wide differences inreduced lunch program, the percentagethese schools’ data. Homeless rates varyof minority students as well as thefrom 0% to as high as 11.52%. There isspending levels per pupil.also significant variation in other dataTABLE 2: ELEMENTARY SCHOOL DATA IN FAYETTE COUNTYSchoolArlington Elementary SchoolAshland Elementary SchoolAthens-Chilesburg Elem.Booker T WashingtonBooker T Washington PrimaryCardinal Valley ElementaryCassidy ElementaryClays Mill ElementaryDeep Springs ElementaryDixie Elementary MagnetGarden Springs ElementaryGlendover ElementaryHarrison ElementaryJames Lane Allen Elem.Julius Marks ElementaryLansdowne ElementaryLiberty ElementaryMadeline M Breckinridge ElemMary Todd Elementary SchoolMaxwell Spanish ImmersionMeadowthorpe ElementaryMillcreek ElementaryNorthern Elementary SchoolPicadome ElementaryRosa Parks ElementaryRussell Cave ElementarySandersville ElementaryScapa At BluegrassSouthern ElementarySquires ElementaryStonewall ElementaryTates Creek ElementaryVeterans Park ElementaryWellington ElementaryWilliam Wells Brown Elem.Yates Elementary 121088012024142445PercentHomeless% Free &ReducedMay 2014-15SchoolAverageYears 99329699697893459999203267SpendingPer Pupil2014-15 ,180Sources: Kentucky Department of Education and Fayette County Public Schools2
Similar tables for middle schools andhigh schools in the district are includedin Appendix B.surpassing the state’s high level of 5%. Instark contrast, there are three Lexingtonelementary schools with no homelesschildren at all (a rate of 0%).An analysis of the data on elementaryschools reveals that there is widedisparity between schools in Lexingtonon a number of ranking criteria. Perhapsmost surprising is the relative disparityin the incidence of homelessness amongschool children. In fact, two elementaryschools in Lexington have rates ofhomeless children exceeding 11%, farIn an effort to provide some meaningfulcomparison of all this information it wasdecided to compare the data onelementary schools by grouping theschools most impacted by homelessnessagainst the data on the schools leastimpacted. That comparison is included inTable 3 below.TABLE 3: COMPARISON OF ELEMENTARY SCHOOLS LEAST AND MOST IMPACTED BY ss2014-15PercentHomelessPercentFree &ReducedLunchMay 06317323333.07.57.45.49.57.37.4 14.815.614.1 8,7368,5188,6618,7099,3588,796FIVE ELEMENTARY SCHOOLSWITH THE HIGHEST HOMELESS PERCENTAGE41William Wells Brown Elem.35642Harrison Elementary36648Deep Springs Elementary54542Yates Elementary School53735Millcreek Elementary4652269FIVE ELEMENTARY SCHOOLSWITH THE LOWEST HOMELESS PERCENTAGE1Rosa Parks Elementary7271Sandersville Elementary7450Maxwell Spanish Immersion5180Stonewall Elementary6700Veterans Park ileRank2014-15SchoolAverageTeacherYears ofExperienceSources: Kentucky Department of Education and Fayette County Public SchoolsIt should be noted that disparitiesbetween local schools are moreprominently noticeable at the elementaryschool level because the attendancezones at the elementary level are so muchsmaller than at the middle or high schoollevel. Larger attendance zones tend tohide differences among neighborhoodsas multiple areas are captured.SpendingPer Pupil2014-15In comparing the elementary schools inTable 3 there are notable differences.While homelessness is essentially nonexistent (.06%) at the five least impactedschools, the homeless rate at the fivemost impacted schools averages 9.17%.Other data points illustrate that minoritystudents are disproportionately affectedas the most impacted schools have twice3
the rate of minority student enrollment(66%) as do the least impacted schools(33%).Economic differences within schoolsystems are often highlighted whencomparing eligibility for the free andreduced lunch program. Since eligibilityfor this program is determined based onhousehold income it is a useful proxy foreconomic differences. As is indicated inTable 3, schools with a majority ofstudents from lower income familieshave much higher rates of homelessnessthan those of the least impacted schools.The percentage of students eligible forthe free and reduced lunch program isnearly three-and-half times higher(85.2%) at the most impacted schoolsthan it is at the least impacted schools(25.2%).Each school in Kentucky is allocated apercentile ranking by the state based onits overall academic performance. InTable 3 the least impacted schools havemuch higher percentile rankings thanthose most impacted by homelessness.The five most impacted schools have anaverage percentile ranking of 33.0 whilethe least impacted schools score nearlythree times higher at an average of 96.2.Another significant difference in theseschools is the average years of experienceof their teaching staff. As the tableindicates, at the five schools leastimpacted by homelessness, the averageyears of experience of the teaching staff is14.1 years, while the average years ofexperience at the five schools mostimpacted is about half that (at 7.4 years).Interestingly, the spending per pupil atthe schoolsmost impacted byhomelessness is greater on average thanthat of those least impacted. Some of thisgreater expense is related to higher costsassociated with providing the free andreduced meals as well as added socialservices targeted to at-risk students butthe vast majority of the per pupil variancederives from economies of scale. TheState Department of Education statedthat the added cost per eligible pupil forthe free and reduced lunch program isapproximately 661 per year. However,since the years of experience of theteaching staff is so much greater in theleast impacted schools it is likely thatsalary costs are also greater and morethan likely will offset any added costsassociated with meals provided free or atreduced cost. As noted in Table 3 theaverage difference in spending per pupilbetween these two groups of schools is 2,395.Since the average size of the leastimpacted schools is 657 pupils while theaverage size of the most impacted schoolsis 454 pupils, the calculation of spendingon a per pupil basis is significantlyimpacted by the number of students withwhich all costs are divided. More staticcosts like administration are spread overmore students at larger schools.Authorities at the State Department ofEducation noted that the spending perpupil category has only recently beenadded to the School Report Card (this isonly the second year it has beenincluded). There are wide variations inhow districts calculate these costs. Over4
time it is hoped that greater levels ofstandardization will enable meaningfulcomparisons of these numbers betweendistricts but, for the present, individualdistricts are the only source for data onhow their expenses are calculated.What conclusions can be made from thisanalysis? Much like the proverbial“canary in a coal mine,” higher rates ofhomelessness are an indicator ofincreased neighborhood challenges.Schools located in poorer neighborhoodsare likely to have higher numbers ofstudents determined to be homeless.Often these neighborhoods are overrepresented by people of color, as are thestudents classified as homeless.These schools are also much more likelyto score low on state percentile rankings,in most cases significantly lower. Asnoted earlier, student t. Although this presents agreater challenge to each student, it is notlikely a significant factor in a school’soverall ranking. Ultimately this involvesan assessment of cause and effect.Although homelessness may contributeto lower school percentile rankings as aminor contributing factor it clearly ismoreillustrativeoftheotherneighborhood challenges that impact allthe students at the school. A student froma family that has slipped intohomelessness is not a cause but an effectof the challenges of the local community.The disparity in teaching experience inthis comparison is a real concern. Anobvious conclusion from this analysis isthat some schools face significantlygreater challenges in educating theirstudents than other schools. If we arecommitted to providing all our studentswith an excellent education, it is vital thatschools with greater challenges beaccordedgreaterattentionandresources.The huge difference inteaching experience between these twogroups of schools highlights the fact thatthe schools that need the most attentionseem to be garnering the least.Recommendations1. This analysis highlights the need forthe district to focus greater attentionand resources toward schools withthegreatestchallenges.Lowperforming schools should beaccorded a “preferential option” whenallocating resources and teachingexpertise.2. Specific attention should be accordedto seeking additional outside fundingto address homelessness amongstudents in the district. It isimportant that such funding betargeted specifically to those schoolsmost impacted by homelessnessrather than adopting district-wideprograms to address the issue.Special attention should be devoted atthe elementary school level where thechallenges seem to be the greatest.3. Homelessness is highest in schoolsthat are located in neighborhoodswith multiple challenges. Efforts toimproveschoolingintheseneighborhoods are much more likelyto succeed if such efforts involve thewhole neighborhood and adopt5
comprehensive approaches that seekthe commitment of all stakeholders inthe neighborhood. Education thrivesbest with multiple opportunities forreinforcement and support beyondthe classroom.4. Collaborative efforts to improvestruggling neighborhoods should alsobe a focus for city government as well.City funding should be targeted toareas of greatest need by supportingjoint efforts among all departmentswithin the city as well as the broadestpossible inclusion of neighborhoodstakeholders.6
Appendix AHighlights from Lexington Herald Leader article (Aug 29, 2015) There are more than 30,000 homeless students in Kentucky, which has the highest rateof student homelessness in the nation, according to a Herald-Leader analysis of federaleducation data.Nearly 5 percent of Kentucky's 685,167 students were classified as homeless in the 201213 school year, the latest year that homeless student totals are available for all 50 states.Kentucky's rate of homeless students was more than double that of all surrounding statesbut West Virginia (2.94 percent) and Missouri (2.89 percent). In five Eastern Kentuckycounties, more than 1 in 5 students are considered homeless by school districts.The number of homeless kids in Kentucky schools has nearly doubled in less than six years.Federal funding for homeless students in Kentucky has remained flat for the past fiveyears at about 1 million, data from the state Department of Education shows. Schoolsystems apply for the funding — called a McKinney-Vento grant — through a competitivegrant process.Fayette County received just 52,000 in federal McKinney-Vento grants during each ofthe past three years. It will receive 49,000 each of the next three years. In addition,Fayette County and other school districts use Title 1 funding — a federal program to helpeducate poor students — to augment the McKinney-Vento money.NEGATIVE IMPACT ON EDUCATIONAL ACHIEVEMENT: On Kentucky's year-end test, thepercentage of homeless students scoring proficient or distinguished in math and readingwas 15 to 18 points lower than the student population as a whole in 2013-14.In Lexington, the achievement gap is even wider. No student identified as homelessscored distinguished — the highest category — in reading at the elementary school level,and 65 percent of homeless elementary students scored novice. In comparison, only 23percent of non-homeless elementary students in Lexington scored novice in reading, and25 percent scored distinguished. Of the homeless students in Fayette County whoreceived letter grades during the 2013-14 school year, 50 percent had at least one "D"and 43 percent had at least one "F."According to a 2014 report from America's Promise Alliance, homeless students are 87percent more likely than their peers to drop out of school before graduation.The U.S. Department of Housing and Urban Development conducts the nation's officialcount of homeless people, but HUD's definition of homeless does not include childrenwho are "couch surfing" with friends and family because their parents can't keep stablehousing. Education officials do. That means the "official" homeless count leaves most ofthese kids out.7
Appendix BMiddle School and High School Data ChartsTABLE 4: MIDDLE SCHOOL DATASchoolBeaumont Middle SchoolBryan Station Middle SchoolCrawford Middle SchoolEdythe Jones Hayes MiddleJessie M Clark MiddleLeestown Middle SchoolLexington Trad. MagnetMorton Middle SchoolSouthern Middle SchoolTates Creek Middle SchoolWinburn Middle 9725898,498128PercentHomeless% ears 41Sources: Kentucky Department of Education and Fayette County Public SchoolsTABLE 5: HIGH SCHOOL DATASchoolBryan Station High SchoolHenry Clay High SchoolLafayette High SchoolPaul Laurence Dunbar HSTates Creek High eless% %40.5%439494878480Sources: Kentucky Department of Education and Fayette County Public SchoolsSchoolAverageYears ngPer Pupil2014-15 62910,6009,565SpendingPer Pupil2014-15 8,4177,3157,6097,5637,9327,7678
In August , the Lexington Herald 2015 Leader published an investigative story about homeless school children in Kentucky. Major highlights from this article are summarized in Appendix A. In brief, the report noted that Kentucky has the highest rate (nearly 5%) of homeless school children of any state in the U nited States.

