Transcription
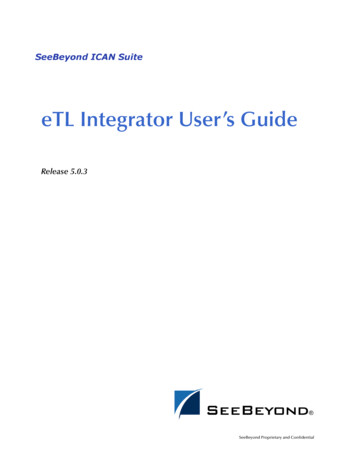
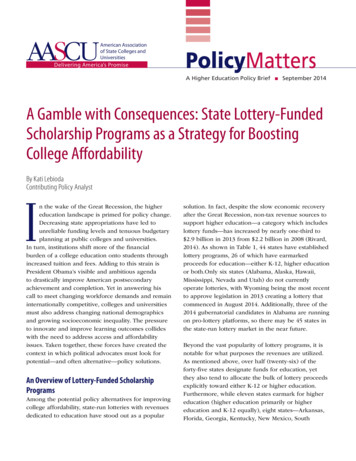
American Associationof State Colleges andUniversitiesDelivering America’s PromisePolicyMattersA Higher Education Policy BriefnSeptember 2014A Gamble with Consequences: State Lottery-FundedScholarship Programs as a Strategy for BoostingCollege AffordabilityBy Kati LebiodaContributing Policy AnalystIn the wake of the Great Recession, the highereducation landscape is primed for policy change.Decreasing state appropriations have led tounreliable funding levels and tenuous budgetaryplanning at public colleges and universities.In turn, institutions shift more of the financialburden of a college education onto students throughincreased tuition and fees. Adding to this strain isPresident Obama’s visible and ambitious agendato drastically improve American postsecondaryachievement and completion. Yet in answering hiscall to meet changing workforce demands and remaininternationally competitive, colleges and universitiesmust also address changing national demographicsand growing socioeconomic inequality. The pressureto innovate and improve learning outcomes collideswith the need to address access and affordabilityissues. Taken together, these forces have created thecontext in which political advocates must look forpotential—and often alternative—policy solutions.An Overview of Lottery-Funded ScholarshipProgramsAmong the potential policy alternatives for improvingcollege affordability, state-run lotteries with revenuesdedicated to education have stood out as a popularsolution. In fact, despite the slow economic recoveryafter the Great Recession, non-tax revenue sources tosupport higher education—a category which includeslottery funds—has increased by nearly one-third to 2.9 billion in 2013 from 2.2 billion in 2008 (Rivard,2014). As shown in Table 1, 44 states have establishedlottery programs, 26 of which have earmarkedproceeds for education—either K-12, higher educationor both.Only six states (Alabama, Alaska, Hawaii,Mississippi, Nevada and Utah) do not currentlyoperate lotteries, with Wyoming being the most recentto approve legislation in 2013 creating a lottery thatcommenced in August 2014. Additionally, three of the2014 gubernatorial candidates in Alabama are runningon pro-lottery platforms, so there may be 45 states inthe state-run lottery market in the near future.Beyond the vast popularity of lottery programs, it isnotable for what purposes the revenues are utilized.As mentioned above, over half (twenty-six) of theforty-five states designate funds for education, yetthey also tend to allocate the bulk of lottery proceedsexplicitly toward either K-12 or higher education.Furthermore, while eleven states earmark for highereducation (higher education primarily or highereducation and K-12 equally), eight states—Arkansas,Florida, Georgia, Kentucky, New Mexico, South
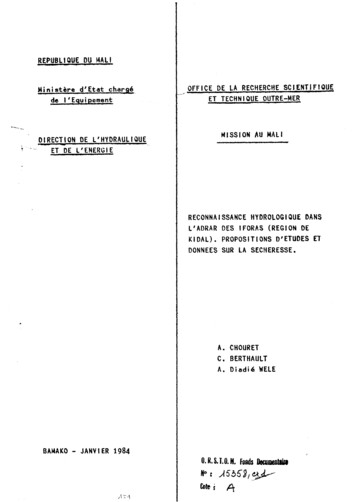
PolicyMattersTable 1: Primary Earmarked Use of State-Run Lottery Program RevenuesElementary andSecondary EducationK-12 andPostsecondary EducationPostsecondaryEducationEducation andOther SpecificNew Hampshire (1964)Washington (1982)S. Carolina (2002)New Jersey (1970)New York (1967)California (1984)Tennessee (2003)Oregon (1984)Michigan (1972)Florida (1986)Arkansas (2009)W. Virginia (1984)Ohio (1973)Missouri (1986)Nebraska (1992)Illinois (1974)Kentucky (1989)Vermont (1976)Georgia (1992)Arizona (1980)New Mexico (1996)Virginia (1987)Oklahoma (2005)Idaho (1989)Texas (1991)N. Carolina (2005)General FundConnecticut (1971)Maryland (1973)Delaware (1976)Rhode Island (1976)Iowa (1985)Montana (1986)S. Dakota (1986)Minnesota (1989)Louisiana (1990)Maine (1990)N. Dakota (2004)Wyoming (2013)Other SpecificMassachusetts (1971)Pennsylvania (1971)Colorado (1983)Kansas (1986)Indiana (1988)Wisconsin (1988)Note. Table template from “Earmarked lottery profits: A good bet for education finance?” by Neva Novarro, 2005. p. 27. Information on dates founded and distribution of funds taken directly from individual state lottery websites. Yearsrepresent the passage of legislation or amendments that established the legality of a state-run lottery; the lotteries typically began awarding winners about one year after this date. This table represents the primary usage of funds,though it should be noted that in the states that designated “elementary and secondary education” or “postsecondary education,” excess funds are typically designated for the other education subsection.Carolina, Tennessee and West Virginia—use thelottery to fund merit-based scholarship programsspecifically.The Georgia HOPE Scholarship Program Begins aTrendMost scholars attribute state-run lottery growthin the past two decades to the success of theGeorgia HOPE (Helping Outstanding PupilsEducationally) scholarship program. Established in1993, the Georgia HOPE program initially providedscholarships for students with a minimum highschool GPA of 3.0 to cover the full tuition at an instate public institution or a set amount to be appliedto a private college or university in the state. Whilethese award limits changed in 2011, not only hasthe Georgia HOPE program increased the numberof students who stayed in-state for college, it alsodrastically increased the average competitiveness—orincreased ACT/SAT scores and GPAs—of students2attending public institutions in Georgia (Campbell,2003; THEC, 2012).Following the success of the Georgia HOPE program,many other states, mainly in the southeastern U.S.,subsequently attempted to replicate this programand its benefits; some even went so far as toborrow the HOPE name. Tennessee, for example,has two HOPE programs—GAMS (HOPE with amerit-based supplement) and ASPIRE (HOPE witha need-based supplement). In 2012, the TennesseeHigher Education Commission sought to comparelottery-funded merit-based scholarship programs toinvestigate differences in eligibility rules, changes tothe programs over time, and how the programs aretied to access and competition rates.Table 2, whichhas been updated from the findings in that reportto reflect the most recent data available, comparesthe eight states with lottery-funded, merit-basedscholarship programs.
PolicyMattersTable 2: Overview of State Lottery-Funded Scholarship ProgramsArkansasFloridaGeorgiaKentuckyNew MexicoSouth CarolinaTennesseeWest VirginiaYear Implemented20101997199319991996199820042002Number ofof StudentsServed 465,5149,954Total ProgramCosts in2012–2013 134M 312M 463M 102M 61M 238M 277M 48M2012–20133 2,7724Public 1,300Tuition only 5,0008 6,0006 4,500 74 – 218Based on GPA (4-year)(4-year)(per-hr-rate)bonus awards 3,000 2,250Private (2-year)7(2-year) 1,854(semester) 1,236(quarter) 4,750MaximumAward(per year, unlessotherwise noted)AverageAward1 3.988 1,915 3,954 1,495 1,881 5,262 3,980 4,794Scholarships as a% of AveragePublic 4-yearTuition & Fees255.1%( 7,238)30.2%( 6,336)50.5%( 7,823)17.2%( 8,692)31.4%( 5,987)47.2%( 11,138)49.5%( 8,036)76.7%( 6,251)Funds RemedialCourses?YesNoNoYesYesNoYesYesFunds SummerCourses?NoNo5YesNoNoYesYesYesNotes. Table template from “A Comparison of States’ Lottery Scholarship Programs,” by the Tennessee Higher Education Commission, 2012. pp. 9, 17. Figures updated using information found directly from state program websites andstate finance annual reports. Year scholarship program was implemented may differ from the year the state lottery was implemented, as denoted in Table 1.1Average Award is a derived variable modeled off the THEC report, using the number of students and total program costs in most recent year.2The source for average public four-year tuition and fees is The College Board r-time).3Starting in 2013–2014, Arkansas now awards 2,000 per year at a two-year institution, and offers awards that increase each year for students at a four-year institution ( 2,000 [1st], 3,000 [2nd], 4,000 [3rd], 5,000 [4th]).4The award amount in Florida is provided on a per credit-hour basis and varies among different types of institutions. This calculation is based upon a four-year institution and 18 credits per /SSFAD/bf/awardamt.htm).5Florida will fund two semesters per year, typically the fall-spring semesters. If a student enrolls in the new spring-summer model, only spring-summer will be funded.6The exact HOPE award amounts by institution can be found at http://www.gsfc.org/main/publishing/pdf/2012/hope award amounts.pdf.7Tennesse divides the maximum award among three semesters if a student chooses to enroll in summer.8In South Carolina, students on LIFE and Palmetto Fellows scholarships in eligible math and science programs are also eligible for additional “Enhancement” funds on top of the maximum scholarship award.3
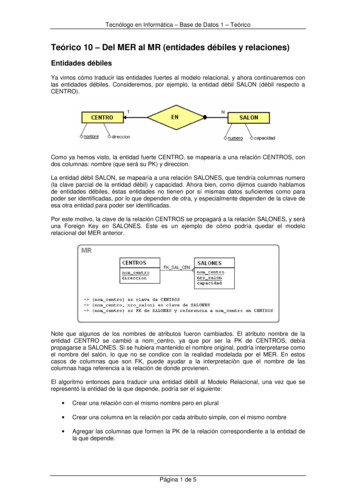
PolicyMattersTable 3: Minimum Initial Eligibility Criteria for Base Lottery Scholarship ProgramsStates that require bothACT/SAT and HSGPAStates that require either ACT/SAT or HSGPAOtherFloridaWest VirginiaGeorgiaTennesseeArkansasHigh School3.03.03.03.02.5GPAKentuckyNew Mexico South Carolina22.5 3.0(for base award)ACT/SAT26 ACT/22 ACT/85% or higher21 ACT/19 ACT1170 SAT1020 SATon SAT/ACT980 SAT15 ACT/710 SAT(for bonus award)Core CourseRequirementsYesYesYes24 ACT/1100 SATYesCollege GPA2.5High SchoolTop 30%RankingCommunityService75 hoursrequired20 hoursencouragedNote. Table from “A Comparison of States’ Lottery Scholarship Programs,” by the Tennessee Higher Education Commission, 2012. p. 12. Figures updated using information found directly from state program websites and state financeannual reports.1Georgia’s Zell Miller, Florida’s Academic Scholars (FAS), South Carolina’s Palmetto Fellows Scholarship, and Tennessee’s General Assembly Merit Scholarship (GAMS) have higher requirements than their base programs, but also provideadditional awards.2South Carolina requires applicants to meet at least two of these three thresholds.Comparing Lottery-Funded, Merit-BasedScholarship ProgramsLottery-funded programs range in size and costfrom state to state. Florida served the largestnumber of students (162,980) and spent thesecond highest amount of any state— 312 million.Georgia, near the top of the list in terms of bothreach and expenditures, served 117,085 students ata cost of 463 million. On the opposite end, WestVirginia has the smallest program, serving 9,954students at a cost of 48 million. The average awardranged from 1,500 (Kentucky) to over 5,000(South Carolina), with six of eight lottery-fundedscholarship programs covering between one-thirdand one-half of the average cost of publishedtuition and fees at that state’s public institutions.4The outliers, Kentucky and West Virginia, had thelowest and highest percentages at 17.2 percent and76.7 percent, respectively. Given that the averageaward in Kentucky is also the lowest of any state’sprogram, the lower proportion of coverage is notsurprising. In terms of service to students, half ofthe programs cover summer courses and half coverremedial courses: Tennessee and West Virginia coverboth, while Florida covers neither. Finally, each ofthese programs also has minimum initial eligibilityrequirements, which are discussed in Table 3.Lottery Proceeds for Education Can GainBipartisan SupportLotteries are politically popular sources ofadditional state revenue and can be successful
PolicyMatterspolicy solutions that address some of the currentchallenges on the higher education landscape. Forone, as demonstrated by Georgia’s HOPE program,lottery-funded scholarships can act as a lever toencourage the best and brightest students to remainin-state while promoting a college-preparatorycurriculum and the high academic achievementnecessary to qualify for these programs (Ness &Mistretta, 2009). Furthermore, even in an increasinglypartisan political arena, lotteries still manage torally support from both sides of the aisle. On onehand, when revenues are earmarked for education,lottery programs can act as a symbol for improvedaccess, affordability and opportunity for all studentsin the state. These ideals are ones that tend toalign with the liberal platform. On the other hand,lotteries create a new revenue stream, tappinginto dollars previously lost to citizens playinglotteries in neighboring states, while simultaneously“exporting” taxes to external players. When out-ofstate individuals participate in a new lottery game,they put dollars into a system from which they donot later benefit—this extra revenue theoreticallyeliminates the need to tax all residents in favor ofcollecting revenues from individuals who voluntarilyparticipate in games. Eliminating the need for abroad-based, compulsory tax aligns well with moreconservative values. In short, not only do lotteriesappear to address the college affordability issues thatare currently center stage in the media and in thelegislative arena, but, and perhaps more importantly,they are also able to garner enough political tractionto gain requisite legislative support to ensuresustained viability.Outcomes and Aftermath of State-Run LotteryScholarship ProgramsWhile lotteries, on the surface, appear to be apositive policy solution to increase revenuesand support college access, the literature on theoutcomes of state-run lotteries indicates thatsuch programs do not live up to their anticipatedbenefits on many fronts. Many of these factors areintertwined and amplify one another. For example,the instability and unpredictability of lotteryrevenues often leads to more stringent eligibilityrequirements for scholarships, which in turn canresult in more funds being disproportionatelydistributed to the wealthiest families. Yet, despitethe fact that many issues exacerbate one another,repercussions of lottery-funded scholarship programscan be roughly divided into three categories: issuesof finance, issues of access, and issues of politics andphilosophy. Each is discussed in greater detail below.Issues of Finance: “New” and “Protected” RevenueStreamsWhile lotteries appear to create a new sourceof non-tax revenue, actual proceeds rarelymatch projections. When a state first establishesa new lottery, it does draw funds previously lostto neighboring states’ lotteries, but these initialgains tend to decay or drop off after about fiveyears (Covert, 2014; Heberling, 2002; Land &Alsikafi, 1999). Part of this trend results frominterstate competition for lottery dollars—additionalsurrounding states each enact their own lotteryto join the fray, and states with existing lotteriesdevelop new games to regain the revenues lost tocompeting states (Tosun & Skidmore, 2004). Thelargest contributing factor, however, may be theinherently inefficient profit margin of lotteries: afterpayments to winners, sales commissions to vendors,and lottery administration expenses, only about 34cents of every dollar generated by lotteries ends upin the state budget (Bowden & Elrod, 2004; Covert,2014). For comparison purposes, states typicallyspend less than 1 percent of the amount collectedto acquire traditional tax revenues. Moreover, someresearchers argue that when considering their highadministration costs, lotteries affect state economiesnegatively, not positively, because dollars spentgambling could have otherwise been spent onconsumer goods and services and could be subjectto less wasteful collection methods of sales tax(Bowden & Elrod, 2004).5
PolicyMattersNot only are lottery revenues more expensive tocollect than traditional tax revenues, but they alsotend to supplant, rather than supplement, generalstate appropriations for education. In fact, whenlottery funds are earmarked for education, the risk ofsupplanting over supplementing actually increases.Numerous studies in the past three decades havefound that while educational expenditures tend toincrease immediately in states that enact lotteries,overall spending tends to decrease over time.States without lotteries, on the other hand, end upspending approximately 10 percent more of theirbudget on education than states with lottery fundsearmarked for education (Covert, 2014; Heberling,2002). This trend is particularly indicative of theunintended, counterintuitive negative consequencesof employing lottery programs to support education.Lottery revenues are actually a fairly smallrevenue stream, generally comprising less than2 percent of state appropriations to education(Covert, 2014; Land & Alsikafi, 1999). Despitethis low proportion, citizens in lottery statestend to vote against ballot initiatives intended toincrease educational expenditures because thelottery proceeds and education are so visiblylinked (Heberling, 2002). Legislators, on theother hand, often take advantage of the windowcreated by lottery revenues and the subsequentpublic satisfaction with the level of educationalexpenditures by reallocating general educationfunds to other high-need areas like corrections orhealthcare (Heberling, 2002; Land & Alsikafi, 1999;Tollefson, 2009).Issues of Access: Strategies for Enhancing CollegeAffordabilityLottery-funded scholarships are typically lastdollar programs, which means awards covertuition and fees once Pell grants and otherfinancial aid (except loans) have been exhausted.Many of the programs listed in Table 2, above,require students to submit a Free Application for6Federal Student Aid (FAFSA) in order to be eligiblefor the state’s program.Pell grants are inverselyrelated to scholarship dollars because most programscap potential funding at a set amount or the costof tuition, whichever is lesser. Therefore, if twostudents have the same tuition bill, but one qualifiesfor Pell and the other does not, the result is that thestate will spend more award funds on the wealthierstudent with no federally recognized financial needthan the student who qualifies for the maximum Pellgrant. Moreover, because scholarship dollars onlycover outstanding tuition and fees once all otherfinancial aid has been accounted for, low-incomestudents do not receive grant or scholarship dollarsabove and beyond tuition costs, leaving them tostruggle to pay for books, transportation, housing,childcare, and other non-tuition expenses involvedin pursuing a postsecondary education. In short, lastdollar tuition scholarships do not correct inequity incollege access and affordability across socioeconomicbrackets; in fact, when the scholarships are meritbased instead of need-based, these programs tend toincrease inequity instead of alleviating it.Overall, the trend in higher education has shiftedaway from need-based aid. While the majority ofstate-based student financial aid is in the form ofneed-based grants, long-term trends show greaterincreases in non-need-based aid, according to theNational Association of State Student Grant & AidPrograms’ (NASSGAP) 43rd Annual Survey, whichused data from the 2011–2012 academic year.Need-based grant aid increased from 3.86 billionin 2001–2002 to 6.95 billion in 2011–2012, a 79.9percent increase. Non-need-based aid, on the otherhand, increased from 1.27 billion to 2.4 billion,a 91.9 percent increase, over the same time frame(NASSGAP, 2013). Further, eight states—California,New York, Texas, Pennsylvania, Illinois, New Jersey,Washington and North Carolina—collectivelyawarded 70 percent of all need-based grant aidawarded by states (2013). It is notable that noneof these states have a lottery-funded scholarship
PolicyMattersTable 4: Expenditures for Undergraduate Student Aid Programs, by Type,in States with Lottery-Funded Scholarship Programs (in millions)Aid Based Only on NeedAid with Need & Merit ComponentsAid Based Only on MeritArkansas 8.8— 140.4Florida 136.8 .07 333.8Georgia—— 436.4Kentucky 58.9— 99.1New Mexico 28 1.4 67.8Tennessee 43.8 28 262.2South Carolina 19.5— 229West Virginia 5.2 39.2 47.6Total 301 million 68.7 million 1,616.3 millionNote. Data from “43rd Annual Survey Report on State-Sponsored Student Financial Aid, 2011-2012 Academic Year,” by NASSGAP, 2013. p. 13, Table 8.program. In fact, when comparing award amountsby type in the lottery-funded scholarship states, thepicture is very different: together, they awarded 301million in grants based on financial need, and astaggering 1.6 billion in grants based on academicmerit. These numbers are broken out by state inTable 4. Part of this shift away from need-based aidcan be attributed to underlying ideologies: meritbased scholarship programs play into Americanvalues of democracy and the theoretical success ofthose individuals who work hardest. Additionally,unlike need-based grant programs, which inherentlybenefit only the poorest students, non-need-basedprograms can also support middle- and upperincome households—populations that tend to vote athigher percentages. Yet there is significant evidencethat rewarding the notion of “merit” only presents anillusion of fairness among student populations.Despite the fact that merit-based scholarshipsplay into a notion of democracy in a way thatneed-based programs—which target a specificsubset of students, by definition—do not,merit-based scholarships swing too far in theother direction. Research shows that merit-basedprograms disproportionately benefit white andhigher income families. These programs’ eligibilitystandards are designed to limit the pool of studentswho qualify for award dollars, but in doing so, theyoften restrict funds to those students with greaterfinancial resources. Four states currently have aminimum ACT/SAT score or a minimum high schoolGPA requirement, for example, and Florida and WestVirginia require students to meet both an ACT/SATand GPA requirement. Policies like those in Floridaand West Virginia are particularly harmful to thepoorest students. As a 2008 study demonstrated,if Florida and West Virginia were to change theirrequirements from “and” to “or,” then the totalamount of scholarship dollars going to low-incomestudents would nearly double (Ness & Tucker, 2008).In fact, the Florida Bright Futures program has evencome under scrutiny from the U.S. Departmentof Education’s Office for Civil Rights for possiblediscrimination against minority students (Dupuy,2014). Clearly, the growing reliance on merit-basedaid programs to distribute lottery revenues meansthat these dollars tend to finance students who7
PolicyMattersare likely to attend college anyway given theirfinancial wherewithal,instead of expanding accessand affordability for the neediest students for whomcollege is only a chance possibility.The inequity in college preparedness acrossdemographic sectors is a large contributingfactor to the uneven disbursement of lottery funddollars. According to the College Board, only 52percent of high school graduates from the lowestincome quintile enroll in college within one yearafter graduation, compared to 82 percent of studentsat the highest-income quintile (2013a, 34). Yet thisstatistic is misleading, as it masks the unequal ratesof graduation across quintiles and the tendenciesof different quintiles to enroll in different types ofinstitutions. If the percentage of all high schoolstudents who attended four-year institutions wereseparated by family income, the picture wouldbe much more dire. The poorest students tendto be overrepresented in two-year institutionsand underrepresented in four-year colleges anduniversities. Tuition at community colleges tendsto be much less expensive on average than thetuition at public four-year institutions. Therefore,when lottery-funded scholarships cap awards at aset amount or the total amount of tuition, whicheveris lesser, low-income students at two-year collegesrequire fewer state dollars to meet this thresholdthan students attending a more expensive four-yearinstitution. Students in the lowest income bracketsare also less likely to persist from semester tosemester or complete a degree: Among students whobegan postsecondary education in 2003-04, only 26percent of students in the lowest quartile earneda bachelor’s degree by 2009, whereas 58 percentof students in the highest quartile completed theirprograms (College Board, 2013a). Combined with anincreased likelihood of receiving need-based federalawards, the propensity to attend a less expensiveinstitution is another way in which low-incomestudents benefit less from lottery proceeds thanstudents from the wealthiest backgrounds.8The inequity of merit-based scholarship programsintensifies the unequal burden lotteries alreadyplace on particularly vulnerable populations.Though no individual is required to participate ingambling, making the lottery technically voluntary,lotteries are often considered a “regressive tax” for anumber of reasons. First, low-income families tend tobenefit less from lottery-funded programs—includingmerit-based scholarship programs—than higherincome families. Second, lotteries are regressivebecause the poorest families tend to play gamesmore frequently than wealthier families and lotteriesrepresent a greater share of the household incomein lower socioeconomic brackets (Stewart, 2013).In essence, poor families are helping send wealthystudents to college. Moreover, due to the aggressivenature of lottery advertising and the addictivenature of gambling in general, some critics evenargue that the lottery is considerably less voluntarythan a traditional economic model typically allows(Bowden & Elrod, 2004). In almost every studyperformed by economists, findings show that ashousehold income increases, the proportion spent onlotteries decreases. If lottery proceeds were spent onprograms designed to aid the populations that tendto fund them—in this case, low-income families andminorities—then the regressive nature of lotterieswould be lessened (Bowden & Elrod, 2004). This,unfortunately, is not the case. At New Mexico StateUniversity, for example, only 30 percent of therecipients of lottery-funded scholarships came fromfamilies earning 20,000 to 39,999, whereas overhalf came from families with annual incomes over 100,000 (Stewart, 2013).In addition to disproportionately drawing fundsfrom low-income households into a programthat unequally benefits the wealthiest families,lotteries also become increasingly regressiveover time. Tuition prices climb year after year, andinsufficient, if not decreasing, state appropriationsforce public colleges and universities to place moreof the financial burden onto students and their
PolicyMattersfamilies. Projected growth in student enrollmentswill result in a larger number of students whoqualify for scholarship funds, with each lotteryfunded scholarship award requiring additional statefunds. Stagnating lottery revenues cannot keeppace with demand. As a result, states are forcedto reevaluate and renegotiate the terms of theirscholarship programs in order to address the fiscalimbalance. Of the twelve states with merit-basedscholarship programs, Arkansas, Florida, Georgia,New Mexico, Tennessee, and South Carolina—allstates which rely on lottery revenues to fund theirscholarship programs—have proposed legislationto freeze or cut award levels (Covert, 2014; Dupuy,2014; Quizon, 2011; THEC, 2012).In New Mexicoin 2013, where a college GPA of 2.5 or highermeant 100 percent coverage of tuition costs foreight consecutive semesters, the program wasexpected to pay out 67 million but only took in 40million. To deal with this growing deficit, the NewMexico legislature considered raising the program’sminimum GPA requirement, increasing the minimumnumber of credits students must take each semester,or changing the award to a set amount instead ofcovering tuition entirely (Boyd, 2013). Ultimately,they decided to reduce the total number of semestersfunded from eight to seven (Massey, 2014).Many of the other lottery-funded scholarshipprograms have also felt this crunch. Arkansasaltered award amounts beginning in the 2013–2014academic year from a set amount every year to amaximum award that gradually increases over fouryears. In Tennessee, when the program was alteredto include coverage of summer semesters, it wasalso amended to cap awards at either 120 attemptedsemester hours or completion of a degree, whichevercame first (University of Tennessee, 2014). TheFlorida Bright Futures program endures perpetualreforms to its eligibility requirements in order toreconcile growing costs with state budgetary issues,including cutting scholarship amounts per credithour, raising ACT/SAT requirements, and reducingthe budget for the program from 309 millionto 266 million next year (Dupuy, 2014). Eventhe iconic Georgia HOPE program was forced torenegotiate terms in 2011 as demand for scholarshipsand increasing tuition created large deficits. Tocompensate, Georgia ceased paying for remedialcourses, increased the minimum required GPA, andawarded set amounts instead of full tuition; thesechanges led to a 24 percent decrease in students thatqualified for the program (Covert, 2014).Changes in eligibility requirements exacerbatethe inherent regressive nature of lotteries andtheir merit-based scholarship programs. Lowincome students are often affected by less visiblefactors that contribute to college success, like higherrates of holding part- or full-time employmentwhile pursuing an education, thus making it moredifficult for them to focus on their studies andsubsequently qualify for merit-based scholarshipsin the first place (Stewart, 2013). When states raiseminimum eligibility requirements or cut back onaward amounts in order to rein in program costs,low-income and minority students tend to bedisproportionately affected. When requirements areincreased, these students are squeezed out; whenaward amounts are cut, they are disproportionatelyburdened by the need to find additional fundingelsewhere to cover educational expenses. Theseissues are at the core of the U.S. Department ofEducation’s Office of Civil Rights’ investigation intothe Florida Bright Futures program (Dupuy, 2014).Therefore, while lottery programs are historicallyregressive to begin with, lottery-funded, meritbased sc
Policy Matters Comparing Lottery-Funded, Merit-Based Scholarship Programs Lottery-funded programs range in size and cost from state to state. Florida served the largest number of students (162,980) and spent the second highest amount of any state— 312 million. Georgia, near the top of the list in terms of both