Transcription
An AppDynamics Business White PaperWhy Nagios and Server MonitoringAre Failing Modern AppsServer monitoring is an important part of any datacenter monitoring architecture, but too often itbecomes a crutch and a deterrent to successfullybuilding out a holistic monitoring platform. Serverstatus is only one indicator of application performance,so relying exclusively on server monitoring tools leavesorganizations with large blind spots and unhappyend users. In this paper we will explore what servermonitoring is and how it can (and should) fit into alarger application performance management platform.
What is Server Monitoring?Server monitoring consists of monitoring operating system and associated hardwaremetrics for the servers that run your application. It’s the view of the world fromthe perspective of the server, but never from inside the running processes. Basicserver monitoring metrics include CPU sys time, CPU wait time, used memory, freememory, disk queue length, % disk used, network collisions, adapter transmit rate,etc. Server monitoring is used by every IT organization in some shape or form.The 9s are an (Unintentional) LieIT organizations are usually held to a standard of three, four, or five “nines” ofavailability, referring to the number of nines in. The table below defines each of the“nines” and translates their meaning into acceptable minutes of server downtimeper year.The NinesYearly Uptime (Minutes)Max Yearly Downtime(Minutes)99.9% (3 nines)525,074.5525.599.99% (4 nines)525,547.552.599.999% (5 nines)525,594.85.2Availability is usually measured at the server level by checking if the server isresponding to requests. The problem with this method is that availability at theserver level doesn’t mean that the application is responsive or even available. If yourservers are down, the application is down – but the opposite does not necessarilyhold true. In order to truly address performance issues, IT needs to monitor morethan just server availability – after all, what’s the point of keeping an application upand running if it is so slow or error-prone that nobody will use it?The NinesServer Downtime Costs(Dollars)Application Downtime %?52,000*Assuming the cost per minute of downtime is 10,000The chart above shows the costs associated with server and applicationdowntime. Every company should track the cost of downtime for revenuegenerating applications. No company can tell you the cost of server downtimewithout understanding whether or not the application(s) using those servers havebeen impacted.Why Nagios and Server MonitoringAre Failing Modern Apps2
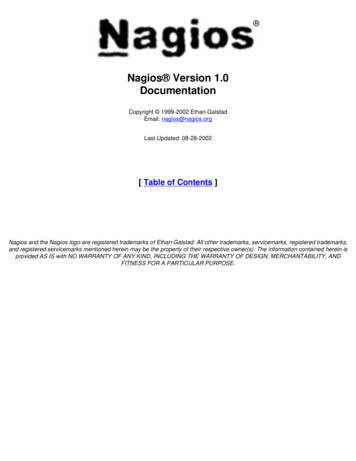
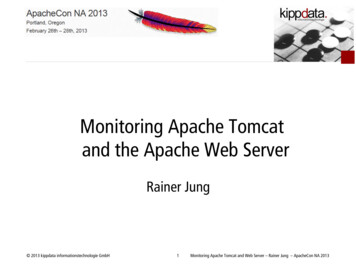
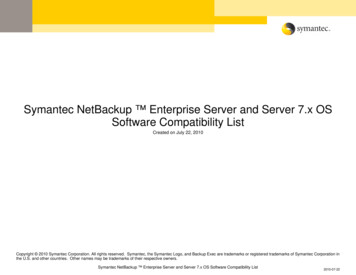
What are Some Traditional Server Monitoring Tools?Unix Systems Administrators use tools like sar, vmstat, nmon, top, topas, and netstatto monitor servers in real time. Windows Administrators use perfmon and WMI forreal time monitoring. Other tools for alerting and storing historical metrics includeBMC Patrol, HP OpenView, Miscrosoft SCOM, Nagios, Zenoss, Cacti, Zabbix, Ganglia,GroundWork, and Hyperic.All of these tools are useful. All of these tools also fall woefully short of achievingthe goal of minimizing application downtime and maximizing applicationperformance.vmstat output from a Linux server. Is there any problem with the running application?What’s the Problem?The problem is that none of these server monitoring tools are capable of knowinghow your applications are performing. Some of them can probe your application tosee if it is available or not but none can tell you why your application has ceased tofunction. No server monitoring tool can tell you any of the following: What is the response time of every request to my application? What components of my application are involved in any of my transactions andwhere is the slow down? How does the application code execute in the run time? What part of the application code is slow? What application functionality is used, how often, and how does it perform? What application functionality is throwing exceptions and what are they? Did a slow external service call impact my application response timeand by how much?Without answering those fundamental questions you don’t stand a chance ofrestoring application service in minutes instead of hours or days.Why Nagios and Server MonitoringAre Failing Modern Apps3
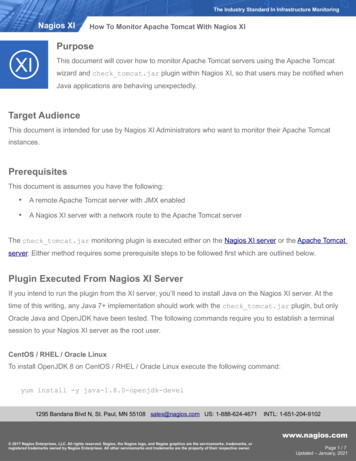
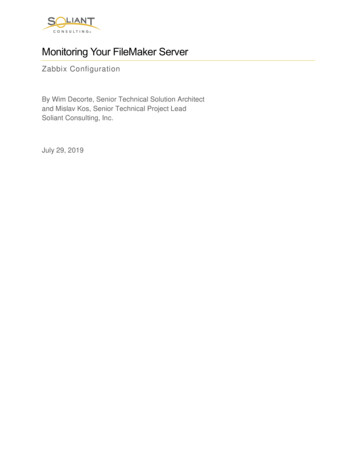
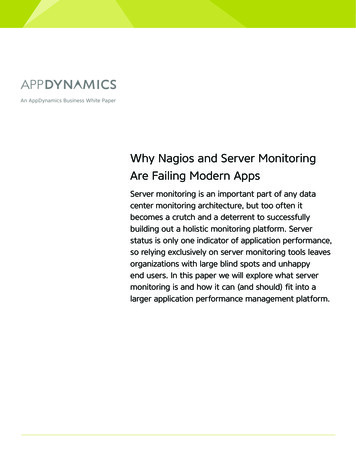
Nagios HTTP check response times. Is the application experiencing problems as awhole? Problems with individual functions? Are there application Errors?Nagios server monitoring charts: What does this tell us about our application?Why Nagios and Server MonitoringAre Failing Modern Apps4
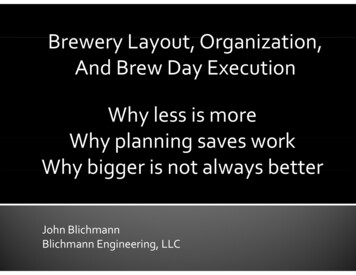
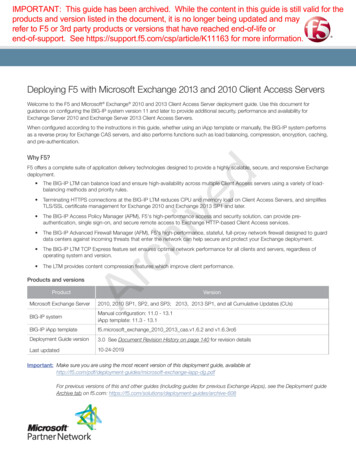
What’s the Solution?Many companies have turned to log monitoring and analytics as a partial solutionto this problem. Log file monitoring is nice to have, but it can’t answer many ofthe questions posed in the above section without a lot of customization. The bestsolution to the problem at hand is to use the latest generation of ApplicationPerformance Monitoring (APM) tools. APM tools understand the inner workingsof your applications. They can see the code executing, the entry and exit calls tothe application, the transactions flowing through and across multiple applicationcomponents, exceptions and their associated impact, and much, much more.Dynamic application flow map showing all application components.Business transactions automatically detected, tracked, and classified.Why Nagios and Server MonitoringAre Failing Modern Apps5
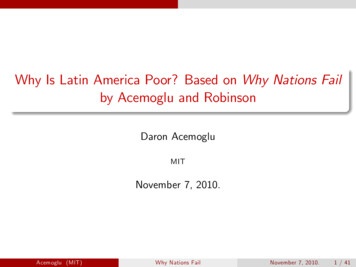
Call graph of a single business transaction with all methods, timing, and remote calls.Making the transition from server monitoring to APM requires learning some newvocabulary. It’s not difficult, just different from what most monitoring personnelare used to.Business Transactions (BTs) – BTs represent unique functionality within anapplication. The easiest way to understand BTs is with an example. Most applicationsrequire a user to provide login credentials before they can use the rest of theapplication. When you want to access a web application you visit the login page,fill in the required fields and click the proper button to begin the authenticationprocess. When you click the button there is typically a slew of downstream activityon the application server, database server, LDAP service, and potentially many otherservices that all work in coordination to service your request. All of the activity thatis generated due to your login request would be considered a “Login” businesstransaction.Application Flow Map – An application flow map (or topology diagram) is thevisual representation of all of the tiers of your application and their dependentcomponents or services. Application flow maps should be dynamically built andupdated based on what the APM tool detects, not manually created.Call Graph – Also referred to as a call stack. This is a tree-based list of applicationcode that is executed on application servers in order to service a specified businesstransaction. Call graphs are used to determine what code is responsible forproblems within an application.Errors & Exceptions – Exceptions and errors represent failures in the applicationlogic. However, not all exceptions or errors impact the business. An example of acommon exception that is not an application problem is when a customer entersan invalid coupon code during checkout. This invalid code may cause an applicationexception but is not a problem that can be fixed. What’s important is to be ableto monitor and alert on the exceptions and errors that affect your business byinterfering with the application’s functionality.Why Nagios and Server MonitoringAre Failing Modern Apps6
Making the transition from server monitoring to APM requires learning some newvocabulary. It’s not difficult, just different from what most monitoring personnel areused to.What’s the Impact?Moving from a server-monitoring based approach to managing performance to anAPM solution can add a lot of value for your organization. Here are just a few of thebenefits of using APM: Reducing Mean Time to Resolution (MTTR) from hours/days to minutes. Faster development due to less time tracking down bugs. Fewer bugs released because they are easier to identify and remediate. Faster QA cycle due to rapid problem detection, isolation, and resolution. More stable production environment due to better development and QA.ConclusionServer monitoring is an important part of any IT organization’s toolkit. Tools likeNagios provide real-time insight into the health of your datacenter, and serveravailability is an important metric to monitor. But if your business relies onapplications, you can’t stop there. Server health and availability is only part ofthe picture – in order to really understand how your end users experience yourapplication, you need to monitor at the application level, too. The best solution formanaging application performance should include both server monitoring and theapplication-level monitoring provided by application performance management(APM) products. With both of these tools in hand you can be more proactive aboutapplication performance and ultimately reduce the impact of performance issues onyour end users.About AppDynamicsAppDynamics is the next-generation application performance managementsolution that simplifies the management of complex, business-critical apps.No one can stand slow applications—not IT Ops and Dev teams, not the CIO,and definitely not end users. With AppDynamics, no one has to tolerate slowperforming apps ever again.Try it FREE atwww.appdynamics.comAppDynamics, Inc.www.appdynamics.comCopyright 2014 AppDynamics, Inc. All rights reserved. The termAPPDYNAMICS and any logos of AppDynamics are trademarked orregistered trademarks of AppDynamics, Inc.
An AppDynamics Business White Paper Server monitoring is an important part of any data center monitoring