Transcription
TEM Journal. Volume 11, Issue 1, pages 316-322, ISSN 2217-8309, DOI: 10.18421/TEM111-39, February 2022.Comparison of Decision Tree ClassificationMethods and Gradient Boosted TreesArif Rinaldi Dikananda 1, Sri Jumini 2, Nafan Tarihoran 3,Santy Christinawati 4, Wahyu Trimastuti 4, Robbi Rahim 51STMIK IKMI Cirebon, IndonesiaUniversitas Sains Al-Qur'an Indonesia, Wonosobo, Indonesia3Universitas Islam Negeri Sutan Maulana Hasanuddin Banten, Indonesia4Politeknik Piksi Ganesha Bandung, Bandung, Indonesia5Sekolah Tinggi Ilmu Manajemen Sukma, Medan, Indonesia2Abstract – The purpose of this research is to analyzethe C4.5 and Random Forest algorithms forclassification. The two methods were compared to seewhich one in the classification process was moreaccurate. The case is the success of university studentsat one of the private universities. Data is obtained fromthe https://osf.io/jk2ac data set. The attributes usedwere gender, student, average evaluation (NEM),reading session, school origin, and presence as inputand success as a result (label). The process of analysisuses Rapid Miner software with the same testparameters (k-folds 2, 3, 4, 5) with the same type ofsample (stratified sample, linear sample, shuffledsampling). The first result shows that the sample typetest k-fold (stratified sampling) achieved an averageaccuracy of 55.76 percent (C4,5) and 5618 percent(Random Forest). The second result showed that the kfold (linear sampling) sample test achieved an averageprecision of 58.06 percent (C4.5) and 6506 percent.(Random Forest).DOI: 39Corresponding author: Robbi Rahim,Sekolah Tinggi Ilmu Manajemen Sukma, Medan,Indonesia.Email: shed:04 November 2021.03 February 2022.08 February 2022.28 February 2022. 2022 Arif Rinaldi Dikananda et al;published by UIKTEN. This work is licensed under theCreative Commons Attribution‐NonCommercial‐NoDerivs4.0 License.The article is published withhttps://www.temjournal.com/316OpenAccessatThe third result shows that the k-fold test with thesampling type has averaged 58.68 per cent (C4,5) and60,76 per cent (shuffled sampling) precision (RandomForest). From the three test results, in the case ofstudent success at a private university, the RandomForest method is better than C4.5.Keywords – Comparison, Data mining, Classification,C4.5, Random Forest, Accuracy.1. IntroductionData mining is one of the methods used forextracting knowledge or finding patterns from largedata. Data mining is the process of extractingimportant information from data implicit andpreviously unknown [1], [2], [3], [4], [5]. Some ofthe data extraction roles can be played by estimating,predicting, classifying, clustering, and assembly [6,7], [8], [9], [10]. There are several well-known datamining algorithms, including C4.5, Random Forestand others [11],[12]. The choice to use the C4.5 andRandom Forest algorithms is based on severalreasons, which can both be easily implemented andwhich in the case of classification both produce goodresults [13]. Several previous studies have analyzedthese two algorithms, for example [14] on theperformance comparison of decision tree algorithmsand random forest: application on health expendituresongul for OECD countries. Two comparisons of theC4.5 and Random Forest methods are presented inthis paper using 50 trees. The results showed that theRandom Forest exceeded C4.5, namely AUC 0.98and AUC 0.90, with classification accuracy. Inaddition, [15] research on the comparison betweenthe Decision Tree and Random Forest in Type 2diabetes cases. This paper compares the accuracy,sensitivity, speciality and area under the ROC curvebetween these two models. The results have shownthat in terms of accuracy, sensitivity, specificity andarea within the ROC curve, the Random Forestmethod outperforms C4.5. Further research wasconducted [16] on rainfall prediction weather dataanalysis using the Rattle-R GUI tool. This paperTEM Journal – Volume 11 / Number 1 / 2022.
TEM Journal. Volume 11, Issue 1, pages 316‐322, ISSN 2217‐8309, DOI: 10.18421/TEM111‐39, February 2022.proposes two algorithms for classification, C4.5 andRandom Forest. The results show that a smallerredistribution error rate than C4.5 is shown in theRandom Forest algorithm. Lan, 2020 [17] conducteda study of the comparison of the decision tree methodwith the Random Forest method to identify the Fspread. The paper proposes three automaticidentification processes for F-dispersion by DecisionTree, Random Forest, and CNN. The results showthat the Random Forest method results in the exactidentification of monograms with the CNN Fdistribution better than that of the Decision Treemethod.The C4.5 and Random Forests algorithmswere used mostly in previous studies. However, eachstudy cannot determine which model in classificationis more accurate and faster. This is because previousresearchers' data sets are not the same, because eachdata treatment is also different. The more complexthe data, the data noise and the inconsistent datanaturally affect the performance of the classificationalgorithm [13], [18], [19], [20]. This study aims toanswer the question, which model is more exact inclassifying student success in tertiary institutions,based on identifying these problems.2. Methodology2.1. Dataset InputIn a comparative study of decision tree and randomforest classification methods, we used the AMIKTunas Bangsa Student dataset of the study (Luvia etal., 2017). There are five attributes used as input andone attribute used as output. The following attributedata is shown in the following table:Table 1. Predicate of GraduationField NamePredicate ofSuccessGenderStudentEvaluationAverage Score(NEM)Data ClassTypeNominalNominalNominalLecture SessionNominalSchool OriginNominalPresenceNominalData Class UsedCum laude,Very Good,Good, Enough,LessMan / WomanNEM 20,NEM 20MorningafternoonEveningPematangsiantar, Outside theRegionAttendance 50,Attendance 50The dataset used to calculate the algorithm whencomparing the Decision Tree Classification Methodsand the Random Forest in the case of student successstories can be accessed via the https://osf.io/jk2ac.TEM Journal – Volume 11 / Number 1 / 2022.2.2. Import DatasetThe first thing to do is to import the dataset into theRapidMiner software, which is to provide the datasetthat has been saved in the.xls format. Then import itto the Read Excel tool using the Operator menu. Onecan use the view command to display datasets thathave been imported into RapidMiner.2.3. K-Fold Cross ValidationK-Fold Cross Validation is a method for assessingthe performance of an algorithm [21]. K is to fold thedata as much as K and iterate as K so that thealgorithm has a data accuracy value. The decisiontree algorithm being evaluated at this point is theC4.5 algorithm [7] and the Random Forest [22].What is being done in each model is to make a foldand use the best number of folds to assess the validityusing 5-fold cross-validation in the model [23, 24].The C4.5 algorithm and the Random Forestrecursively visit each decision node, selecting theoptimal branch until no more branches are generated.2.4. The Random ForestThe random forest algorithm estimates the errorrate more accurately in relation to decision trees [25,26]. More specifically, the error rate has alwaysconverged with the increase in the number of trees[22]. The steps in the random forest classification areas follows [25]:a) A set of decision trees has been created from thetraining set. In the present work, 100 trees havebeen grown.b) Each tree in the dataset has been grown byrandomly selecting attributes.c) The "m" features are randomly selected from the"M" features in the dataset, m M is this work,where M is the total number of features in thedataset.d) Attribute selection was done using Gini indexscore between 0 and 1, where 0 indicates themost interesting information and 1 indicates theleast interesting information.e) Trees shall be grown to the maximum depth (allselected attributes).f) When a test instance (obtained from a 10-foldcross-validation) was given to a constructedrandom forest, all the trees in the forest will havetheir resultant class. The final class is decided onthe basis of the majority vote.g) The accuracy of the classifier is calculated wherethe accuracy is the percentage of the test setcorrectly classified by the classifier.2.5. C4.5 Decision Tree AlgorithmC4.5 Decision tree-based upon ID3 Decision Treeis expanded, and does not directly use informationgain, but adds gain as one of the best partition317
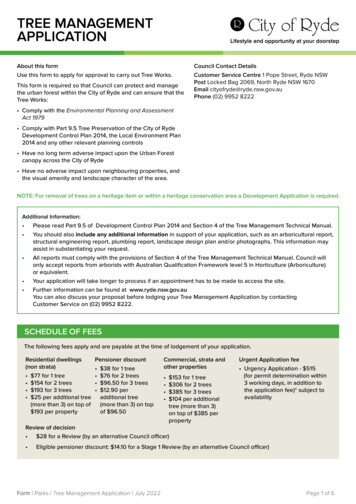
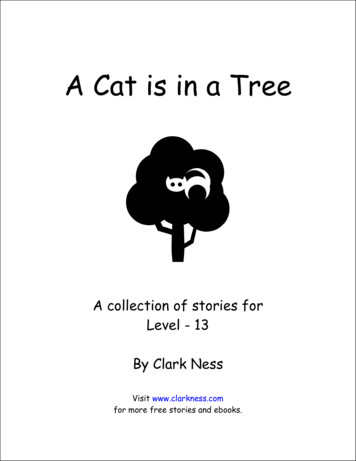
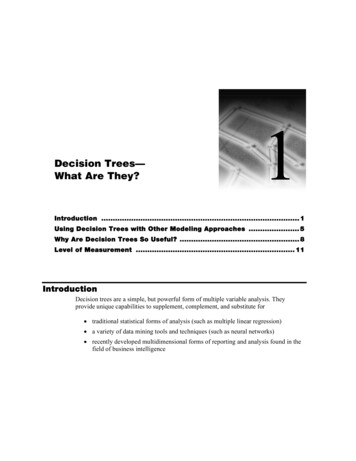
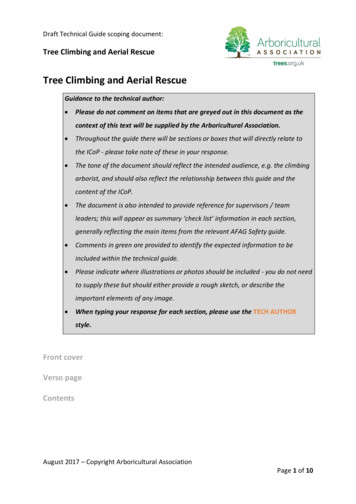
TEM Journal. Volume 11, Issue 1, pages 316‐322, ISSN 2217‐8309, DOI: 10.18421/TEM111‐39, February 2022.standard attributes is selected [27]. In this case, C4.5uses the expected class value to create a higher treedecision node [1].3. Results and DiscussionThe comparative analysis design process of the twoclassification methods (C4.5 and Random Forest)uses the help of the Rapid Miner cross validationsoftware (k-fold 2, 3, 4, 5) where the results of thetwo methods are compared to the accuracy values ofthe classification results. The following is a modelcreated with the Rapid Miner software.3.1. Creating a C4.5 Model Tree with CrossValidationIn making the C4.5 model using the RapidMinersoftware, the data entry process uses an importdataset (.xls) where after importing the dataset; therole set process is carried out to determine the outputof the classification model created. In this case theoutput attribute is Predicate of Success (Table 1).The testing process uses cross validation with k-fold 2, 3, 4, 5. For training and testing the sameparameters were used, namely:a)b)c)d)e)f)3.2. Creating a Random Forest Model with CrossValidationThe data entry process uses an import dataset (.xls)to create the Random Forest model using theRapidMiner Software, where the role set process isperformed after importing the dataset to determinethe output of the classification model. In this case theoutput attribute is a success indicator (Table 1). Thetest process uses k-fold 2, 3, 4, 5 for crossvalidation. For training and testing with the sameparameters:a) maximal dept : 10b) apply pruning : confidence 0.1c) minimal gain : 0.01d) minimal leaf size:1e) minimal size for split : 1f) number of prepuning : 1The following is the design of the Random Forestmodel using cross validation as shown in Figure 2.maximal dept: 10apply pruning: confidence 0.1minimal gain: 0.01minimal leaf size : 1minimal size for split:1number of prepuning:1(a)The following is the design of the C4.5 modelusing cross validation as shown in Figure 1.(b)Figure 2. The Random Forest Model Tree with CrossValidation (a)(b)(a)3.3. Results of Model Tree C4.5 with CrossValidationFollowing are the results of the analysis of theC4.5 method based on different sampling types withpredetermined cross validation as shown in thefollowing table:Table 2. sampling type use stratified samplingMethod(b)Figure 1. The C4.5 Model Tree with CrossValidation (a)(b)318Decision TreeAverageCross ValidationK-Folds 2K-Folds 3K-Folds 4K-Folds 5accuracy26.67 percent72.22 percent70.83 percent53.33 percent55.76 percentTEM Journal – Volume 11 / Number 1 / 2022.
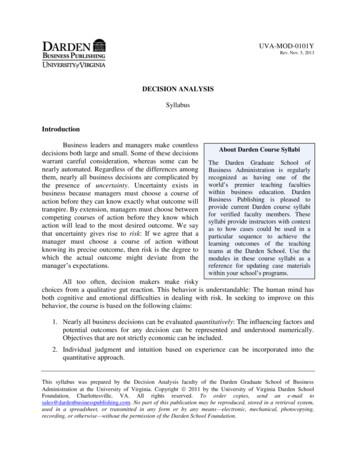
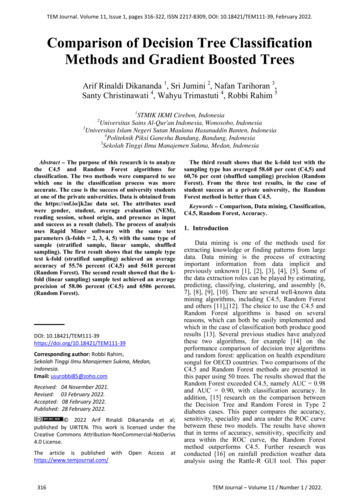
TEM Journal. Volume 11, Issue 1, pages 316‐322, ISSN 2217‐8309, DOI: 10.18421/TEM111‐39, February 2022.In Table 2 the highest accuracy value is in crossvalidation with (k-folds 3) which is 72.22 percent.The mean score for accuracy was 55.76 percent.Table 3. sampling type use linear samplingMethodDecision TreeCross ValidationK-Folds 2K-Folds 3K-Folds 4K-Folds 5Averageaccuracy36.67 percent72.22 percent50.00 percent73.33 percent58.06 percentIn table 3 the highest accuracy value is in crossvalidation with (k-folds 5) which is 73.33 percent.The mean score for accuracy was 58.06 percent.4) 75.33 percent. The mean accuracy score was 65.06percent.Table 7. sampling type use shuffled samplingMethodRandom ForestCross ValidationK-Folds 2K-Folds 3K-Folds 4K-Folds 5Averageaccuracy53.33 percent72.22 percent54.17 percent63.33 percent60.76 percentThe highest accuracy in the Random Forest modeltest in Table 7 is in cross-validation with (k-folds 3) 72.22 percent. The mean accuracy score was 60.76percent.Table 4. sampling type use shuffled samplingMethodDecision TreeCross ValidationK-Folds 2K-Folds 3K-Folds 4K-Folds 5Averageaccuracy36.67 percent72.22 percent62.50 percent63.33 percent58.68 percentIn Table 4 the highest accuracy value is in crossvalidation with (k-folds 3) which is 72.22 percent.The mean score for accuracy was 58.68 percent.3.4. Results of the Random Forest Model with CrossValidationThe results of the Random Forest method analysisbased on different sample types with pre-determinedcross-validation as shown in the table below are asfollows:Table 5. sampling type use stratified samplingMethodRandom ForestCross ValidationK-Folds 2K-Folds 3K-Folds 4K-Folds 5Averageaccuracy36.67 percent72.22 percent62.50 percent53.33 percent56.18 percentThe highest accuracy in the Random Forest modeltest in Table 5 is in cross-validation with (k-folds 3) 72.22 percent. The mean accuracy score was 56.68percent.Table 6. sampling type use linear samplingMethodRandom ForestAverageCross ValidationK-Folds 2K-Folds 3K-Folds 4K-Folds 5accuracy57.67 percent63.89 percent75.33 percent63.33 percent65.06 percentThe highest accuracy in the Random Forest modeltest in Table 6 is in cross-validation with (k-folds TEM Journal – Volume 11 / Number 1 / 2022.3.5. DiscussionA summary and graph of the accuracy values forthe two methods at different sampling types can beseen in the following table and figure:Table 8. Accuracy values for both methods on thesampling type use stratified samplingMethodRandomForestDecisionTreeK-Folds K-Folds K-Folds K-Folds accuracy ‐ stratified 10.00%0.00%72.22% 70.83%62.50%53.33%Random Forest36.67%26.67%Decision TreeK‐Ford K‐Ford K‐Ford K‐Ford 2345(a)Average 55.60%55.50%56.18%Average Accuracy55.76%Decision Tree Random Forest(b)Figure 3. Graph The accuracy value of both methods onthe sampling type use stratified sampling (a)(b)319
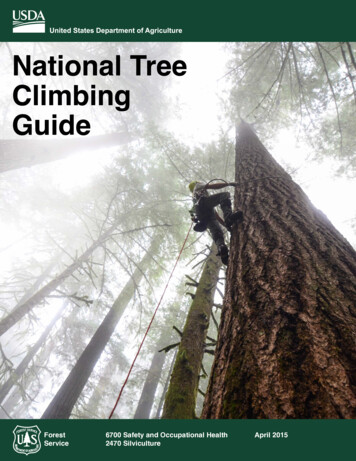
TEM Journal. Volume 11, Issue 1, pages 316‐322, ISSN 2217‐8309, DOI: 10.18421/TEM111‐39, February 2022.It can be explained in Table 8 and Figure 3 that theRandom Forest method is better than the C4.5method when using a stratified sampling typesample with 56.18 percent exactness.Table 9. Accuracy values for both methods on thesampling type use linear samplingKFolds -Folds 363.89percent72.22percentMethodK-Folds 475.33percent50.00percentKFolds 563.33percent73.33percent70.00%57.67%72.22% 75.33% .00%20.00%10.00%0.00%K‐Ford 2 K‐Ford 3 K‐Ford 4 K‐Ford 5(a)Average Accuracy60.76%Average Accuracy59.00%Random Forest58.50%Decision Tree58.00%58.68%57.50%Decision Tree Random Forest0.00%K‐Ford K‐Ford K‐Ford K‐Ford 2345(b)Figure 5. Graph The accuracy value of both methods onthe sampling type use shuffled sampling (a)(b)(a)Average AccuracyIt can be explained in Table 10 and Figure 5 thatthe Random Forest method is better than the C4.5method when using a linear sampling type samplewith 60.76 percent exactness.66.00%64.00%65.06%62.00%60.00%Average Accuracy58.00%58.06%54.00%Decision Tree Random Forest(b)Figure 4. Graph The accuracy value of both methods onthe sampling type use linear sampling (a)(b)It can be explained in Table 9 and Figure 4 that theRandom Forest method is better than the C4.5method when using a linear sampling type samplewith 65.06 percent exactness.Table 10. Accuracy values for both methods on thesampling type use shuffled samplingMethodRandomForestDecisionTree320Decision Tree28.33%20.00%59.50%10.00%56.00%Random 0%accuracy ‐ linear sampling60.00%accuracy ‐ shuffled samplingK-Folds 253.33percent28.33percentK-Folds K-Folds K-Folds 6.67percentpercentpercent4. ConclusionOn the basis of the results of the research, it isexplained that the Random Forest method in terms ofclassification accuracy using cross validation is betterthan the C4.5. The first result shows that the test typek-fold (stratification) of the sample achieved a meanprecision of 55.76% (C4.5) and 5618% (RandomForest). The second result demonstrated that the kfold (linear sample) test achieved an averageaccuracy of 58.06% (C4.5) and 6506%. (ForestRandom). The third finding shows that a k-fold testhas an average of 58.68% (C4.5) and 60.76%(shuffled) precision (Random Forest). Of the threetest results, the Random Forest method is better thanC4.5 in the case of student success at a privateuniversity.TEM Journal – Volume 11 / Number 1 / 2022.
TEM Journal. Volume 11, Issue 1, pages 316‐322, ISSN 2217‐8309, DOI: 10.18421/TEM111‐39, February 2022.References[1]. Elacio, A. A., Lacatan, L. L., Vinluan, A. A., &Balazon, F. G. (2020). Machine Learning Integrationof Herzberg's Theory using C4. 5 Algorithm. Int. J.Adv. Trends Comput. Sci. Eng, 9(1.1), 57-63.doi:10.30534/ijatcse/2020/1191.12020[2]. Agarwal, S. (2013, December). Data mining: Datamining concepts and techniques. In 2013 internationalconference on machine intelligence and researchadvancement (pp. 203-207). IEEE.[3]. Muhajir, M., & Efanna, B. R. (2015). AssociationRule Algorithm Sequential Pattern Discovery usingEquivalent Classes (SPADE) to Analyze the GenesisPattern of Landslides in Indonesia. InternationalJournal of Advances in Intelligent Informatics, 1(3),158-164. doi:10.26555/ijain.v1i3.50[4]. Triyanto, Y., Sepriani, Y., Mustamu, N. E., Siregar,R. A., & Rambe, B. H. (2021, June). Implementationof PROMETHEE Method for Potential Suitability ofLand Oil Palm Plant. In Journal of Physics:Conference Series (Vol. 1933, No. 1, p. 012060). IOPPublishing. doi:10.1088/1742-6596/1933/1/012060[5]. Setiawan, M. I., Hasyim, C., Kurniasih, N., Abdullah,D., Napitupulu, D., Rahim, R., . & Wajdi, M. B. N.(2018, April). E-Business, the impact of regionalgrowth on the improvement of Information andCommunication Development. In Journal of Physics:Conference Series (Vol. 1007, No. 1, p. 012044). IOPPublishing. doi:10.1088/1742-6596/1007/1/012044[6]. Proud, R., Mangeni-Sande, R., Kayanda, R. J., Cox,M. J., Nyamweya, C., Ongore, C., . & Brierley, A. S.(2020). Automated classification of schools of thesilver cyprinid Rastrineobola argentea in LakeVictoria acoustic survey data using randomforests. ICES Journal of Marine Science, 77(4), 13791390. doi:10.1093/icesjms/fsaa052.[7]. Praveena, M.; Bhavana, N. (2019). Prediction ofchronic kidney disease using C4.5 algorithm.International Journal of Recent Technology andEngineering, 7(6), 721-723.[8]. Susanto, R., & Rachmadtullah, R. (2019). Model ofpedagogic competence development: patterns. International Journal of Scientific andTechnology Research, 8(10), 2358-2361.[9]. Raharja, N. M., Prasojo, I., & Tanane, O. (2021).Empowerment of msmes during the covid-19pandemic with information technology. , 1(1), 1-8.[10]. Mujanah, S., Ardiana, I. D. K. R., Nugroho, R.,Candraningrat, C., Fianto, A., & Arif, D. (2022).Critical thinking and creativity of MSMEs inimproving business performance during the covid-19pandemic. UncertainSupplyChainManagement, 10(1), 19-28.doi:10.5267/J.USCM.2021.10.014[11]. Hermanto, H., Kuryanti, S. J., & Khasanah, S. N.(2019). Comparison of Naïve Bayes Algorithm, C4. 5and Random Forest for Classification in DeterminingSentiment for Ojek Online Service. Sinkron: jurnaldan penelitian teknik informatika, 3(2), 266-274.TEM Journal – Volume 11 / Number 1 / 2022.[12]. Nugraheni, I. A. (2021). Implementation ofenvironmental care character for elementary s. Jurnal Pengabdian dan PemberdayaanMasyarakat Indonesia, 1(2), 59-66.[13]. Suryanto, A.; Alfarobi, I.; Tutupoly, T. A. (2018).Komparasi Algoritma C4.5, Naive Bayes DanRandom Forest Untuk Klasifikasi Data KelulusanMahasiswa Jakarta, Mitra Dan Teknologi Pendidikan,Vol. iv nomor 1, 2–14[14]. Çinaroğlu, S. (2016). Comparison of Performance ofDecision Tree Algorithms and Random Forest AnApplicationonOECDCountriesHealthExpenditures. International Journal of computerapplications, 138(1). doi:10.5120/ijca2016908704.[15]. Esmaily, H., Tayefi, M., Doosti, H., GhayourMobarhan, M., Nezami, H., & Amirabadizadeh, A.(2018). A comparison between decision tree andrandom forest in determining the risk factorsassociated with type 2 diabetes. Journal of research inhealth sciences, 18(2), 412. doi:10.34172/jrhs183777[16]. Prajwala, T. R. (2015). A comparative study ondecision tree and random forest using Rtool. International journal of advanced research incomputer and communication engineering, 4(1), 196199. doi:10.17148/ijarcce.2015.4142.[17]. Lan, T., Hu, H., Jiang, C., Yang, G., & Zhao, Z.(2020). A comparative study of decision tree, randomforest, and convolutional neural network for spread-Fidentification. Advances in Space Research, 65(8),2052-2061. doi:10.1016/j.asr.2020.01.036[18]. Tang, J., Alelyani, S., & Liu, H. (2014). Dataclassification: algorithms and applications. DataMining and Knowledge Discovery Series, 37-64.doi:10.1201/b17320[19]. Cutler, D. R., Edwards Jr, T. C., Beard, K. H.,Cutler, A., Hess, K. T., Gibson, J., & Lawler, J. J.(2007). Random forests for classification inecology. Ecology, 88(11), 2783-2792.doi:10.1890/07-0539.1[20]. Ali, S., & Smith, K. A. (2006). On learningalgorithm selection for classification. Applied SoftComputing, 6(2), 119-138.doi:10.1016/j.asoc.2004.12.002[21]. Rumahorbo, A. C., & Sekarwati, K. A. (2020).Penerapan Data Mining Dengan MenggunakanAlgoritma C4. 5 Pada Klasifikasi Fasilitas KesehatanProvinsiDiIndonesia. JurnalIlmiahKomputasi, 19(1), 27-38.[22]. Schonlau, M., & Zou, R. Y. (2020). The randomforest algorithm for statistical learning. The StataJournal, 20(1), 3-29.doi:10.1177/1536867X20909688[23]. Syukmana, F., Wahyudi, E., Gata, W., Wahono, H.,Febianto, N. I., Kuntoro, A. Y., . & Sulaeman, O. R.(2020, February). Predicting Relegation Clubs inItalian Serie A with Method based C4. 5 DecisionTree Algorithm. In Journal of Physics: ConferenceSeries (Vol. 1471, No. 1, p. 012016). IOP Publishing.doi:10.1088/1742-6596/1471/1/012016.321
TEM Journal. Volume 11, Issue 1, pages 316‐322, ISSN 2217‐8309, DOI: 10.18421/TEM111‐39, February 2022.[24]. Agustina, N., & Rozali, Y. A. (2020). Analysis of theapplication of the pedagogical competency modelcase study of public and private primary schools inWestJakartaMunicipality,DkiJakartaProvince. Ilkogretim Online, 19(3), 167-182.doi:10.17051/ILKONLINE.2020.03.114[25]. Christo, V. E., Nehemiah, H. K., Brighty, J., &Kannan, A. (2020). Feature selection and instanceselection from clinical datasets using co-operative coevolutionandclassificationusingrandomforest. IETE Journal of Research, 1-14.doi:10.1080/03772063.2020.1713917/322[26]. Bhosle, N., & Kokare, M. (2020). Random forestbased active learning for content-based imageretrieval. InternationalJournalofIntelligentInformation and Database Systems, 13(1), 72-88.doi:10.1504/ijiids.2020.10030218[27]. Cuan, Y., Wang, Z., & Han, J. (2020). Research onTV imaging casing damage detection andclassification method based on C4. 5 decision tree.In Journal of Physics: Conference Series (Vol. 1437,No. 1, p. 012132). IOP Publishing.doi:10.1088/1742-6596/1437/1/012132TEM Journal – Volume 11 / Number 1 / 2022.
Data mining is one of the methods used for extracting knowledge or finding patterns from large data. Data mining is the process of extracting . [16] on rainfall prediction weather data analysis using the Rattle-R GUI tool. This paper . TEM Journal. Volume 11, Issue 1, pages 316‐322, ISSN 2217‐8309, DOI: 10.18421/TEM111‐39, February 2022