Transcription
1Research NoteIf a superannuation fund has1,000 healthy and wealthy65-year-old couples asclients – how many of thesehousholds will still have onemember alive at 95?The Importance of AccurateLife Expectancy Calculationsin Retirement AdviceRetirement Incomes Working Group
1Research NoteAbout the authorThis research note has been written by Jim Hennington and reviewed by Melanie Dunn.Jim and Melanie are members of the Retirement Incomes Working Group.Jim Hennington BCom, DipFP, FIAAJim Hennington is an actuary and financial services innovator who specialisesin retirement income products, advice strategy and technology. He is anactive member of the Retirement Incomes Working Group. Jim works withOptimum Pensions and 10E24 Pty Ltd and has a strong track record of applyinginstitutional techniques to various business models in the personal planningspace in both Australia and the UK.Published August 2019 Institute of Actuariesof Australia 2019All rights reservedAbout the Actuaries InstituteThe Actuaries Institute (‘the Institute’) is the sole professional body for Actuaries in Australia. The Instituteprovides commentary on public policy issues where there is uncertainty of future financial outcomes.Actuaries have a reputation for a high level of technical financial expertise and integrity. They apply theirrisk management expertise to allocate capital efficiently, identify and mitigate emerging risks and helpmaintain system integrity across multiple segments of the financial and other sectors.The Institute is keen to help ensure the methodologies used in the industry to project Australian householdslifespans are as appropriate as possible and we provide examples where this may not always be the case.Life expectancy calculations are often required in the superannuation and financial planning industries.They have a material impact on the way retirement income strategies and products are formulated andevaluated.Our public policy principles can be viewed at: ublicpolicy/policyprinciples.Research Note-1 Actuaries Institute2
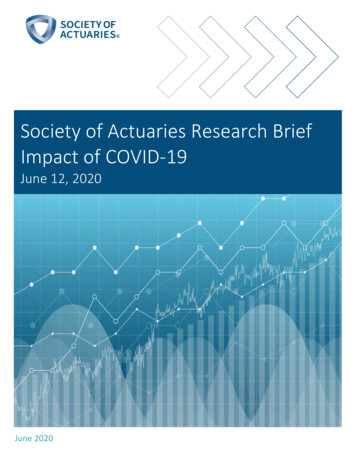
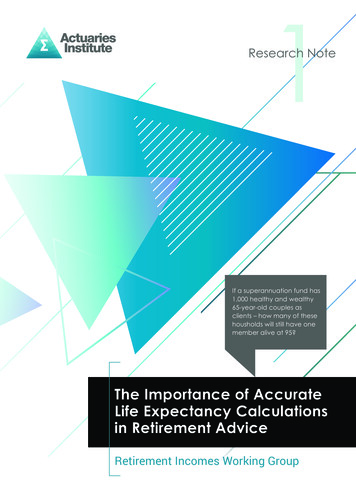
retirees and this trend is expected to continue going forward.The Importance of AccurateLife Expectancy Calculations inRetirement AdviceChart 1 demonstrates the increases in life expectancy for a65-year-old female since 1896 and shows the increasing rangefor how long people used to live over this timeframe.The dark green line in the chart above (Median)demonstrates that since the 1960’s we have seen a rapidRecent research into themethodologies used by bothsuperannuation funds andAustralian Financial Serviceslicensees has shown that manyretirement calculation tools maynot always reflect best practicewhen it comes to allowing forhow long people live.and consistent increase in lifespans for 65-year-old females.Their life expectancy has gone from just over age 80 in1970 to over age 87 in 2016 – based on current rather thanprojected mortality rates.The shading in Chart 1 demonstrates the dispersion ofpossible lifespans. The darker shading near to the median lineshows the range where 50% of 65-year-old females live to (i.e.between age 82 and 93 in 2016) and the lighter shading showsthe range where 80% live until (i.e. between 75 and 97 in 2016).It should be noted that the AGA’s age-by-age mortality ratesextend all the way to age 109 – because a small number ofpeople live that long.It is important that modellers, researchers, productmanagers and Australian Financial Services licensees andThis has a material impact on the way retirement incometheir financial advisers make allowance for these trends andstrategies and products are evaluated.this dispersion. The reason we have focussed on females inthis letter is because, for retirement planning and productAs an example, if we simply take life expectancy fromdesign, retired couples often plan as a combined householdtables referred to in certain pieces of legislation1, we get arather than as two individuals. It is the lifespan of the longerresult for a 65-year-old male of 19.86 more years, or age 85.living spouse that is most important in determining how longFor a female 65-year-old it’s 22.47 years or age 87. Thesea household’s finances must last. Usually this is the femalefigures should be regarded as an approximation simply toas females tend to live longer than males and are often themake the legislation easier to apply. With the fast pace ofyounger spouse. Around two-thirds of people are marriedbiomedical advancements, life expectancies are improvingwhen they enter retirement.on a continuing basis and thisneeds to be allowed for whenmaking financial decisions. WhileChart 1: Life expectancy of a 65-year-old female in 1896 to 20162COVID-19 may lead to a reductionin life expectancy, currentexperience suggests the effect30For a suggested minimum25results, please refer to page 5 ofthis Research Note.The Australian GovernmentActuary (AGA) has a historyof over 125 years of mortalitydata. Since the mid 1960’s wehave witnessed a strong rate ofincrease in life expectancy for12Lifespanwill be small.calculation method and sampleFemales35MedianInterquartile rangeMeanInterdecile range201510501896 r example, Social Security legislation uses life expectancy as the ‘Relevant Number’ in many benefit/assessment e table 5-17%20v5.pdf3,5003,000Actual female deaths by age in 2018(ABS population data)Research Note-1 Actuaries Institute3
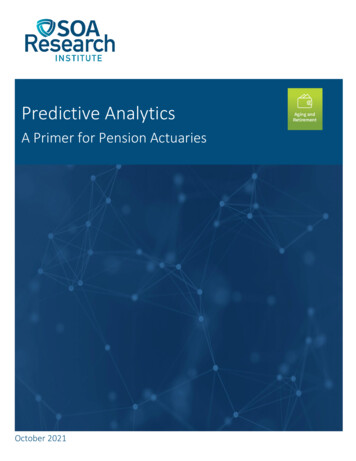
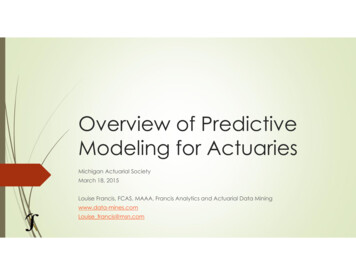
30MedianInterquartile rangeMeanInterdecile rangeLifespan253520FemalesInterquartile rangeMedianHow long willI live personally– and what impacts my30 15Interdecile rangeown life expectancy?MeanPersonal life expectancy has been observed to vary based on:25 10 Current health status Nutrition and lifestylethe clientsof a financial planning group) live. The lifespan of15each individual0may well be very different to the average. Each1896 1906 1916 1926 1936 1946 1956individual10is different. Quality of housing and geographical locationLifespanThere is a wide range for how long the individuals within any205group (for examplefor the members of a super fund or for Genetics (e.g. family history of certain medical conditions)19865Considerable research has been done by insurancecompanies0 and actuaries worldwide to identify the factors18961906 for19161926 193619461956 1986that are mostrelevantpredictingpersonallongevity. Education levels1986 1986 1996 2006 Occupation2016There is also a difference between how long different groupsof people tend to live. For example, smokers have shorter life198619861996 2006than2016expectanciesnon-smokers.Actual female deaths by age in 2018(ABS population data)3,500Chart 2: ABS data showing actual age at death for females who died in 2018 over age 653Total number of deaths3,000Total number of deaths3,5002,500Chart 2 shows the actualActual female deaths by age in 2018(ABS population data)age of death (from ABS data)for females in the generalpopulation who died in 20183,0002,000aged 65 or more.2,5001,500At September 2019 Australiahad just over 130,000 females2,0001,0001,5001,0005000who were age 65 or more4.Using the AGA 2015-175000mortality tables and applyingthe ‘25 year’ improvement65 67 69 71 73 75 77 79 81 83 85 87 89 91 93 95 97 99 101 103105we can project howfactorsandoverRegistered age of deathmanyof these females will65 67 69 71 73 75 77 79 81 83 85 87 89 91 93 95 97 99 101 103 105andoverRegistered age of deathlive until each future age, asfollows. One in four of them areexpected to live past age 95.Chart 3: Estimated distribution of lifespans for Australian females who are currently age 6558,0008,0007,000Today’s 65 year-old females (130,000 people)– range of projected lifespansToday’s 65 year-old females (130,000 people)– range of projected ,0002,0002,0001,0001,0000345065 6967 7169 737175 7377 7579 7783 8985 9187 9389959197 9399 9599 107101109103 105 107 10965 6783 8185 87101 97103 10581 79Data sourced from ABS.Stat and relates to Deaths, Australia (cat. no. 3302.0), available from the ABS website, Data sourced from ABS.Stat and relates to Australian Demographic Statistics (cat. no. 3101.0), available from the ABS website, Applying ALT 2015-17 with 25-year improvementsResearch Note-1 Actuaries Institute4
to how much life expectancy will increase in future andModelling for different groups of retireesthe ’25 year’ improvements are generally thought toThe Actuaries Institute recently carried out research into thehow cautious your client wishes to be (clients who arebe optimistic. Your selection may therefore depend onconcerned about outliving their savings may wish to uselifespans of those who purchase lifetime annuities. These arethe 25-year improvement factors).the people who, at the point of retirement, were likely to bein good health and therefore sought financial security in theThe Actuaries Institute also recommends that superannuationevent that they outlived their life expectancy. The study foundfunds and Australian Financial Services licensees:that this group have much lower risk of dying each year thanthe general population, particularly in their 60s and 70s.(3) Include the age of both spouses if the household is aIn that modelling:couple. This is because joint-life expectancy (the age ofA healthy, well-educated 65-year-old female, who had anAlso, one spouse is typically younger than the other andthe second death) is longer than single life expectancy.can therefore dominate the required planning horizon.affluent career and enjoys a good quality of housing has asimilar chance of living beyond age 100 as she does of dying(4) Show results in a way that includes the range of possiblebefore age 806.lifespans that the individual or couple may experience.If a superannuation fund had 1,000 ‘healthy, educated,Half of individuals will live to somewhere between their lifeprofessional’ 65-year-old couples entering retirement thenexpectancy and the end of the life tables (age 109). To bethey could expect around 500 of these households will haveconfident their plan is robust, people may need to know toone spouse still alive at age 95. This implies significantlywhat age they should plan on living to be, say, 80% certaindifferent advice and strategies than if we assume their lifethat their finances will last as long as they live. For example,expectancy was all age 87.for an average 65-year-old female to be 80% sure her7planning horizon is sufficient, it needs to last until age 96.(5) When looking at groups of lives (e.g. compliance staff inCalculating life expectancy – suggested minimumapproachadvice groups overseeing the advice given to entire booksof clients, or superannuation trustees who are responsiblefor all the members in a fund), model the full distributionThe Actuaries Institute recommends that as a minimum, lifeof how many lives will live until each future age – as perexpectancy be calculated using the AGA’s published mortalitychart 2 – rather than focussing on the average age for thetables as follows:overall group. Some members will live up until near theend of the life tables.(1) Refer to the most recent Australian LifeTable8 (currently 2015-17) www.aga.gov.au/publications/#life d 65 yomale and62 yo femaleLife expectancyignoring improvementtrends858728 yearsLife expectancyallowing for ’25 year’improvements878930 yearsPlanning horizon to be80% confident959735 yearsNote that where you are looking at groups who are likelyto have different mortality to the average (such as thosein good health to the point they are considering a lifetimeincome product) more appropriate life tables may berequired than using overall population mortality.(2) Choose an appropriate mortality improvement table– which allows for estimated ongoing improvementsin life expectancy. An example of these and how toapply them is given in the Australian GovernmentActuary report here www.aga.gov.au/publications/life table 2015-17/default.aspNote that the ‘125 year’ improvements are generallythought by actuaries to be pessimistic when it comes678NotesNote: Healthier retireeslive even longer thanthese figuresThe abovefigures relateto ‘seconddeath’ (the ageby which bothwill have died)Using tables from the Actuaries Institute investigation into annuitant mortality (Basis 1 with AGA 2010-12 25-year improvement factors).Actuaries Institute investigation into annuitant mortality (Basis 1 with AGA 2015-17 25-year improvement factors)Modellers may consider adjusting this based on the demographics of the group of people you are looking at (e.g. considering the list of factors above).Research Note-1 Actuaries Institute5
Summary Life expectancy statistics in legislation and commonlyquoted in the media are usually less than the ages towhich Australian retirees are likely to really face, allowingfor longevity improvements There is a range for the lifespans that any individual canexpect to live. Retirees wanting confidence that theirplanning horizon is sufficient need to know what age toplan to in order to have, say, 80% or 90% certainty theirplanning horizon is sufficient Healthy retirees with good lifestyles tend to live evenlonger than average population statistics Couples need to consider the age to which at least oneof them could survive to. This requires ‘joint-life’ lifeexpectancy calculations and it is often the female’slifespan that drives the result If you are responsible for the outcomes of a groupof people, model the whole distribution for how longmembers of the group will live (see Charts 2 and 3), notjust the overall average.The above issues impact the way people perceive and assessdifferent retirement strategies and retirement products. Theuse of averages masks or downplays the longevity risk thatis inherent in drawing down one’s own assets to fund lifetimespending needs in retirement. If the ‘lens’ through which weview retirement is inaccurate, then incorrect conclusions willbe drawn about retirement strategies and products.The Actuaries Institute welcome comment and opportunitiesto work together in this area. If you are interested, pleasecontact the Retirement Incomes Working Group via theActuaries Institute john.mclenaghan@actuaries.asn.au Research Note-1 Actuaries Institute6
If a superannuation fundor adviser group has 1,000healthy and wealthy65-year-old couples asclients then they couldexpect around 500 of thesehouseholds to still have onespouse alive at age 95.Research Note-1 Actuaries Institute7
Institute of Actuaries of AustraliaABN 69 000 423 656Level 2, 50 Carrington Street,Sydney NSW Australia 2000t 61 (0) 2 9239 6100actuaries@actuaries.asn.auwww.actuaries.asn.au
different advice and strategies than if we assume their life expectancy was all age 87. Calculating life expectancy - suggested minimum approach The Actuaries Institute recommends that as a minimum, life expectancy be calculated using the AGA's published mortality tables as follows: (1) Refer to the most recent Australian Life