Transcription
Society of Actuaries Research BriefImpact of COVID-19June 12, 2020June 2020
2Society of Actuaries Research BriefImpact of COVID-19June 12, 2020AUTHORSR. Dale Hall, FSA, MAAA, CERA, CFACynthia S. MacDonald, FSA, MAAAPeter J. Miller, ASA, MAAAAchilles N. Natsis, FSA, MAAALisa A. Schilling, FSA, EA, FCA, MAAASteven C. Siegel, ASA, MAAAJ. Patrick Wiese, ASAREVIEWERSMichael C. Dubin, FSA, FCAS, FCA, MAAATimothy J. Geddes, FSA, EA, FCA, MAAAUmesh Haran, FSA, ACIA, CERAJing Lang, FSA, FCIARonald Poon Affat, FSA, FIA, MAAA, CFAMax J. Rudolph, FSA, MAAA, CERA, CFANazir Valani, FSA, FCIA, MAAAGreger VigenCaveat and DisclaimerThis study is published by the Society of Actuaries (SOA) and contains information from a variety of sources. The study is for informational purposes onlyand should not be construed as professional or financial advice. The SOA does not recommend or endorse any use of the information provided in thisstudy. The SOA makes no warranty, express or implied, or representation whatsoever and assumes no liability in connection with the use or misuse of thisstudy.Copyright 2020 by the Society of Actuaries. All rights reserved.Copyright 2020 Society of Actuaries
3CONTENTSIntroduction. 5Key Statistics. 6Reported Cases . 6Worldwide Cases . 6U.S. and Canadian cases . 8U.S. Subpopulations . 10Case Fatality Rates . 11CFRs by Age Group . 12U.S. Subpopulations . 14CFR Limitations . 15Reported Cases vs. Actual Cases. 19COVID-19 Mortality Rate Curves . 19COVID-19 Mortality Versus Other Causes of Death . 22Comorbidities in COVID-19 Deaths . 23COVID-19 Mortality Relative to All Causes of Death . 24Excess Mortality . 25COVID-19 Deaths in Senior Care Facilities . 26Comparison to Past Pandemics and Influenza . 28COVID-19 and Past Epidemics and Pandemics . 28COVID-19 and Influenza . 28Mortality by Socioeconomic status . 30Health Care Cost and Utilization . 31Supply of Medical Resources . 32Hospitalization Rates . 32Comorbidities . 38COVID-19 Treatment . 39Non-COVID-19 Health care . 40Mental Health . 41Infection Spread Rate . 41Economic and Asset Impact . 44Macroeconomic Variables . 44Monetary and Fiscal Policy . 44Employment. 46Gross Domestic Product. 47Asset Values and Volatility. 49Low Interest Rate Environment . 50Reinvestment and Default Risk . 51Impact on Insurance Industry. 54Impact on Life Insurance Companies . 54Impact on Health Insurance Companies . 55Impact on Property/Casualty Coverages . 57Business Interruption Insurance . 57Cancellation Insurance . 58Workers’ compensation . 58Personal Automobile Insurance. 59Medical Malpractice Insurance . 60Financial Guaranty/Mortgage Guaranty . 60Impact on Captive Insurance Companies . 60Copyright 2020 Society of Actuaries
4Changes in Insurance Regulation and Contractual Requirements . 60Cyber Risk . 61Impact on Retirement Plans . 62Corporate Defined Benefit Retirement Plans . 62Multiemployer Defined Benefit Retirement Plans . 63Public Defined Benefit Retirement Plans. 64Defined Contribution Retirement Plans . 65Impact on Social Insurance . 67U.S. Social Insurance PRograms . 67Retirement . 67Health Care . 67Lost Employment . 68Canadian Social Insurance Programs . 68Operational and Emerging Risks. 70Hospital Operations . 70Food Supply Risks. 72Remote Work . 73Employment Law . 73Internet Service Provider and Virtual Private Network Capacity and Fraud . 74Stockpiling . 74Event Cancellations and Restaurant Closings. 75International Trade Dependency . 75Alternative Entertainment Distribution . 75Climate Change and The Risk of Extreme Weather and Other Natural Hazards. 76Reopening . 78Previous SOA Research Highlights . 81Impact on the U.S. Life Insurance Industry. 81Comparison to Current COVID-19 Events. 81Impact on the U.S. Health Insurance Industry . 82Low and Negative Interest Rate Research . 82End Notes . 83Additional References . 98Key Statistics. 98Economic and Asset Impact . 99Operational and Emerging Risks . 100Appendix: Additional Data . 101Worldwide Data . 101U.S. Data . 102Canadian Data . 103About The Society of Actuaries . 104Copyright 2020 Society of Actuaries
5Society of Actuaries Research BriefImpact of COVID-19June 12, 2020IntroductionIn late December 2019, doctors in the city of Wuhan, China, began to piece together information from severalmedical cases showing similar symptoms. As 2019 ended, Chinese officials announced a pneumonia-like outbreakand began to identify a “novel coronavirus” linked to the cases. The coronavirus, named “SARS-CoV-2,” causes therespiratory disease named “coronavirus disease 2019” (COVID-19). 1 By January 23, over 600 cases had beenconfirmed, 2 and Wuhan and other areas in China instituted social distancing policies and travel restrictions. 3 OnMarch 11, World Health Organization (WHO) publicly characterized COVID-19 as a pandemic, 4 and on March 13, theUnited States declared the COVID-19 outbreak a national emergency. 5By June 10, 2020, 7.4 million confirmed cases of COVID-19 had been reported worldwide, and the count continuesto climb with general agreement that the number is actually higher due to delays in full testing and reporting inmany countries. Approximately 188 countries have reported at least one confirmed case and about 416,000 deathsfrom COVID-19. 6 It is important to recognize that the number of reported confirmed cases for any disease typicallylags the number of actual confirmed cases. As a result, the number of reported confirmed cases typically continuesto rise after the actual number of new confirmed cases declines.The health, mortality and economic focus is of unprecedented international concern compared to recent times.Financial markets have been volatile as new economic information becomes available, monetary policies areimplemented, and value and opportunity come in and out of favor with investors. Supply chains of internationaloperations are greatly impacted as well, as many major worldwide manufacturers are evermore connected acrosscontinents. Unemployment rates have risen as the world adjusts to lower levels of economic activity.A confluence of risks has come together. Operational and financial risks have emerged, compounding the currentsituation. Actuaries, who specialize in quantifying and managing risk, will be watching for any additional risk eventsthat layer on to the current environment, especially ones that may cause additional property, mortality and healthrisks such as catastrophic weather events. This update to the Society of Actuaries (SOA) Research Brief on theImpact of COVID-19 has been constructed to highlight some of the key continuing and new features of thepandemic all around the world and contemplate the risks for the actuarial profession to consider in their work.Noteworthy changes since the May 15 edition of this report are marked by an icon:Updated numbersRevised materialNew materialCopyright 2020 Society of Actuaries
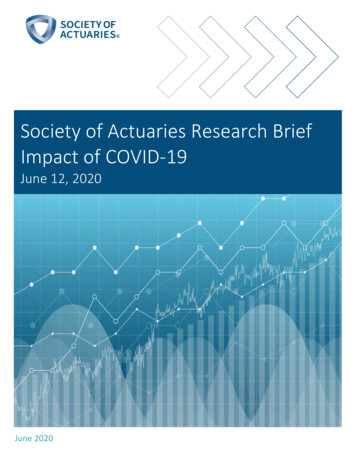
6Key StatisticsREPORTED CASESWORLDWIDE CASESNational health organizations around the world have been fast at work in connecting with health care providers tocollect current case information. Confirmed cases are a function of the ability for any public health agency acrosscountries to distribute, administer and collect results from their respective health systems. Through June 10, 2020,740 million confirmed cases have been reported worldwide. And new cases continue at a generally increasing trend(Figure 1).Figure 1WORLDWIDE REPORTED CONFIRMED COVID-19 NEW CASES, JUNE 10, 2020160,000140,000120,0007-Day Moving Average100,00080,00060,00040,000Daily New Reported ConfirmedCOVID-19 4Feb-26Feb-19Feb-12Feb-05Jan-29Jan-220Data source: Johns Hopkins University & Medicine. Coronavirus Resource Center. https://coronavirus.jhu.edu/map.html. And authors’calculations.As of June 10, 2020, roughly three-quarters of the world’s confirmed COVID-19 cases are reported from 15countries. Ten of those countries comprise about two-thirds of the world’s confirmed cases, with slightly more thanhalf (52.1%) of the world’s confirmed cases in five countries: U.S., Brazil, Russia, U.K. and India. Figure 2 shows theperiodic progression of confirmed cases for the top 15 countries for reported confirmed cases. Since the May 15,2020, edition of this report, Brazil and India have displaced Spain and Italy in the top five countries for numbers ofreported confirmed cases, and China is no longer among the top 15 countries for numbers of reported confirmedcases.Copyright 2020 Society of Actuaries
7Figure 2TOP 15 COUNTRIES FOR NUMBER OF REPORTED CONFIRMED COVID-19 CASES, JUNE 10. 2020Number of Confirmed COVID-19 Cases Reported During Period hileMexicoPakistan10-Jun% of Data source: Johns Hopkins UniversityThe number of confirmed cases in the U.S. is nearly three times the number of reported confirmed cases in Brazil,but the U.S. is roughly 50% more populous than Brazil. Figure 3 puts the number of reported cases in context ofcountry size by showing the number of reported confirmed cases per million of population and includes Canada forreference. The day that a country’s reported cumulative reported confirmed COVID-19 cases per million reached orexceeded 10.0 is considered day zero (day 0). The appendix includes a table showing data from Figures 2 and 3.Figure 3REPORTED CONFIRMED COVID-19 CASES PER MILLION—15 COUNTRIES WITH THE MOST CASES, JUNE 10, 20209,000Chile: 19-Apr8,0007,000Peru: 14-AprU.S.: 19-MarSpain: 17-MarU.K.: 26-Mar6,000Canada: 02-Apr5,000Italy: 10-Mar4,000Brazil: 04-AprRussia: 09-AprFrance: 19-MarGermany: 18-MarTurkey: 30-MarIran: 12-Mar3,0002,0001,000Pakistan: 21-AprMexico: 22-AprIndia: 13-AprWorld: 01-Feb00102030405060708090100110120Days Since 10 Reported Confirmed COVID-19 Cases Per MillionData source: Johns Hopkins University and authors’ calculationsCopyright 2020 Society of Actuaries
8Looking at the number of reported confirmed COVID-19 cases per million provides a population-adjusted metric forcomparing the number of cases across countries. Countries with the highest number of cases per million do notnecessarily experience the highest number of deaths per million. Figure 4 plots at the number of reported COVID-19deaths per million against the number of reported confirmed COVID-19 cases per million for all countries with atleast 1,000 reported COVID-19 deaths. Countries that have greater than 300 deaths per million are highlighted byred diamonds, and countries that have greater than 3,000 cases per million but fewer than 300 deaths per millionare highlighted by light blue squares. Plot points for the U.S., Canada and the world—key points of reference formany readers—appear in dark blue triangles.Through June 7, 2020, Chile reports the greatest number of confirmed COVID-19 cases per million—7,078—yet arelatively low number of COVID-19 deaths per million—86. Belgium reports the greatest number of COVID-19deaths per million—5,133, which is significantly greater than the next highest country, the U.K. at 4,238—and also arelatively high number of confirmed COVID-19 cases per million—832. Of all countries reporting at least 1,000COVID-19 deaths, China reported the lowest number of confirmed COVID-19 cases per million and the lowestnumber of COVID-19 deaths per million—59 and 3, respectively.Figure 4COMPARISON OF COVID-19 REPORTED CONFIRMED CASES PER MILLION AND COVID-19 REPORTED DEATHS PERMILLION FOR COUNTRIES WITH AT LEAST 1,000 REPORTED COVID-19 DEATHS, JUNE 10, 2020700Reported COVID-19 Deaths Per zerlandBrazilPortugal100 WorldIranTurkey01,0002,000IrelandU.S. 3,000cases permillionCanadaGermany0 300deaths permillionSwedenFrance400SpainPeruPoints 009,000Reported Confirmed COVID-19 Cases Per MillionData source: Johns Hopkins University and authors’ calculationsU.S. AND CANADIAN CASESFigure 5 shows the 15 U.S. states with the greatest number of confirmed cases per million as of June 10, 2020;Figure 6 shows the equivalent for Canadian provinces. Refer to the appendix for data from the graphs.It is important to recognize that these data show reported cases, not actual cases. Major differences exist betweentesting and reporting, and the differences vary by country. Countries with the highest reported case rates likelyCopyright 2020 Society of Actuaries
9reflect serious infection rates, while countries with low reported case rates may reflect slower reporting orunderreporting.Figure 5CONFIRMED CASES PER MILLION: 15 TOP U.S. STATES, JUNE 10, 2020New Jersey: 16-MarNew York: 12-MarMassachusetts: 11-Mar20,00018,000Rhode Island: 13-Mar16,000D.C.: 16-MarConnecticut: 16-Mar14,000Delaware: 17-MarIllinois: 17-Mar12,000Maryland: 18-MarLouisiana: 14-MarNebraska: 17-MarIowa: 18-MarPennsylvania: 18-MarSouth Dakota: 16-MarMississippi: 18-Mar10,0008,0006,0004,000U.S.: 15-Mar2,000World: 22-Feb005 10 15 20 25 30 35 40 45 50 55 60 65 70 75 80 85 90 95 100 105Days Since 10 Reported Confirmed COVID-19 Cases Per MillionData source: Johns Hopkins University and authors’ calculationsFigure 6CONFIRMED CASES PER MILLION BY CANADIAN PROVINCE, JUNE 10, 2020Quebec: 16-Mar12,00010,0008,0006,000World: 22-FebCanada: 16-Mar4,0002,000005 10 15 20 25 30 35 40 45 50 55 60 65 70 75 80 85 90 95Ontario: 13-MarAlberta: 13-MarNova Scotia: 16-MarN.L.: 17-MarSaskatchewan: 16-MarB.C: 08-MarN.B.: 16-MarP.E.I.: 15-MarManitoba: 16-MarDays Since 10 Reported Confirmed COVID-19 Cases Per MillionData source: Johns Hopkins University and authors’ calculationsCopyright 2020 Society of Actuaries
10In the U.S., the states with the greatest number of reported COVID-19 confirmed cases per million tend to includelarge, densely populated metropolitan areas. Those states are generally followed by states with meat packingfacilities. In Canada, Quebec has the greatest number of reported COVID-19 confirmed cases per million—morethan double the rate of Ontario, the province with the second greatest number.Considering both cases per million and deaths per million, Figure 7 looks at all U.S. States and Canadian provincesthat have reported at least 1,000 COVID-19 deaths through June 10, 2020. New Jersey and New York have thegreatest numbers of both reported confirmed COVID-19 cases per million and reported COVID-19 deaths permillion. New Jersey reports 18,520 confirmed COVID-19 cases per million and 1,375 COVID-19 deaths per million.New York follows, reporting 16,032 confirmed COVID-19 cases per million and 1,287 COVID-19 deaths per million.Texas reports the least numbers in both categories, 2,637 002 confirmed COVID-19 cases per million and 64 COVID19 deaths per million. Two Canadian provinces have reported at least 1,000 COVID-19 deaths: Quebec, with 11,390cases per million and 1,070 deaths per million, and Ontario, with 4,918 cases per million and 383 deaths per million.Figure 7COMPARISON OF COVID-19 REPORTED CONFIRMED CASES PER MILLION AND COVID-19 REPORTED DEATHS PERMILLION FOR U.S. STATES AND CANADIAN PROVINCES WITH AT LEAST 1,000 COVID-19 DEATHS, JUNE 10, 2020Reported COVID-19 Deaths Per Million1,6001,400New 0 FloridaTexas0WorldMassachusetts 300deaths permillionIndianaMichiganPennsylvania1,000400New Jersey02,000Ohio 3,000cases permillionLouisianaMarylandIllinoisOntarioPoints ofreferenceU.S.ColoradoArizonaCalifornia4,000North rgia14,00016,00018,00020,000Reported Confirmed COVID-19 Cases Per MillionData source: Johns Hopkins University and authors’ calculationsU.S. SUBPOPULATIONSNew York City and the City of Chicago make available COVID-19 statistics on the number of reported confirmedCOVID-19 cases and reported COVID-19 deaths by race/ethnicity (Figure 8). Note that some researchers caution thatmore thorough study is needed before drawing broad conclusions about the link between race/ethnicity and COVID19 because many reported statistics exclude race/ethnicity data. 7In both cities, white and Asian populations experience lower COVID-19 case and death rates than do black andLatinx populations. In New York City, at 1,554 cases per 100,000 people, the black population case rate outpaces thecase rates of all other race/ethnicities, although the Latinx case rate is not far behind at 1,459 per 100,000. TheCopyright 2020 Society of Actuaries
11white and Asian case rates are roughly 2.5 times lower than the black case rate at 110 and 102, respectively. NewYork City COVID-19 death rates by race/ethnicity follow similar patterns, with black and Latinx rates more than twicethe white and Asian rates. However, at 239 per 100,000, the Latinx death rate exceeds the black death rate of 222per 100,000.In Chicago, Asian and white populations experience about the same COVID-19 case rates (591 and 600 per 100,000,respectively), although the Asian death rate of 61 per 100,000 slightly exceeds that of the white population at 49per 100,000. Similar to New York City, the COVID-19 death rate for blacks in Chicago in more than 2.5 times the ratefor whites—131 per 100,000 for blacks compared to 49 per 100,000 for whites. At 90 per 100,00, the Latinx COVID19 death rate is nearly 1.9 times the white rate of 49 per 100,000.Figure 8COMPARISON OF NEW YORK CITY AND CHICAGO COVID-19 CASE RATES AND COVID-19 DEATHS RATES BYRACE/ETHNICITY, JUNE 10, 2020300Hispanic/Latino,New YorkCOVID-19 Deaths per 100,000250Black/African-American,New York200150Asian/Pacific-Islander,New York10050White, New YorkBlack, non-Latinx,ChicagoLatinx, ChicagoAsian, non-Latinx, ChicagoWhite, non-Latinx, Chicago005001,000Other, non-Latinx, Chicago1,5002,0002,500COVID-19 Cases per 100,000Data source: New York City Department of Health as of June 8, 2020, page andChicago Department of Public Health as of June 10, 2020, e/latest-data.html.CASE FATALITY RATESThe ultimate rate of mortality from COVID-19 will evolve over time, after the actual number of cases, rather thanthe reported number of cases, is better understood. 8 This may take years.At the start of a pandemic, mortality rates are crudely estimated using a statistic known as the “case fatality rate”(CFR), which divides the known deaths by the identified number of cases. 9 These raw estimates, however,
June 2020 Society of Actuaries Research Brief . Impact of COVID-19 . June 12, 2020