Transcription
LIFE EXPECTANCYCOMPARISON IN 2021October 2021
Life Expectancy Comparison in 2021The life expectancies on the following pages were computed from various mortality tables that were built from different subsets of the U.S.population. Differences in life expectancies reflect differences in the mortality experience of each population subset.Life expectancies reflect the average experience of the population subset. About half of the people in the population subset are expected to livelonger than life expectancy, and about half are not expected to survive to life expectancy. When planning for retirement, it is important toconsider the likelihood of living beyond life expectancy.Page 3 compares life expectancies for people who are age 65 in 2021, and page 4 compares life expectancies for people who are age 25 in 2021.Differences in life expectancy between the ages reflect two competing forces:1.Some people who are age 25 now will not survive until age 65, which means that if future anticipated improvements in mortality are notprojected, or built into the calculations, age 65 life expectancies are generally older than age 25 life expectancies.2.Life expectancies for people currently age 25 reflect more years for anticipated future improvements in mortality experience, which arebuilt into life expectancy calculations. Future improvements vary by age and by the number of years into the future. Combined withmortality experience that varies by age across populations, the result can be life expectancy at age 25 being either greater or less than lifeexpectancy at age 65.Pages 5–7 compare the probabilities in 2021 of people of various ages living to age 100.Note that none of these life expectancies or probabilities reflect the impact of COVID-19.2
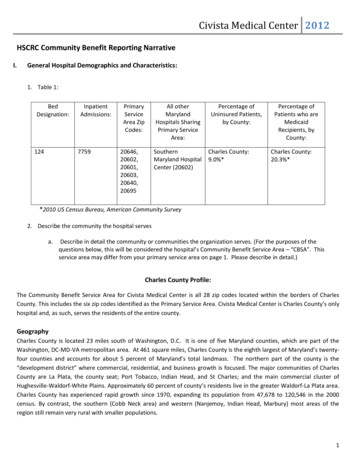
Life Expectancy Comparison at Age 65, 2021U.S. Population2018 CDCPrivate Pension Plans2018 SSA87.887.8White Top 25%CollarPay86.6BlueCollar87.3Female87.3Bottom25% lar85.6*SSA84.6Male84.1BlueCollar84.2*SSASafety Employees87.1BelowAvg Pay88.2AboveAvg ic Pension Plans86.1Top 25%Pay84.5BelowAvg Pay86.9AboveAvg PayGeneral Employees88.1BelowAvg Pay88.7AboveAvg Pay88.3Female86.785.4Male84.5BelowAvg Pay86.5AboveAvg PayTeachers89.7BelowAvg PayIndividual Life Insurance(Issue Age 65)90.1AboveAvg lowAvg Pay88.2AboveAvg Group Life Insurance88.8Nonsmoke86.3Male84.0Bottom25% Pay83.0*SSACDC: Centers for Disease Control andPrevention Period Life Tables, Table ASSA: Social Security AdministrationPeriod Life Table* Unprojected** Generationally projected to 2021and beyond with MP-2021Pri-2012 Mortality Tables generationallyprojected to 2021 and beyond with MP2021Illustration is not to scalePub-2010 Mortality Tables generationally projected to 2021 and beyond with scaleMP-20212015 Individual Valuation Basic Table(VBT) generationally projected to 2021and beyond with 2015 VBTImprovement ScaleEstimated from SOA 2016 GroupLife Insurance Experience Report,generationally projected to 2021and beyond with MP-20213
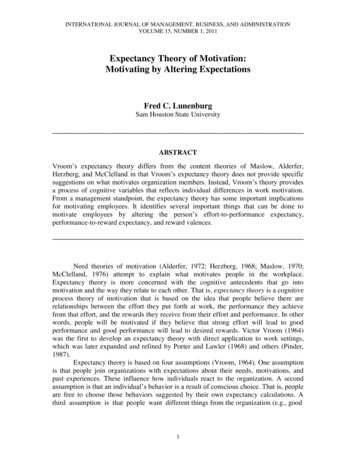
Life Expectancy Comparison at Age 25, 2021U.S. Population2018 CDCPrivate Pension Plans2018 SSAPublic Pension PlansSafety EmployeesGeneral Employees88.2BelowAvg Pay88.388.5White Top % BlueCollar86.1Top 25%Pay87.8BelowAvg Pay89.2AboveAvg Pay88.4Female86.885.5Male84.0BelowAvg Pay89.7AboveAvg Pay89.0Female87.085.1Male83.2BelowAvg Pay86.9AboveAvg PayTeachers90.6BelowAvg PayIndividual Life Insurance(Issue Age 65)91.3AboveAvg Pay91.0Female89.687.483.5Smoke Female89.3AboveAvg Pay90.8Female88.887.188.4Male87.6BelowAvg Pay89.2NonsmokeGroup Life AboveAvg Pay82.8Bottom25% Pay81.6*SSACDC: Centers for Disease Control andPrevention Period Life Tables, Table ASSA: Social Security AdministrationPeriod Life Table* Unprojected** Generationally projected to 2021and beyond with MP-2021Pri-2012 Mortality Tables generationallyprojected to 2021 and beyond with MP2021Illustration is not to scalePub-2010 Mortality Tables generationally projected to 2021 and beyond with scaleMP-20212015 Individual Valuation Basic Table(VBT) generationally projected to 2021and beyond with 2015 VBTImprovement ScaleEstimated from SOA 2016 GroupLife Insurance Experience Report,generationally projected to 2021and beyond with MP-20214
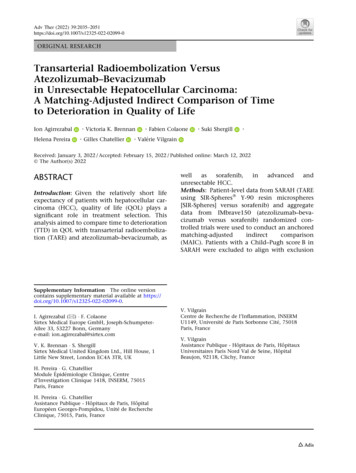
Probability in 2021 of Living to Age l mortality tables are generationally projected to 2021 and beyond with MP-2021 unless otherwise specified. SSA: Social Security Administration Period Life Table. Private pension plans: Pri-2012 Mortality Tables. Public pensionplans: Pub-2010 Mortality Tables . Individual life insurance: 2015 Individual Valuation Basic Table (VBT) generationally projected to 2021 and beyond with 2015 VBT Improvement Scale. Group life insurance: estimated from SOA 2016Group Life Insurance Experience Report.MaleSSA, projectedAll DataPrivateBlue CollarWhite CollarPensionLowestPaid 25%PlansHighest Paid 25%Safety EmployeesSafety Median PaySafety Median PayPublicGeneral EmployeesPensionGeneral Median PayPlansGeneral Median PayTeachersTeachers Median PayTeachers Median PayInd. Life Insurance (Issue Current Age)Group Life InsuranceGeneral 8.4%7.3%9.8%10.4%9.7%6.6%10.5%FemaleSSA, projectedAll DataPrivateBlue CollarWhite CollarPensionLowest Paid 25%PlansHighest Paid 25%Safety EmployeesSafety Median PaySafety Median PayPublicGeneral EmployeesGeneral Median PayPensionGeneral Median PayPlansTeachersTeachers Median PayTeachers Median PayInd. Life Insurance (Issue Current Age)Group Life Insurance5%0%General Population15%25-Year-Old65-Year-Old5
Probability in 2021 of Living to Age 100PublicPensionPlansGeneral .3%4.1%7.0%8.1%6.6%6.4%All mortality tables are generationally projected to 2021 and beyond with MP-2021 unless otherwise specified. SSA: Social Security Administration Period Life Table. Private pension plans: Pri-2012 Mortality Tables. Public pensionplans: Pub-2010 Mortality Tables . Group life insurance: estimated from SOA 2016 Group Life Insurance Experience Report.MalePublicPensionPlansSSA, projectedAll DataBlue CollarWhite CollarLowest Paid 25%Highest Paid 25%Safety EmployeesSafety Median PaySafety Median PayGeneral EmployeesGeneral Median PayGeneral Median PayTeachersTeachers Median PayTeachers Median PayGroup Life Insurance5%0%PrivatePensionPlans7.7%FemaleSSA, projectedAll DataBlue CollarWhite CollarLowest Paid 25%Highest Paid 25%Safety EmployeesSafety Median PaySafety Median PayGeneral EmployeesGeneral Median PayGeneral Median PayTeachersTeachers Median PayTeachers Median PayGroup Life InsuranceGeneral Population15%45-Year-Old35-Year-Old6
Probability in 2021 of Living to Age 100PublicPensionPlansGeneral 0%4.0%3.1%5.0%2.8%3.6%4.6%3.1%5.0%5.8%4.8%4.3%All mortality tables are generationally projected to 2021 and beyond with MP-2021 unless otherwise specified. SSA: Social Security Administration Period Life Table. Private pension plans: Pri-2012 Mortality Tables. Public pensionplans: Pub-2010 Mortality Tables . Group life insurance: estimated from SOA 2016 Group Life Insurance Experience Report.MalePublicPensionPlansSSA, projectedAll DataBlue CollarWhite CollarLowest Paid 25%Highest Paid 25%Safety EmployeesSafety Median PaySafety Median PayGeneral EmployeesGeneral Median PayGeneral Median PayTeachersTeachers Median PayTeachers Median PayGroup Life FemaleSSA, projectedAll DataBlue CollarWhite CollarLowest Paid 25%Highest Paid 25%Safety EmployeesSafety Median PaySafety Median PayGeneral EmployeesGeneral Median PayGeneral Median PayTeachersTeachers Median PayTeachers Median PayGroup Life InsuranceGeneral Population10%75-Year-Old55-Year-Old7
About the Society of Actuaries Research InstituteServing as the research arm of the Society of Actuaries (SOA), the SOA Research Institute provides objective, data-driven research bringingtogether tried and true practices and future-focused approaches to address societal challenges and your business needs. The Institute providestrusted knowledge, extensive experience and new technologies to help effectively identify, predict and manage risks.Representing the thousands of actuaries who help conduct critical research, the SOA Research Institute provides clarity and solutions on risksand societal challenges. The Institute connects actuaries, academics, employers, the insurance industry, regulators, research partners,foundations and research institutions, sponsors and non-governmental organizations, building an effective network which provides support,knowledge and expertise regarding the management of risk to benefit the industry and the public.Managed by experienced actuaries and research experts from a broad range of industries, the SOA Research Institute creates, funds, developsand distributes research to elevate actuaries as leaders in measuring and managing risk. These efforts include studies, essay collections,webcasts, research papers, survey reports, and original research on topics impacting society.Harnessing its peer-reviewed research, leading-edge technologies, new data tools and innovative practices, the Institute seeks to understand theunderlying causes of risk and the possible outcomes. The Institute develops objective research spanning a variety of topics with its strategicresearch programs: aging and retirement; actuarial innovation and technology; mortality and longevity; diversity, equity and inclusion; healthcare cost trends; and catastrophe and climate risk. The Institute has a large volume of topical research available, including an expandingcollection of international and market-specific research, experience studies, models and timely research.Society of Actuaries Research Institute475 N. Martingale Road, Suite 600Schaumburg, Illinois 60173www.SOA.org
Prevention Period Life Tables, Table A SSA: Social Security Administration . Period Life Table * Unprojected ** Generationally projected to 2021 and beyond with MP2021 . Pri-2012 Mortality Tables generationally projected to 2021 and beyond with MP-2021 . 2015 Individual Valuation Basic Table (VBT) generationally projected to 2021 and beyond with 2015 VBT