Transcription
Civista Medical Center 2012HSCRC Community Benefit Reporting NarrativeI.General Hospital Demographics and Characteristics:1. Table yServiceArea ZipCodes:All otherMarylandHospitals SharingPrimary thernMaryland HospitalCenter (20602)Percentage ofUninsured Patients,by County:Charles County:9.0%*Percentage ofPatients who areMedicaidRecipients, byCounty:Charles County:20.3%**2010 US Census Bureau, American Community Survey2. Describe the community the hospital servesa.Describe in detail the community or communities the organization serves. (For the purposes of thequestions below, this will be considered the hospital’s Community Benefit Service Area – “CBSA”. Thisservice area may differ from your primary service area on page 1. Please describe in detail.)Charles County Profile:The Community Benefit Service Area for Civista Medical Center is all 28 zip codes located within the borders of CharlesCounty. This includes the six zip codes identified as the Primary Service Area. Civista Medical Center is Charles County’s onlyhospital and, as such, serves the residents of the entire county.GeographyCharles County is located 23 miles south of Washington, D.C. It is one of five Maryland counties, which are part of theWashington, DC-MD-VA metropolitan area. At 461 square miles, Charles County is the eighth largest of Maryland’s twentyfour counties and accounts for about 5 percent of Maryland’s total landmass. The northern part of the county is the“development district” where commercial, residential, and business growth is focused. The major communities of CharlesCounty are La Plata, the county seat; Port Tobacco, Indian Head, and St Charles; and the main commercial cluster ofHughesville-Waldorf-White Plains. Approximately 60 percent of county’s residents live in the greater Waldorf-La Plata area.Charles County has experienced rapid growth since 1970, expanding its population from 47,678 to 120,546 in the 2000census. By contrast, the southern (Cobb Neck area) and western (Nanjemoy, Indian Head, Marbury) most areas of theregion still remain very rural with smaller populations.1
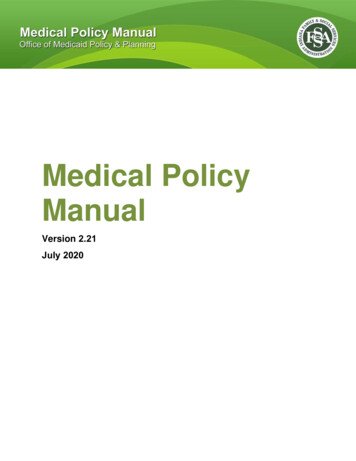
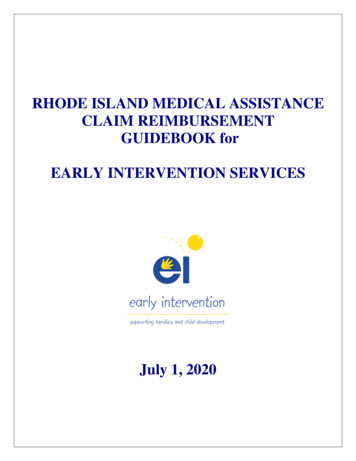
Civista Medical Center 2012PopulationCurrent US Census 2010 estimates are that the population is now 146,551. This magnitude of growth can be seen in thechanges in population density. The 1990 census showed that there were 219.4 individuals per square mile, by 2000, therewere 261.5 individuals per square mile, an increase of 19.2 percent, and by 2010 there were 320.2 individuals per squaremile.TransportationThe percent change in the population growth for Charles County has been slightly greater than the change seen in theMaryland population growth. This growth has created transportation issues for the County in particular for the“development district” in the northern part of the county where many residents commute to Washington D.C. to work. Theaverage work commute time for a Charles County resident is 41.8 minutes, higher than the Maryland average by 10minutes. Public transportation consists of commuter bus for out-of- county travel and the county-run Van Go bus servicefor in-county transportation.DiversityAs the population of the county changes, the diversity of the county also increases. The African American population hasexperienced the greatest increases in population. In 2000, African Americans made up 26% of the total Charles Countypopulation; by 2010, they comprise 41.6% of the total county population. As of 2010, minorities make up 52.1% of theCharles County population. The Hispanic community has also seen increases over the past few years. They now comprise4% of the total county population. This is the one of the highest percentages among the 24 Maryland jurisdictions.The 2010 Charles County gender breakdown is approximately 50/50. Males make up 48.3% of the population, and femalesmake up 51.7% of the county population.Race of Charles County Population, 2000 versus 2009Blue: Non-Hispanic CaucasianPurple(left) & red(right): African AmericanYellow: American IndianGreen: Asian/ Pacific IslanderDk purple(left) and orange(right): Hispanic1% 2% 2%1% 3% 4%26%69%200041%51%2010Source: US Census Bureau; Charles County Quick Facts; 20102
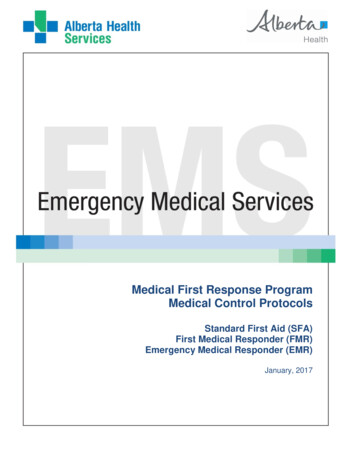
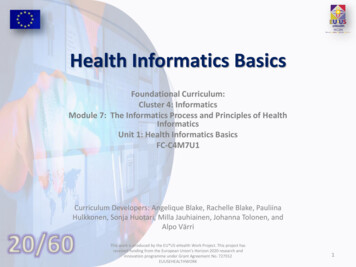
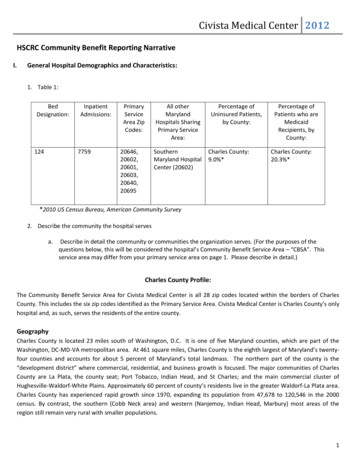
Civista Medical Center 2012EconomyEmployment and economic indicators for the county are fairly strong. The 2010 US Census estimates for Charles Countyfound that 73.8% of the population is currently in the labor work force. Approximately 5.2% of Charles County individualsare living below the poverty level, as compared to 8.6% of Maryland individuals. The Charles County median householdincome was 88,825, well above the Maryland median household income of 70,647. The diversity of the county isrepresented in the business community as well with 29.3% of all Charles County businesses being Black-owned firms. This ishigher than the State of Maryland at 19.3%.EducationCharles County has a larger percentage of high school graduates than Maryland (90.4% vs. 87.8%); however, Charles Countyhas a smaller percentage of individuals with a bachelor’s degree or higher than Maryland (26.1% vs. 35.7%).HousingThere is a high level of home ownership in Charles County (81.8%). The median value of a housing unit in Charles County ishigher than the Maryland average ( 355,800 vs. 329,400). The average number of people in a Charles County household is2.86 persons.Life ExpectancyThe life expectancy for a Charles County resident as calculated for 2009-2011 was 78.4 years. This is similar to the stateaverage life expectancy of 79.2 years.BirthsThere were 1,808 births in Charles County in 2009. Charles County represents 43% of the births in Southern Maryland and2.4% of the total births in Maryland for 2009.Minorities made up over half of the babies born in Charles County in 2009 (52%).2009 Charles County Births by ite48%Source: 2009 Maryland Vital Statistics Report3
Civista Medical Center 2012Health DisparitiesHealth topics where health disparities are seen for the minority population in Charles County:Health TopicHeart DiseasePrevalenceColon and Rectal CancerIncidenceIndicatorRate of ED visits forhypertension per 100,000populationRateWhite: 194.1Black: 368.1SourceMaryland SHIP(HSCRC 2010)Unadjusted Diabetes EDVisit Rates by Black orWhite RaceUnadjusted % Adults atHealthy WeightRate of Chlamydia infectionfor all ages per 100,000 (allages)White: 225Black: 4932010 CigaretteRestitution FundProgram CancerReport per CCHealth NeedsAssessment2010 CigaretteRestitution FundProgram CancerReport per CCHealth NeedsAssessment2010 CigaretteRestitution FundProgram CancerReport per CCHealth NeedsAssessmentMaryland HSCRCper SHIP siteWhite: 28.2Black: 30.1White-109.5Black-569.6Maryland BRFSS perSHIP siteIDEHA 2009 perSHIP SiteAsthmaRate of ED visits for asthmaper 10,000 populationWhite-42.2Black-104.1HSCRC 2010 PerSHIP SiteInfant MortalityInfant Mortality Rate per1,000 birthsWhite/Not Hispanic-4.7Black-10.4VSA 2007-2009 PerSHIP SiteMortalityBreast Cancer IncidenceProstate CancerIncidenceMortalityDiabetes PrevalenceObesitySTDIncidence Rates per 100,000 White: 58.2Black: 64.3Mortality Rates per 100,000 White: 28.1Black: 34.9Incidence Rates per 100,000 White: 104.8Black: 118.1Incidence Rates per 100,000 White: 185.3Black: 249.0Mortality Rates per 100,000 White: 26.3Black: 50.21. 2010 Charles County Current Population Survey Data. United States Census Bureau. Available at: www.census.gov.2. 2000 and 2009 Maryland Vital Statistics Report. Charles County Demographic and Population Data. MarylandDepartment of Health and Mental Hygiene. Available at www.vsa.maryland.gov.4
Civista Medical Center 20123. 2005-2009 US Census Bureau, American Community Survey 5 year estimates, Charles County and Maryland. Available atwww.census.gov.b. In Table II, describe significant demographic characteristics and social determinants that are relevant to theneeds of the community and include the source of the information in each response. For purposes of thissection, social determinants are factors that contribute to a person’s current state of health. They may bebiological, socioeconomic, psychosocial, behavioral, or social in nature. (Examples: gender, age, alcoholuse, income, housing, access to quality health care, education and environment, having or not havinghealth insurance.) (Add rows in the table for other characteristics and determinants as necessary).Table IICharacteristic or determinantCommunity Benefit Service Area(CBSA)Target Population (target population, bysex, race, ethnicity, and average age)Median Household Income within theCBSAPercentage of households with incomesbelow the federal poverty guidelineswithin the CBSAEstimate the percentage of uninsuredpeople by County within the CBSAPercentage of Medicaid recipients byCounty within the CBSA.Life Expectancy by County within the CBSA(including by race and ethnicity wheredata are available).DataPopulation: 149,130Sex: Female 51.7% Male: 48.3%Race and Ethnicity: White 51% Black 41.6% American Indian and Alaska native 0.7% Native Hawaiian and Other Pacific Islanders 0.1% Person reporting 2 or more races 3.5% Hispanic or Latino 4.5% White not Hispanic 47.9%Age: Persons under 5 years 6.2% Persons under 18 years 25.8% Persons 65 years and over 9.8% 88,825Source2010 US CensusQuick Facts2010 US CensusMaryland SHIP4.9%9.0%20.3%The life expectancy from birth for a Charles Countyresident as calculated for 2009-2011 was 78.4 years.2010 US CensusAmericanCommunitySurvey2010 US CensusAmericanCommunitySurvey2011 MarylandVital Statistics5
Civista Medical Center 2012See SHIP website:This is similar to the state average life expectancy of79.2 years.White: 78.6Black: 77.4Report. CharlesCountyDemographic andPopulation Data.Maryland DHMHMortality Rates by County within the CBSA Age adjusted all-cause death rate for Charles County for 2011 Vital Statistics(including by race and ethnicity where2009 – 2011 is 777.8 per 100,000 population. Race and Reportdata are available).ethnic data is not available at the county level.Access to healthy food, transportationAccess to healthy food:USDA 2000and education, housing quality andMaryland SHIP % of census tracts with food deserts: 0exposure to environmental factors thatnegatively affect health status by CountyTransportation:within the CBSA. (to the extent Mean travel time to work: 41.8 mininformation is available from local orcounty jurisdictions such as the localEnvironmental Factors:health officer, local county officials, or # of days Air Quality Index exceeds 100: 9other resources) % of children tested who have blood leadlevels 10 mg/dl: .098Housing: Home ownership: 81.1% Renter occupied housing: 18.9%Available detail on race, ethnicity, andlanguage within CBSA. Access to Care: Language other than English spoken at home:6.4%See race and ethnicity information in“Community Benefit Service Area TargetPopulation”81.5% of Charles County residents traveloutside of the county for medical care at somepoint.% Mothers who received prenatal care 1sttrimester ; 75.4o White/NH: 81.3o Black: 71.2o Asian: 76.7o Hispanic: 62.7Infant Mortality Rate: 7.4%o White/NH: 4.7%o Black: 10.4%Number of federally designated medicallyunderserved areas in Charles County: 6o Brandywineo Allens Fresho Thompkinsvilleo Hughesvilleo Marburyo Nanjemoy2010 US CensusData, Quick Facts2010 US Census2011 CharlesCounty HealthNeeds AssessmentMaryland SHIP;2011 HPSADesignation2007 MarylandPhysician6
Civista Medical Center 2012EducationII. Number of physician shortage specialties inSouthern Maryland: 28Workforce Study 90.4% persons 25 high school graduates26.1% persons 25 bachelors degree or higherCharles CountyCommunityHealth NeedsAssessment 2011;2010 US CensusCommunity Health Needs Assessment (CHNA)1) Description of CHNA process:Civista Health Inc and the Charles County Department of Health (CCDOH) collaborated to complete a comprehensiveassessment of the health needs (CHNA) of Charles County, Maryland. An epidemiologist with a Master’s Degree in PublicHealth Epidemiology was contracted to analyze the qualitative and quantitative data. Civista lead the effort and covered80% of the cost of the CHNA.To provide a comprehensive assessment of the health needs of the county, a four method plan was developed whichincluded 4 different sources of data: a long online survey of Charles County residents perceptions of health and healthbehaviors, a short paper survey on health perceptions throughout the county, 7 focus groups with community leaders,citizens, and stakeholders, and a quantitative data analysis.The use of the multiple data collection methods strengthened the validity of the assessment’s findings, as well as ensuredthat Charles County residents had an opportunity to participate in the assessment process and to feel invested in itsoutcome. Three hundred and two (302) Charles County residents completed the 74 question online survey that was createdusing Survey Monkey. The link to the survey was available on the Civista Health Inc website. The first section of the surveyasked participants about their perception of health and health services within the county. The second section asked themabout their health behaviors, in order to determine their risk for the development of certain health conditions.A short three question survey was distributed throughout the county regarding perceptions of health within the county. Atotal of 200 short surveys were completed. Surveys were located throughout the county including Civista waiting rooms,CCDOH waiting rooms, libraries, senior centers, community centers. Thirty five were completed in Spanish (17.5%).Seven focus groups were held throughout the county. The focus group topics included: age-related health issues, chronicdisease specific health, special populations, county leadership, substance abuse, youth through the school nurses, and thePartnerships for a Healthier Charles County (PHCC) (community leaders and stakeholders). Approximately 165 peopleparticipated in the county focus groups.Quantitative data was analyzed for several health topics including: mortality, population and demographic data, natality,infant mortality, heart disease, stroke, hypertension, access to health care/health uninsurance, cancer, asthma, injuries,diabetes, obesity, osteoporosis, arthritis, dementia/Alzheimer’s disease, communicable disease, sexually transmitteddiseases, HIV/AIDS, mental health, dental health, substance abuse, disabilities, and tobacco use.7
Civista Medical Center 2012Cumulative analysis of all quantitative and qualitative data identified the top 11 health needs of Charles County which waspresented to the Partnerships for a Healthier Charles County, a coalition of Charles County agencies and organizations. Thedirection of Partnerships for a Healthier Charles County is guided by the Steering Committee which consists of leadershipfrom Civista, Charles County Department of Health, Charles County Public Schools and the College of Southern Maryland.2.) Description of individuals and organizations consulted for CHNA input:Seven focus groups were held throughout the county with representation from the following organizations. The focus grouptopics included: age-related health issues, chronic disease specific health, special populations, county leadership, substanceabuse, youth through the school nurses, and the Partnerships for a Healthier Charles County (PHCC) (community leadersand stakeholders). Approximately 165 people participated in the county focus groups.Partnerships for a Healthier Charles CountyCivista HealthCivista Health, Board Of DirectorsCharles County Department of HealthUniversity of Maryland Clinical Trials ProgramBel Alton Alumni AssociationCharles County Department of Community Services, TransportationTri County Council for Southern MarylandMinister’s Alliance of Charles CountyCC Department of Social servicesMaryland Foundation for Quality healthcareHealth Partner’s ClinicShiloh Community United Methodist ChurchCC Nursing and Rehabilitation CenterAlzheimer’s AssociationCenter for ChildrenChesapeake Potomac Home Health AgencyCollege of Southern MarylandCharles County Department of AgingPriority partnersBig Brothers/Big sistersCommunity Hispanic AdvocatesBlack Leadership Council for ExcellenceYoung Researchers Community ProjectPinnacle Center (Mental Health)HospiceBreast Cancer Support AdvocatesCharles County Public Schools - School NursesCharles County CommissionersCharles County Emergency ServicesCharles County Sheriff’s OfficeSo MD DelegatesCharles County Community FoundationCommunity PhysiciansCharles County Fire and Rescue Board8
Civista Medical Center 2012Survey for community members:302 Charles County residents completed the 74 question online survey that was created using Survey Monkey. Thelink to the survey was available on the Civista Health website. A short 3 question survey was distributed throughoutthe county regarding perceptions of health within the county. A total of 200 short surveys were completed. Surveyswere located throughout the county including Civista waiting rooms, Charles County Department of Health waitingrooms, libraries, senior centers, community centers. 35 were completed in Spanish (17.5%).3.) The most recent community health needs assessment was completed in October 2011.4.) Although not required by federal law until 2013, has your hospital conducted a Community Health NeedsAssessment that conforms to the definition on the previous page within the past three fiscal years? **Please beaware, the CHNA will be due with the FY 2013 Community Benefit Report.X YesNoLink to Charles County Community Health Needs ity Benefit Administration1. Please answer the following questions below regarding the decision making process of determining which needs inthe community would be addressed through community benefits activities of your hospital?a. Is Community Benefits planning part of your hospital’s strategic plan?X YesNob.What stakeholders in the hospital are involved in your hospital community benefit process/structure toimplement and deliver community benefit activities? (Please place a check next to any individual/groupinvolved in the structure of the CB process and provide additional information if necessary):i. Senior Leadership1. X CEO2. X CFO3. X Other (please specify) Board of Directorsii. Clinical Leadership1.2.3.4.X PhysicianX NurseX Social WorkerOther (please specify)iii. Community Benefit Department/Team1. X Individual (please specify FTE)a. 2.5 FTE2. X Committee (please list members)9
Civista Medical Center 2012a.b.c.d.e.Director, Community Development and PlanningController/Director of FinanceHealth Promotions SpecialistManager, Budget and ReimbursementAccountant3. x Other (please describe)a. Department Leadership (Identify Community Benefit Reporter for their Departments;Review Departmental Community Benefit information provided)b. Community Benefit Reporters (enters departmental community benefit informationinto database; Attends quarterly reporter meetings)c.Is there an internal audit (i.e., an internal review conducted at the hospital) of the Community Benefitreport?SpreadsheetNarratived.IV.x yesx yesnonoDoes the hospital’s Board review and approve the completed FY Community Benefit report that is submittedto the HSCRC?Spreadsheetx yesnoNarrativex yesnoHospital Community Benefit Program and Initiatives1) See attached Table III for hospital initiatives.Upon completion of the CHNA, the Steering Committee of Partnerships for a Healthier Charles County (PHCC)reviewed the results and the identified top 11 health needs. The Steering Committee set county goals through2014 based on Maryland SHIP objectives and Healthy People 2020 Goals. The goals are now the Charles CountyHealth Improvement Plan (available at 024.pdf)The results were presented to the PHCC membership. Teams were formed to address the health needs anddesign action plans. The Team Action Plans are available ionPlans/tabid/608/Default.aspx.2) All the primary needs outlined in the Needs Assessment are being addressed by Civista either directly (i.e., OBClinic, Physician Recruitment) or through partnerships with other organizations (i.e., Childhood ObesityProgram, Fetal Infant Mortality). Where a need is appropriately addressed by another entity, Civista providesleadership through the Charles County Health Improvement Plan and the coalition of Partnerships for aHealthier Charles County to communicate initiatives, provide assistance when needed and review results (i.e.,Substance Abuse, Mental Health).10
Civista Medical Center 2012V.Physicians1) Physician Gaps: As required under HG§19-303, provide a written description of gaps in the availability ofspecialist providers, including outpatient specialty care, to serve the uninsured cared for by the hospital.In 2007, the Maryland Physician Workforce Study was initiated to document current and future shortages by regionand specialty, to determine the impact on access, to document key physician environment issues and potentialimpact on supply, and to engage physicians and hospitals in the discussion, and to develop a consensus forsolutions. The study will run from 2007-2015. 2007 data will serve as the baseline for the study.County level data is not available for this study; however, data for the Southern Maryland region (Charles, Calvert,and St. Mary’s counties) is presented below.According to the 2007 Maryland Physician workforce study, the Southern Maryland region has a physician shortagefor primary care physicians. Southern Maryland had the regional low requirement for primary care physicians per100,000 residents of 56.5. The Maryland state average rate was 58.2 per 100,000 residents.Under medical specialties, the Southern Maryland region had a shortage for cardiology, dermatology,endocrinology, gastroenterology, hematology, oncology, infectious disease, nephrology, psychiatry, pulmonarymedicine, and rheumatology. The only medical specialties with adequate physician supplies were allergy andneurology. Charles County has one Neurologist which is deemed adequate for the population however, thephysician plans to retire which will leave the county in a critical shortage in this specialty.Under hospital-based physicians, the Southern Maryland region had a shortage for anesthesiology, diagnosticradiology, emergency medicine, pathology, physical medicine, and radiation oncology.Under surgical specialties, the Southern Maryland region had a shortage of general surgery, neurosurgery,obstetrics, gynecology, orthopedic surgery, otolaryngology, plastic surgery, and thoracic and vascular surgery.Southern Maryland also has a borderline physician shortage for ophthalmology surgery and urology surgery.Southern Maryland had the highest percentage of physician shortages than any other regions of Maryland (89.9%).According to the study, Southern Maryland has the smallest portion of resident in training. There is only a handfulin the region. Most of Maryland residents in training are located in the Central Region of the state.When comparing all the Maryland regions, the Southern Maryland region had the lowest rate of primary carephysicians 44.4 physicians per 100,000 residents. This is lower than the Maryland state average of 57 physicians per100,000 residents.11
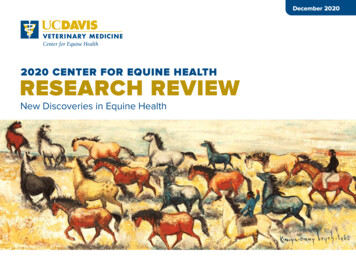
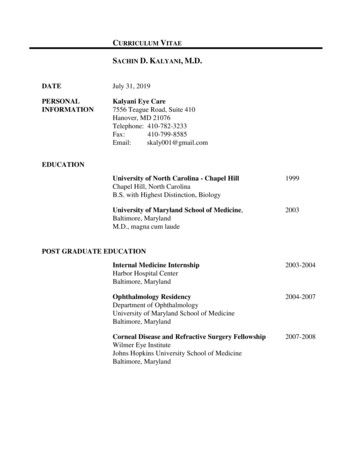
Civista Medical Center 2012The Southern Maryland region also has the lowest rate of medical specialty physicians per 100,000 residents (20per 100,000 residents). This is approximately half the rate of the Maryland state average for medical specialtyphysicians (38 per 100,000 residents). It is anticipated that the supply of medical specialists in the SouthernMaryland region will decrease over the next decade due to retirements and population in-migration into thecounty.Medical Specialty Physicians per 100,000 Residents, 2007-2015 by RegionThe Southern Maryland region also has the lowest rate of hospital specialty physicians per 100,000 residents (16per 100,000 residents). This is more less than half the Maryland state average for hospital specialty physicians (36per 100,000 residents). The Southern Maryland region is expected to have little or no growth from 2010-2015.Hospital Specialist Physicians per 100,000 Residents, 2007-2015 by Region12
Civista Medical Center 2012The Southern Maryland region also has the lowest rate of surgical specialty physicians per 100,000 residents (22 per100,000 residents). This is approximately half the rate of the Maryland state average for hospital surgical specialtyphysicians (37 per 100,000 residents). The Southern Maryland region is expected to experience a decline in supplythrough 2015.2.) If you list Physician Subsidies in your data in category C of the CB Inventory Sheet, please indicate the categoryof subsidy, and explain why the services would not otherwise be available to meet patient demand. Thecategories include: Hospital-based physicians with whom the hospital has an exclusive contract; Non-Residenthouse staff and hospitalists; Coverage of Emergency Department Call; Physician provision of financial13
Civista Medical Center 2012assistance to encourage alignment with the hospital financial assistance policies; and Physician recruitment tomeet community need.Physician Subsidies:As a result of the prevailing physician shortage, Civista Medical Center has an insufficient number of specialists onstaff. Therefore, subsidies are paid to the physicians to provide on call coverage for the Emergency Department andpatient care departments. For FY 2012, subsidies to physicians totaled more than 3.5 million in the followingspecialties:Hospital-based physicians: The following hospital-based physician contracts were required to cover patientcare due to the physician shortage (Southern Maryland is highest in the region) in virtually all primary careand medical specialties. In all of these areas there are not enough physicians to care for patients includinguninsured and underinsured in the hospital. ObstetriciansPediatric HospitalistsAdult HospitalistsAnesthesiologyPathologyCoverage of Emergency Call: The following physician contracts for on-call coverage were necessary to coveremergency room call due to the physician shortage (Southern Maryland is highest in the region) in virtually allprimary care and medical specialties. The entire county is a federally designated mental health professionalshortage area. In the following areas, there are not enough community physicians to cover the emergency call forall patients including the uninsured and underinsured. UrologyGeneral sychiatric ServicesPhysician Recruitment and Loan Guarantees: Southern Maryland had the highest percentage of physician shortages ofall of the regions in Maryland (89.9%). To address the shortage, Civista Medical Center hired both a Chief MedicalOfficer and Physician Recruiter and Liaison who are working to successfully attract and retain private physicians to thecommunity with private practice being the preference and employment if that is not achievable. The recruitmentstrategy plans to increase primary care and specialty providers by at least 7 by 2014. Costs for recruiting and loanguarantees for FY 2012 amount to 275,000. 2 Pediatric Hospitalists2 Obstetrics and Gynecologists1 Orthopedic Surgeon (For MUA)1 Gastroenterologist14
Civista Medical Center 2012Table IIIInitiative 1. ObesityIdentifiedNeedHospitalInitiativePrimary Objective of the InitiativeSingle orMulti-YearInitiativeTimePeriodKey Partnersand/or Hospitalsin ndatesOutcome (Include process and impactmeasures)Continuation ofInitiativeCost ofinitiativeforcurrentFYOver twothirds of CCresidents areeitheroverweightor obese(70.6%)WE CAN!(Ways toEnhanceChildhoodObesityandNutritionWE CAN! Childhood Obesity Program:Free family education program toincrease physical activity, ensure properfood choices and decrease screen timefor 8-13 year olds and their families;Grant is provided to the Charles CountyDepartment of Health through theNational Institutes of Health and subgranted to Civista Health for provisionof the curriculum. This is year 3 of a 3year block grant. Data is collected andevaluated in partnership with theCharles County Department of Health.3 yearsbeginningin 2009Civista MedicalCenter,Session 17/7/117/28/11Served 36 children and their familiesthrough three, four-week sessionstaught by a registered dietitian,licensed professional counselor,exercise psychologist, pediatrician,and registered nurse.The grant cyclehas beencompleted andthere will not befunded for thisinitiative tocontinue beyondfiscal year 2012.Expenses 7,576.GrantmoneyreceivedfromCCDOH 12,182.CC obesityprevalence ishigher thanthe stateaverage(33.2% vs.26.5%).Charles CountyDepartment ofHealth,Charles CountyDepartment ofCommunityServices.Session 29/27/1111/1/111) From pre to post-test, there wasan increase in the number of fruitsconsumed per day. At the pre-test,most of the children were eating 0 - 1pieces fruit each day and by the endof the program, over half were eatingan average of 1 – 2 per day. Thesame can especially be said for thenumber of cups of vegetables eatenper day as some children alsoincreased their vegetableconsumption to three or moreservings per day.2) The pre and post-tests showed avery significant increase in theamount of physical activity that thechildren were engaging in. Theamount doubled for most of them.While sixty minutes or more ofphysical activity per day is therecommended amount,
Life Expectancy The life expectancy for a Charles County resident as calculated for 2009-2011 was 78.4 years. This is similar to the state average life expectancy of 79.2 years. Births There were 1,808 births in Charles County in 2009. Charles County represents 43% of the births in Southern Maryland and 2.4% of the total births in Maryland for .