Transcription
Overview of Goldman SachsFebruary 2021
Cautionary Note on Forward-Looking StatementsThis presentation includes forward-looking statements. These statements are not historical facts, but instead represent only the Firm’sbeliefs regarding future events, many of which, by their nature, are inherently uncertain and outside of the Firm’s control. It is possiblethat the Firm’s actual results and financial condition may differ, possibly materially, from the anticipated results and financial conditionindicated in these forward-looking statements.For a discussion of some of the risks and important factors that could affect the Firm’s future results and financial condition, see “RiskFactors” in our Annual Report on Form 10-K (“Form 10-K”) for the year ended December 31, 2020. You should also read the forwardlooking disclaimers in our Form 10-K for the year ended December 31, 2020, and information on non-GAAP financial measures that isposted on the Investor Relations portion of our website: www.gs.com. See the appendix for more information about non-GAAP financialmeasures in this presentation.The financial and other information provided herein is provided for the periods ended, or the dates, indicated on the relevant slide. Noinformation is provided for a date more recent than February 19, 2021.1
Key Credit StrengthsRegulatoryCapitalRatios andLeverage 4Q20 Common Equity Tier 1 (“CET1”) capital ratios were 14.7% as calculated in accordance with the StandardizedCapital Rules and 13.4% as calculated in accordance with the Advanced Capital Rules Our gross leverage was 12.1x as of 4Q20 We have in place a comprehensive and conservative set of liquidity and funding policies that allows us tomaintain significant flexibility to address both GS-specific and broader industry or market liquidity stress events Our two major liquidity and funding policies are based on the core principles of:Best in ClassLiquidity RiskManagement— Excess liquidity refers to having sufficient cash or highly liquid instruments on hand to meet contractual,contingent and intraday outflows in a stressed environment— Asset-liability management refers to having a liability profile that has sufficient term and diversificationbased upon the liquidity profile of our assets Our average daily liquidity coverage ratio (“LCR”) was 128% for the three months ended December 2020 We hold sufficient excess liquidity in the form of Global Core Liquid Assets (“GCLA”) to cover potential outflowsduring a stressed period— GCLA averaged 283 billion during 2020Global CoreLiquid Assets— GCLA consists of cash, high quality and narrowly defined unencumbered assets, including U.S. Treasuries andGerman, French, Japanese and United Kingdom government obligations In addition, our U.S. bank subsidiary, GS Bank USA, has access to funding through the Federal Reserve Bankdiscount window. While we do not rely on this funding in our liquidity planning and stress testing, we maintainpolicies and procedures necessary to access this funding and test discount window borrowing procedures2
Key Credit Strengths (cont’d) Our principal objective is to fund our balance sheet and run the firm with the ability to weather stressedmarket conditions without dependence on government support Balance sheet is comprised of highly liquid assets and mark to market remains critical to the firm’srisk management processes— 90% of the balance sheet consisted of more liquid assets1 (e.g., cash, reverses/borrows, U.S. government/agencyand other financial instruments) as of 4Q20ConservativeAsset-LiabilityManagement— Businesses subject to conservative balance sheet limits that are reviewed regularly and monitored daily Liability term structure – we seek to have long-dated liabilities to reduce our refinancing risk— Weighted Average Maturity (WAM) of approximately 7 years as of 4Q20 for unsecured long-term borrowings— WAM 120 days for secured funding2 as of 4Q20 (excluding funding that can only be collateralized by liquidgovernment and agency obligations and funding through participation in Federal Reserve facilities) We maintain broad and diversified funding sources globally Counterparties are well distributed throughout the U.S., Europe and Asia The balance sheet stands at 1.16 trillion as of 4Q20, up 4% vs. 4Q07Strong AssetQuality Our asset quality has substantially improved since 4Q07 as our balance sheet reductions targeted less liquid, legacyexposures such as Level 3 assets— Level 3 assets3 are down by more than 50% since 4Q07 to 26 billion and represent 2.3% of our balancesheet as of 4Q20DiversifiedGlobalBusiness withProfitable TrackRecord1 Excludes From 1999-2020, net revenues have grown at a compound annual growth rate of 6% Average ROE from 1999-2020 of 15% Our diversified business model allows us to outperform through cyclesLevel 3, other assets, investments in funds at NAV and certain loans accounted for at amortized cost and held for sale that would have been classified as Level 3 if carried at fair value 2 Comprisedof collateralized financings in the Consolidated Balance Sheets 3 4Q07 Level 3 assets included investments in funds at NAV, 4Q20 excludes these funds3
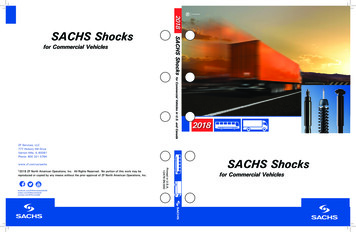
Goldman Sachs’ Credit ProfileCredit Ratings as of February 19, 2021FitchMoody'sS&PShort-term DebtF1P-1A-2Long-term DebtAA2BBB Subordinated DebtBBB Baa2BBB-Preferred Stock1BBB-Ba1BBRatings OutlookNegativeStableStableF1P-1A-1The Goldman Sachs Group, Inc.Goldman Sachs Bank USAShort-term DebtLong-term DebtA A1A Short-term Bank DepositsF1 P-1—Long-term Bank DepositsAA-A1—NegativeStableStableShort-term DebtF1P-1A-1Long-term DebtA A1A Short-term Bank DepositsF1P-1—Long-term Bank DepositsA A1—NegativeStableStableShort-term DebtF1—A-1Long-term DebtA —A Ratings OutlookNegative—StableShort-term DebtF1P-1A-1Long-term DebtA A1A Ratings OutlookNegativeStableStableF1P-1A-1Ratings OutlookGoldman Sachs International BankRatings OutlookGoldman Sachs & Co. LLCGoldman Sachs InternationalGoldman Sachs Bank Europe SEShort-term issuer ratingLong-term issuer ratingAA1A Short-term Bank Deposits—P-1—Long-term Bank Deposits—A1—NegativeStableStableRatings Outlook1Preferred Stock includes Group Inc.’s preferred stock and the Normal Automatic Preferred Enhanced Capital Securities (APEX) issued by Goldman Sachs Capital II and Goldman Sachs Capital III4
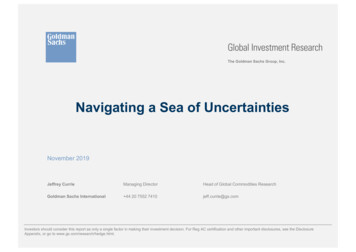
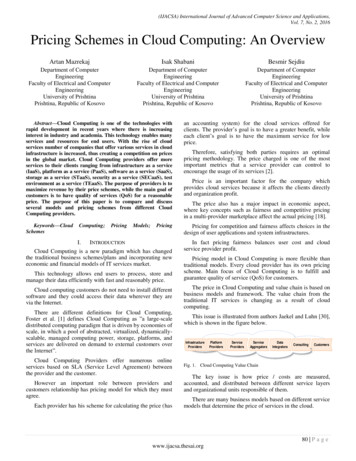
Diversified Net Revenue MixDiversified by BusinessAverage 2018 – 2020Consumer &WealthManagement14%Diversified by GeographyAverage 2018 – ent22%FICC22%Americas61%Equities21%Global Markets43%Our goal is to strengthen our leading, diverse franchise businesses and invest for growth in new businesses5
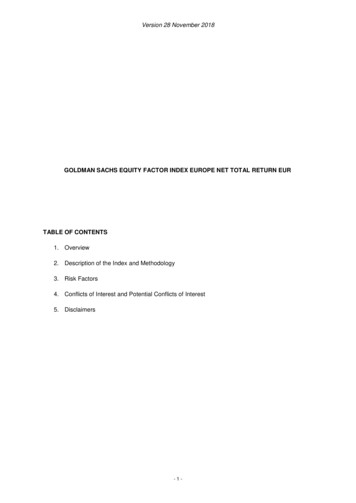
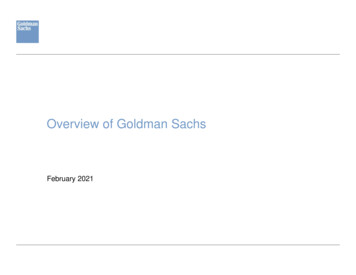
Financial PerformanceNet Earnings ( bn) & ROE (%)1Net Revenues ( bn)1 46.032.7% 45.2 44.6 13.4 39.2 34.4 34.2 36.6 36.5 11.6 34.6 34.1 32.7 30.822.5% 10.5 9.5 28.8 8.4 8.0 8.5 8.5 7.5 22.2 7.413.3% 6.111.5%11.2%10.7% 11.0%9.4% 4.3 4.411.1%10.0%7.4% 2.34.9%4.9%3.7%2007 2008 2009 2010 2011 2012 2013 2014 2015 2016 2017 2018 2019 20202007 2008 2009 2010 2011 2012 2013 2014 2015 2016 2017 2018 2019 2020Net Earnings1ROEIn connection with becoming a bank holding company, the firm was required to change its fiscal year-end from November to December. This change in the firm’s fiscal year-end resulted in a one-month transition period. For theone-month ended December 2008, we reported net revenues of 183 million and a net loss of 780 million6
Our Risk Philosophy Enterprise Risk Management frameworkemploys a comprehensive, integratedapproach to risk managementCorporate Oversight Senior management awareness of natureand amount of risk incurredBoard of Directors Fair value accounting is a critical risk mitigantand is supported by a robust price verificationprocessBoard CommitteesSenior Management OversightChief Executive OfficerPresident/Chief Operating OfficerChief Financial OfficerCommittee OversightDirector ofInternal AuditFirmwide EnterpriseRisk CommitteeManagement CommitteeFirmwide Client andBusiness StandardsCommitteeChief RiskOfficerFirmwide AssetLiabilityCommittee Minimize losses and manage risk through:— Active management— Risk mitigation, where possible usingcollateral— Diversification— Return hurdles matched to underlyingrisks Risk tolerance is governed through the firm’srisk appetite statement— Describes the levels and types of risk weare willing to accept or to avoid Effective risk systems, which are thorough,timely and flexible While we manage risk conservatively, we arein a risk-taking business and will incur losses7
Managing Our Risk4Q07CommonEquity 40bn2.1x 85bnGrossLeverage26.2x-54%12.1xAverageGCLA1 64bn4.4x 283bnLevel 3Assets21 Prior4Q20Down by more than 50% since 4Q07 as of 4Q20to 4Q09, GCLA reflects loan value and subsequent periods reflect fair value; 4Q07 and 4Q20 average GCLA presented on a full-year basisLevel 3 assets included investments in funds at NAV, 4Q20 excludes these funds2 4Q078
Balance SheetOverview As of 4Q20, 90% of the balance sheet was comprised of more liquid assets1 (e.g., cash, reverses/borrows, U.S.government/agency and other financial instruments) Despite strategic efforts to grow lending, loans still represent a small portion of our balance sheet at 10% as of 4Q20 Businesses are subject to conservative balance sheet limits that are reviewed and monitored. In addition, aged inventory limits areset for certain financial instruments4Q20 Balance Sheet by SegmentBalance Sheet Mix Change: 4Q19 to 4Q20 ( bn) 17%Consumer &WealthAsset ManagementInvestment9%ManagementBanking8%10% 993 35 109 64 1,163 37 116 89 394 355 121 75 250 222GlobalMarkets73%1 133 1564Q194Q20Cash and cash equivalentsCustomer and other receivablesInvestmentsOther assetsCollateralized agreementsTrading assetsLoansExcludes Level 3, other assets, investments in funds at NAV, certain loans accounted for at amortized cost and held for sale loans that would have been classified as Level 3 if carried at fair value9
Capital Ratios4Q20 CET1 Capital Ratios4Q20 Risk-Weighted Assets As of Oct. 1, 2020, our Standardized CET1 capital ratiorequirement is 13.6%, reflecting our SCB of 6.6% 610bn14.7% 554bn13.4%21%12%6.6%Stress .5%RegulatoryRequirementin 20204.5%Standardized88%68%StandardizedCredit RWAsAdvancedSupplementary Leverage Ratio2AdvancedMarket RWAsOperational RWAs4Q20 Total Loss-Absorbing Capacity39.8%7.0%5.0% 0TLAC to RWAsTLAC to Leverage ExposureRepresents G-SIB buffer based on 2018 financial data. The buffer in the future may differ due to additional guidance from our regulators and/or positional changes. See our Form 10-K for the period ended December 31, 2020for more information about the G-SIB buffer 2 1Q14 SLR is a non-GAAP measure which reflects our best estimate based on the U.S. federal bank regulatory agencies’ April 2014 proposal. See the appendix for more informationabout this non-GAAP measure. 4Q20 SLR figure includes impact of the temporary amendment to exclude average holdings of US Treasury securities and average deposits at the Federal Reserve as permitted by the FRB,which increased the firm’s SLR by approximately 1.0 percentage points as of 4Q20. This temporary amendment is effective through March 31, 202110
Conservative and Comprehensive Liquidity Risk ManagementExcess LiquidityAsset-Liability Management A primary liquidity principle is to pre-fund ourestimated potential cash and collateral needs Conservative asset and liability managementto ensure stability of financing requirements Our GCLA consists of cash and highly-liquidgovernment and agency securities that wouldbe readily convertible to cash in a matter ofdays Focus on size and composition of assets todetermine appropriate funding strategy GCLA size is based on:— Modeled assessment of the firm’s liquidityrisks, including contractual, behavioral andmarket-driven outflows and intradaydemands— Applicable regulatory requirements Secured and unsecured financing with longtenor relative to the liquidity profile of ourassets in order to withstand a stressedenvironment Consistently manage overall characteristics ofliabilities, including term, diversification andexcess capacity— Qualitative assessment of the conditions ofthe financial markets and the firm— Long-term stress tests, which take a forwardview on our liquidity positions through aprolonged stress periodRigorous and conservative stress tests underpin our liquidity and asset-liability management frameworks11
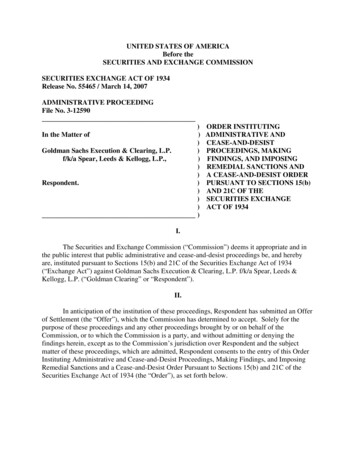
Liquidity UpdateWe are focused on maintaining excess liquidity2020 Average GCLA by Entity GCLA averaged 283 billion during 2020 During 2020, 80% of our average GCLA was made up ofovernight cash deposits (which are mainly at the FederalReserve), U.S. government obligations, and U.S. agencyobligations, with the balance in high quality non-U.S.government obligationsMajor Broker-DealerSubsidiaries35%Group Inc. andFunding IHC15%Major BankSubsidiaries50% Our GCLA is held at Group Inc. and Goldman Sachs FundingLLC (Funding IHC) and each of our major broker-dealer andbank subsidiaries to ensure that liquidity is available to meetentity liquidity requirementsWe regularly refine our liquidity models to reflect changesin market or economic conditions and our business mix Our Modeled Liquidity Outflow reflects potential contractualand contingent outflows of cash or collateral Our Intraday Liquidity Model measures our intraday liquidityneeds Our long-term stress tests take a forward view on our liquiditypositions through a prolonged stress periodAverage Daily Liquidity Coverage Ratio,for the Three Months Ended December 2020Eligible High-QualityLiquid Assets 212.6bn 166.6bn 128%Net Cash Outflows We are required to maintain a minimum LCR of 100%12
Diversification of Funding SourcesAs of 4Q20 Our secured funding1 ( 174bn)book is diversified across:— Counterparties— Tenor— GeographySecuredFundin
4 Goldman Sachs’ Credit Profile Credit Ratings as of February 19, 2021 1 Preferred Stock includes Group Inc.’s preferred stock and the Normal Automatic Preferred Enhanced Capital Securities (APEX) issued by Goldman Sachs Capital II and Goldman Sachs Capital III Fitch Moody's S&P The Goldman Sachs Group, Inc. Short-term Debt F1 P-1 A-2 Long-term Debt A A2 BBB