Transcription
The Economic State of Black America in 2020Over the past half-century, Black Americans have made substantial social and economicprogress, gaining political rights that long had been denied to them, entering professions fromwhich they had been blocked and largely overcoming centuries of overt racism and oppression.While there were only five Black Members of Congress when the Civil Rights Act became lawin 1964, there currently are 56 Black Members of Congress, including 12% of the House ofRepresentatives. Black activists, scholars, and social commentators have raised awareness aboutthe importance of diversity and shaped the national conversation around race and inequality.There has been a proliferation of Black writers, screenwriters, artists, poets, athletes andmusicians who have become superstars in their respective fields. And the 21st century saw theelection of the first Black American, Barack Obama, as president of the United States.Millions of Black Americans also have benefited from the opportunities created by the de jureend of Jim Crow, entering the middle class for the first time, earning undergraduate andadvanced degrees, receiving higher wages, achieving professional success and raising childrenwho will build on their achievements. Leading indicators of economic prosperity and othermeasures of well-being also have trended upward for most of this period, with increased lifeexpectancy, increased household incomes and substantial gains in educational attainment.However, these very visible signs of improvement mask deep inequities that relegate tens ofmillions of Black Americans to second-class status, with far fewer opportunities to achieve goodhealth, political influence, prosperity and security than other Americans. The majority ofAmericans fail to recognize the magnitude of these problems. For example, a 2019 study foundthat over 97% of respondents vastly underestimated the huge gap between the median wealthheld by Black families ( 17,000) and White families ( 171,000)—a ratio of 10 to one.Respondents estimated the gap to be 80 percentage points smaller than the actual divide.The data reveal a much different story, with leading indicators of social and economic well-beingshowing that, on average, Black Americans face much more difficult circumstances than theirWhite counterparts. For example, Black Americans take home less income, are far less likely toown their homes and live shorter lives than White Americans.Evaluating the economic state of Black America requires acknowledging that while the UnitedStates has made some progress, very large disparities continue to exist. Recognizing both theprogress and the challenges is essential to ensuring that all Americans, including BlackAmericans, have a realistic chance to achieve success.
The Economic State of Black America in 2020KEY POINTS Despite significant economic progress over the past decades, Black Americansexperience far worse economic conditions than Whites or the population as a whole. Historically, the unemployment rate for Black Americans has been approximatelytwice the rate for Whites. That is the case today—6.0% for Black workers and 3.1%for Whites. The difference in the unemployment rates for Blacks and Whites shrinks for collegegraduates; however, even in the current strong economy the unemployment rate is50% higher for Black Americans. During the majority of the past 50 years, Black Americans have experiencedunemployment rates that, were they experienced by the entire population, would beseen as recessionary. Black workers have been disproportionally hurt by the overall decline in unionmembership and the decreasing power of unions. The typical Black households earns a fraction of White households—just 59 cents forevery dollar. The gap between Black and White annual household incomes is about 29,000 per year. Black Americans are over twice as likely to live in poverty as White Americans. Black children are three times as likely to live in poverty as White children. The median wealth of Black families ( 17,000)—is less than one-tenth that of Whitefamilies ( 171,000). The wealth gap between Black and White households increases with education. Much less than half (42%) of Black families own their homes, compared to almostthree-quarters (73%) of White families. High school graduation rates for Black and White Americans have nearly converged. The share of Blacks who are college graduates has more than doubled since 1990,from 11% to 25%—but still lags far behind Whites. Persistent segregation leads to large disparities in the quality of secondary education,leading to worse economic outcomes. The incarceration rate for Black Americans is falling, but is still nearly six times therate for White Americans. Non-Hispanic Black Americans have a life expectancy 3.6 years lower than nonHispanic White Americans.Page 2
The Economic State of Black America in 2020TABLE OF CONTENTSEMPLOYMENT . 5The unemployment rate for Black Americans is much higher than for Whites . 5Racial disparities in unemployment rates exist at every education level. 5A smaller share of Black Americans are in the labor force . 6Discrimination and occupational segregation are significant causes of racial disparities . 6UNIONIZATION . 7Black workers are more likely to be members of labor unions . 7Union membership reduces wage differentials between Blacks and Whites . 7Falling union membership rates are particularly harmful to Black workers . 7WAGES AND INCOME . 8Black households earn a fraction of what White households earn . 8Black workers are more likely to earn the minimum wage . 9College-educated Black workers fare worse in comparison to White workers . 10Black women are doubly disadvantaged. 10POVERTY AND ECONOMIC MOBILITY. 11Black Americans are over twice as likely to live in poverty as White Americans . 11High poverty rates among Black Americans have lifelong consequences . 12Black Americans experience far less upward economic mobility . 12Black Americans depend more on the social safety net . 12WEALTH . 12The median wealth of Black families is only one-tenth that of White families . 12A college education does not decrease the wealth gap . 13Historical disparities perpetuate the Black-White wealth gap . 13Many Black college graduates have difficulty paying off student loan debt . 14Black Americans approaching retirement have far less savings . 14HOMEOWNERSHIP . 14Black Americans are far less likely to own their own homes than White Americans . 14Homes in majority-Black neighborhoods are valued lower . 15Black Americans overall pay higher mortgage interest rates . 15Page 3
The Economic State of Black America in 2020Black homeownership rates are trending downward . 15EDUCATION . 16High school graduation and dropout shares for Blacks and Whites have nearly converged . 16The share of Black college graduates has doubled—but still lags far behind whites . 17Racial segregation leads to large educational disparities . 17Concentrated poverty leads to weak student performance . 18A lack of teacher diversity worsens outcomes . 18Nonwhite school districts as a whole are more poorly funded . 18INCARCERATION . 19One in three Black men will be incarcerated over his lifetime . 19The incarceration rate for Black Americans is falling, but is nearly six times the rate for WhiteAmericans . 20VOTING RIGHTS . 21Black voter turnout decreased in 2016. 21Decreased voter turnout is partly a result of voter suppression . 21HEALTH. 22Black Americans have a significantly lower life expectancy than Whites . 22Blacks have a lower life expectancy despite White “deaths of despair” . 23Black Americans suffer far higher rates of infant and pregnancy-related mortality . 23Discrimination may contribute to worse health outcomes . 24Health insurance rates for Blacks rose under Obama, then have fallen under Trump . 25CONCLUSION . 27STATE CHART. 28ENDNOTES . 29Page 4
The Economic State of Black America in 2020EMPLOYMENTThe unemployment rate for Black Americans is much higher than for WhitesThe U.S. economy provides Black Americans with far fewer opportunities for stable, wellpaying employment than their White counterparts. Over the past 50 years, the unemploymentrate for Blacks consistently has been approximately twice that of Whites. Although PresidentTrump in his recent State of the Union Address heralded the fact the Black unemployment ratehad dropped to 6% in January 2020, it still is almost twice the White unemployment rate of3.1%.1The spread between White and Black unemployment increases when overall unemployment risesand decreases when it falls. In 1983, when Federal Reserve Chair Paul Volcker pushed throughvery large increases in interest rates to combat inflation, Black unemployment skyrocketed to21.2%, more than twice White unemployment.Often, even in a strong economy, the labor market for Black Americans is what WhiteAmericans experience during a recession. In general, African Americans benefit when theeconomy improves, but when it sputters, they are the first to be fired. For this reason, policiesthat help support a strong economy close to full employment are particularly beneficial for BlackAmericans and help reduce racial disparities.2Racial disparities in unemployment rates exist at every education levelThe largest gaps in unemployment exist between Black and White workers without a collegeeducation. The average unemployment rate in 2019 for Black workers with just a high schooleducation was 8.5%, more than twice the 3.9% rate for similarly educated White workers.Page 5
The Economic State of Black America in 2020Unemployment rates for both Blacks and Whites with at least a bachelor’s degree were muchlower, two percent for Whites and three percent for Blacks—50% higher.A smaller share of Black Americans are in the labor forceThe current economic expansion, which began in 2009 under President Obama and is the longeston record, has helped increase the share of Black Americans in the labor force. As the labormarket has tightened over the past several years, the difference between labor force participationrates for Blacks (62.6%) and Whites (63.4%) has almost disappeared. This undermines thepersistent stereotype that Blacks are less inclined to seek work than Whites, suggesting insteadthat they have fewer opportunities to seek employment when the economy is not operating at itspeak.Black women and men have traditionally had labor force participation rates that are much similarthan those of White women and men, reflecting a more gender-equitable division of labor bothwithin and outside the home.3 This in part may be due to difficult labor market conditions anddiscrimination against Black men, which makes Black women’s participation critical to theirfamilies.4 The labor force participation rates of Black women and men were 63.3% and 67.6% inJanuary 2020, compared to 58.3% and 72% for White women and men.Discrimination and occupational segregation are significant causes of racial disparitiesField experiments have shown that resumes with typically “Black sounding” names receivedsignificantly fewer callbacks for job interviews than those with “White sounding” names, evenPage 6
The Economic State of Black America in 2020when candidates had identical qualifications.5 A meta-analysis of these experiments has shownalmost no change in the level of hiring discrimination among Blacks over the past 25 years.6There also is evidence of Black employment being concentrated in occupations that have ahigher risk of unemployment, often because of automation.7 Black workers also are at higher riskof being the first fired in the event of an economic downturn.8UNIONIZATIONBlack workers are more likely to be members of labor unionsLabor unions have played a key role in helping Black workers secure higher wages, morecomprehensive benefits and better working conditions, offering millions of Blacks a pathway tojoining the American middle class. Black workers have higher rates of union membership thanWhite workers, with membership rates of 11.2% compared to 10.3% for White workers.9Union membership reduces wage differentials between Blacks and WhitesUnionization has narrowed the wage disparity between Blacks and Whites, but has noteliminated it. In 2019, unionized Black men earned 948 per week compared to 1,181 forunionized White men, a relative pay gap of 80 cents to the dollar. Non-unionized Black menearned 746 compared to 1,012 for non-unionized White men, or 74 cents to the dollar.Unionization made virtually no difference in the wage gap between Black and White women;unionized Black women earned 874 to unionized White women’s 1,044 (84 cents to thedollar), while non-unionized Black women earned 683 to non-unionized White women’s 810(84 cents).10 Given the reduced racial earnings gaps between unionized men and that a largershare of Black workers overall is unionized, earnings gaps between Black and White workerslikely would be larger without unions.11In addition to helping secure better wages and working conditions for Black Americans, unionsalso played a key role in the Civil Rights movement, improving the lives and economic fates ofall Black Americans. Civil Rights leaders, in turn, championed organized labor. A. PhillipRandolph founded the Brotherhood of Sleeping Car Porters, the first Black labor organizationchartered by the American Federation of Labor (AFL), and went on to become one of thearchitects of the Civil Rights Movement.12 Martin Luther King, Jr. was an outspoken advocatefor the labor movement and created the Poor People’s Campaign, a multiracial working-classmovement dedicated to economic equality and social justice, with strong ties to organizedlabor.13Falling union membership rates are particularly harmful to Black workersUnion membership as a share of employment has been declining steeply for all Americans sincethe 1980s, declining by nearly half overall from 20.1% in 1983 to 10.3% in 2019. The decline forBlacks has been the steepest, from 27.2% in 1983 to 11.2% in 2019.14Page 7
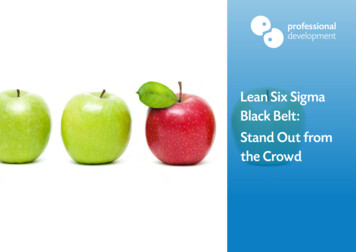
The Economic State of Black America in 2020In recent years, the most significant drops have been among Black Americans, whose unionmembership fell from 12.5% to 11.2% from 2018 to 2019. In comparison, White unionmembership remained relatively unchanged (from 10.4% in 2018 to 10.3% in 2019). Thepassage of “right-to-work” laws in states across the country, President Trump’s executive ordersrestricting union activities and recent Supreme Court decisions that jeopardize collectivebargaining, likely will cause this decline to continue.WAGES AND INCOMEBlack households earn a fraction of what White households earnThe median annual household income for Black households in 2018 (the last year for whichhousehold data are available) was 41,692, more than 21,000 less than all households andnearly 29,000 less than for White households, which had a median income of 70,642. In otherwords, for every dollar earned by the typical White household, the typical Black householdPage 8
The Economic State of Black America in 2020Black Families Earn Far Less than White Families and All FamiliesNationwideMedian Household Income, Adjusted to 2018 Dollars, 1980-2018 80,000Non-Hispanic White 70,000 70,642 63,179 60,000All Races 50,000 41,692 40,000Black 30,000 20,000 10,000 -1980198419881992199620002004200820122016Source: U.S. Census Bureau, "Income and Poverty in the United States: 2018," Table A-2.Note: Income in 2018 CPI-U-RS adjusted dollars. Households as of March of the following year. "Black" refers to Black Alone or in Combination (2002-2018)/Black (1980-2001)."Non-Hispanic White" refers to White Alone, Not Hispanic (2002-2018)/White, Not Hispanic (1980-2001).earned only 59 cents. This is significantly worse than in 2000, when the typical Black householdearned about 65 cents for every dollar earned by a White household. 15Between 2000 and 2018, wage growth for White and Hispanic workers was faster at every decileof income than for Black workers; as a result, the gap in hourly wages between Black and Whiteworkers is larger now at every decile of income than in 2000.16 The past 40 years have seenrising wage inequality and stagnating wage growth in the United States; this trend has coincidedwith increasing racial disparities in wages and wage growth. Wages have grown fastest for thoseat the top of the income distribution, including for high-earning Black workers. However,because Black workers make up a disproportionate share of the bottom of the incomedistribution, slow wage gains at the bottom have hit the Black community hardest.Black workers are more likely to earn the minimum wageBlack workers are significantly more likely to work at or below the minimum wage than Whiteworkers; 2.4% of Black workers worked at or below the federal minimum wage of 7.25 in 2019compared to 1.9% of White workers. In 2018, Black workers made up 18% of minimum wageworkers despite being only 12.7% of the population.17Black Americans would especially benefit from increases in the minimum wage. Research showsthat this not only would raise wages for workers who receive the minimum wage, but thoseearning more than the minimum wage.18 As a result, 38% of Black workers would benefit from aproposal to raise the minimum wage to 15 by 2024, compared to 23.2% of White workers.19Page 9
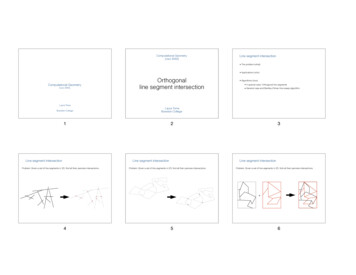
The Economic State of Black America in 2020College-educated Black workers fare worse in comparison to White workersIronically, college-educated Black workers face a larger absolute income gap relative to Whitesthan those without a college education. While Black workers with less than a high schooleducation earned 3,500 less than similarly educated White workers in 2018, Black workers witha bachelor’s degree and above earned 11,000 less than their White counterparts.College-educated Black workers are also at a higher risk than their White counterparts of beingunderemployed—working in occupations that do not make use of their education andconsequently pay less. Almost 40% (39.4) of Black college graduates are underemployedcompared to 31% of White graduates. 20Racial Pay Gaps Are Widest for Employees with CollegeDegreesMedian Total Personal Income by Race, 2018 70,000 60,000Non-Hispanic White 60,000Black 49,000 50,000 40,000 27,000 30,000 20,000 10,000 34,800 30,000 20,000 15,000 11,459 0Less than HighSchoolHigh SchoolSome CollegeCollege Source: JEC Democratic Staff Calculations, Current Population Survey, ASEC 2019.Note: "Some College" includes associate degrees, "College " refers to bachelor's degrees and more. "Black"refers to Black Alone or in Combination. "Non-Hispanic White" refers to White Alone, Not Hispanic.Black women are doubly disadvantagedBlack women face a double-penalty in income, earning less due to both racial and genderdisparities. This income penalty can be traced in part to discrimination and occupationalsegregation. Black women earned 68 cents for every dollar earned by White men in 2019,improving from 65 cents in 2018. 21 This gender-racial gap in earnings between Black womenand White men translates to a lifetime earnings difference of over 900,000 (assuming a 40-yearcareer).22Reductions in occupational segregation began to slow significantly in the 1980s, and there hasbeen little to no progress in reducing occupational segregation since in the 21st century.23Between 2000 and 2016, the share of Black women who would have to change occupations inPage 10
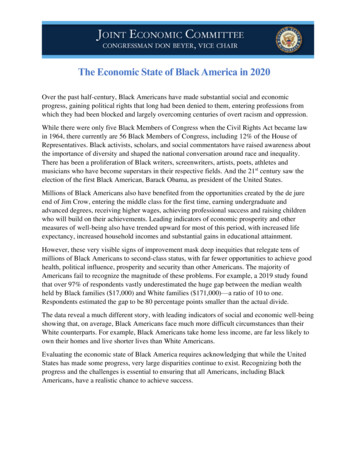
The Economic State of Black America in 2020order to eliminate occupational segregation between Black women and White men fell only threepercentage points, from 59% to 56%.24POVERTY AND ECONOMIC MOBILITYBlack Americans are over twice as likely to live in poverty as White AmericansIn 2018, almost one-in-12 (8.1%) non-Hispanic White Americans lived under the poverty line.More than two and a half times that percentage of Black Americans (20.8%) lived in poverty.The share of Black Americans living below the poverty line has not fallen below 20%, nor hasthe share of White Americans living below the poverty line risen above 11% since at least1959.25Black workers generally are more likely to work at what are known as “poverty-level wages”—at which one person working full time, year-round, would still earn less than the federal povertyline for their family size. In 2017, 14.3% of Black workers earned poverty-level wages,compared to just 8.6% of White workers.26Black Americans also face high rates of child poverty in America, with under-18 poverty ratesclose to or exceeding 30% dating back to 1974. The poverty rate for Black children regularlytriples the rate for White children.27Black Child Poverty Rates Are Regularly Triple WhiteRatesPoverty Rate Under 18 Years, 1974-201850%40%Black30%20%White10%0%1974 1978 1982 1986 1990 1994 1998 2002 2006 2010 2014 2018Source: U.S. Census Bureau, Historical Poverty Tables: Table 3. "Poverty Status of People by Age, Race,and Hispanic Origin."Note: "Black" refers to Black Alone (2002-2018)/Black (1974-2001). "White" refers to White Alone, NotHispanic (2002-2018)/White, Not Hispanic (1974-2001).Page 11
The Economic State of Black America in 2020High poverty rates among Black Americans have lifelong consequencesThe consequences of high poverty rates are felt throughout the life cycle for Black Americans.Poverty has well-documented adverse effects on children’s educational outcomes and limitsyoung adults’ ability to pursue post-secondary education.28 Those born to families at or belowthe poverty line are more than twice as likely to be in poor health as adults as those born intofamilies with income more than twice the poverty line.29Black Americans experience far less upward economic mobilityBlack Americans face more limited upward economic mobility than White Americans and face ahigher risk of downward mobility, even when not born into poverty. Black children born intofamilies in the bottom income quintile are twice as likely as poor White children to stay in thebottom income quintile as adults. The wealthiest Black children are nearly just as likely toremain in the top income quintile as they are to fall to the bottom as adults, whereas it is rare forrich White children to become impoverished as adults.30Black Americans depend more on the social safety netSafety net programs like SNAP, unemployment insurance, Medicare, Medicaid and SocialSecurity have wide-ranging benefits for demographic groups throughout the economy. They alsohelp to stabilize the economy in the event of an economic downturn by sustaining spending whenthe economy weakens. 31 Safety net programs disproportionately benefit Black Americansbecause a larger share lives close to or below the poverty line.WEALTHThe median wealth of Black families is only one-tenth that of White familiesThe median net worth of White families is 171,000, nearly 10 times the median net worth ofBlack families, which was only 17,150 in 2016. The median Black net worth is less than oneyear’s subsistence at the federal poverty level for a family of three.32White Families Own Nearly Ten Times the Wealth of Black FamiliesMedian Family Net Worth, 2016 180,000 171,000 160,000 140,000 120,000 100,000 80,000 97,290 60,000 40,000 20,000 17,150 All RacesWhite, Not HispanicSource: JEC Democratic Staff Calculations, Federal Reserve Survey of Consumer Finances, 2016.Page 12Black
The Economic State of Black America in 2020Among households with wealth, Black median household wealth hovered between 5% and 17%of the level of White household wealth between 1989 and 2016. Black households have neverheld more than 5% of the nation’s total wealth, while White households held 85% in 2019,despite Blacks making up around 13% of the population.33 A 2016 study found that Americansunderestimated the size of the Black-White wealth gap by 80 percentage points.34If these trends persist, White median household wealth will increase while Black and Hispanichousehold wealth continues to fall. At the current pace of decline, median household wealthcould reach zero by 2053 for Black households and by 2073 for Hispanic households.35A college education does not decrease the wealth gapRacial wealth disparities are larger for more highly educated Blacks and Whites than for thosewith less education. While the Black-White gap in wealth was 51,000 for those with less than ahigh school education in 2016, for those with a bachelor’s degree or higher, the gap was overRacial Wealth Disparities Increase with EducationMedian Household Net Worth by Race, 2016 450,000 399,000 400,000 350,000BlackWhite Non-Hispanic 300,000 250,000 200,000 150,000 100,000 50,000 102,850 103,430 68,200 62,000 11,000 10,910 13,810 0Less than HighSchoolHigh SchoolSome CollegeCollege Source: 2016 Survey of Consumer Finances.Note: "Some College" includes those with associates degrees; "College " refers to bachelor's degrees andmore. 300,000. The median net worth of college-educated Black families was 68,200, while forWhite families it was 399,000.Historical disparities perpetuate the Black-White wealth gapIntergenerational wealth transfers are a determining factor in the distribution of wealth in theUnited States and of the racial wealth gap in particular.36 Throughout history, Black Americanshave been excluded from programs that allowed a White middle class to emerge and buildPage 13
The Economic State of Black America in 2020wealth, and the wealth Blacks were able to build despite these hurdles was often destroyedthrough acts of domestic terrorism (e.g. Wilmington, NC in 1898, Tulsa, OK in 1921 andcountless other smaller lynchings throughout the 19th and 20th centuries).37 Institutional practiceslike redlining, the undervaluation of homes in majority-Black neighborhoods and predatorylending continue to exacerbate racial wealth disparities. The failure to fully address theseinequities further sustains the wealth gap from generation to generation.Many Black college graduates have difficulty paying off student loan debtTwenty years after starting college, the typical Black borrower still owes 95% of his or heroriginal balance, while the typical White borrower owes only 6%. 38 This student debt burdencontributes to the difficulty Black adults have in building wealth, preparing for retirement andpassing wealth to the next generation.Black Americans approaching retirement have far less savingsRacial disparities in wealth and income continue across lifetimes and lead to disparities inretirement readiness. There are significant gaps in retirement account savings across both raceand gender, with Black men and women ages 55-64 each only holding 30,000 in savingscompared to White men’s 101,000 and White women’s 60,000. 3
discrimination against Black men, which makes Black women's participation critical to their families. 4 The labor force participation rates of Black women and men were 63.3% and 67.6% in January 2020, compared to 58.3% and 72% for White women and men.