Transcription
Key factsabouthigher educationin WashingtonFebruary 2007
Key factsabouthigher educationin WashingtonFebruary 2007
917 Lakeridge Way SWPO Box 43430Olympia, WA 98504-3430360.753.7800www.hecb.wa.govBill Grinstein, chairSeattleCharley BinghamFox IslandEthelda BurkeTacomaGene ColinSeattleRoberta GreeneSpokaneEarl HaleLaceyJesus HernandezWenatcheeBetti SheldonSilverdaleJonathan SprouffskeRainierSam SmithSeattleAnn DaleyExecutive DirectorThis publication is available on the HECB Web site at:www.hecb.wa.gov/reportsCover photo: Student Services Center, Peninsula College,by Dennis Sanford
Table of contentsIntroduction . iPart 1: Colleges and enrollments . 1Types of institutions . 2Headcount enrollment . 4Public four-year schools . 5Public two-year schools. 6Independent four-year schools. 7Actual average annual FTEs: state supported. 9Branch campus enrollments. 12Enrollment projections . 14Part 2: Students, faculty, staff. 17Student age distribution . 18Student gender distribution. 19Student race/ethnicity . 20Faculty and staff . 22Faculty salaries . 23Part-time faculty . 27Faculty race/ethnicity . 28Faculty gender distribution. 29Part 3: Readiness, participation in college, transfers, achievement. 31WASL performance. 32Running Start, Advanced Placement, International Baccalaureate,College in the High School, Tech Prep . 33SAT, ACT test comparisons. 36Remediation. 38Participation in college . 39Student transfer. 41Achievement. 44Graduation rates. 45Degree and certificate completion . 46Part 4: Higher education finances. 53Cost of instruction . 54Tuition and fees . 55Comparing tuition in other states. 61Student price. 64State operating budget . 65State capital budget. 69Part 5: Financial aid. 75Need-based financial aid . 76Expected family contribution . 77Financial aid recipients. 79Financial aid programs . 80Guaranteed Education Tuition (GET) Program. 86GEAR UP Program . 88Glossary. 89
IntroductionThis publication, “Key facts about higher educationin Washington,” brings together much of theinformation one might need to understand anddiscuss higher education issues.While this publication does not attempt to answer everyquestion that may come up in discussions about highereducation, it highlights the most often-asked questionsabout institutions, faculty, students, costs, budgets,financial aid, and other topics.First published in 2002, “Key facts about higher educationin Washington” is updated annually by the HigherEducation Coordinating Board (HECB). Additionalinformation about higher education is available throughthe agency’s Web site: www.hecb.wa.gov.Other Web sites contain useful information on differentaspects of higher education and many of these sites arelisted throughout the booklet as resources.HECB responsibilitiesThe Higher Education Coordinating Board is a 10-membercitizen board that administers the state’s student financialaid programs and provides planning, coordination,monitoring, and policy analysis for higher education inWashington.The board is charged by law with representing the “broadpublic interest above the interests of the individual collegesand universities.”Created by the Legislature in 1985, the HECB wasformally established in January 1986 as the successor tothe Council for Postsecondary Education. Boardmembers are appointed by the governor and confirmedby the state Senate. They serve four-year terms, with theexception of the student member, who serves one year.In January 2006, the members of the board beganselecting one of their colleagues as the chair. Theagency’s executive director serves at the pleasure of theboard.i
Major functions of the board include: Administering state financial aid programs Preparing a strategic plan for higher education Recommending budget priorities and policychanges Approving degree programs Ensuring program quality Establishing minimum freshman admissionrequirements at public four-year colleges anduniversities Helping families save for college Motivating young people to go to collegeii
Part 1Colleges and enrollments1
Colleges andenrollmentsWho is providinghigher educationin Washington?Public four-yearinstitutions: researchcomprehensivePublic communityand technicalcollegesIndependentinstitutionsWashington has a variety of schools that provideeducation beyond the high school level. Thehighest number of enrollments occurs at the publiccolleges and universities, while the independent sectorcontributes significantly.For specific information about a particular institution, theHECB Web site (www.hecb.wa.gov) has links to manyinstitutions listed here.Public four-year colleges and universitiesWashington hosts six public baccalaureate institutions,each of which is governed by a board of regents or trusteesappointed by the governor and approved by the Senate. Inaddition to the main campus location, many have branchcampuses or centers in other parts of the state.Four-year institutions are divided into two types: researchand comprehensive. The research universities offerbaccalaureate through professional degree programs.Comprehensive institutions offer baccalaureate andmaster’s level programs.Research institutions University of Washington .SeattleBranch campuses:University of Washington BothellUniversity of Washington Tacoma Washington State University .PullmanBranch campuses:Washington State University Spokane*Washington State University Tri-CitiesWashington State University VancouverComprehensive institutions Central Washington University.Ellensburg Eastern Washington University .Cheney The Evergreen State College .Olympia Western Washington University .Bellingham*In 2004, the Legislature removed the “branch”designation for Washington State University Spokane.2
Colleges andenrollmentsCommunity and technical colleges(public two-year)Washington has 34 public community and technicalcolleges that grant certificates and associate degrees. Inaddition, in July 2006, the HECB approved pilotbaccalaureate programs at four community colleges.The two-year schools are governed by boards of trusteesappointed by the governor and approved by the Senate.Associate degrees usually require two years of full-timecoursework. Students enroll in community and technicalcolleges for various purposes, including academicprograms, workforce training, basic skills, andhome/family life enrichment.Washington also is home to a federally-funded publicinstitution – Northwest Indian College, near Bellingham.Independent four-year schoolsThe term “independent” is used in this document to denoteinstitutions primarily supported by non-public fundingsources. Some independent schools have a religiousaffiliation, while others do not. Both private nonprofitinstitutions and private for-profit institutions are included.Data for 34 independent four-year institutions are reportedusing information gathered through the annual federalsurvey conducted by the U.S. Department of Education’sNational Center for Education Statistics – the IntegratedPostsecondary Education Data System (IPEDS).In addition to these 34 institutions, there are several otherfour-year colleges and universities based in other statesauthorized to offer coursework in Washington under theDegree-Granting Institutions Act. However, the 34institutions reflected in this document include the vastmajority of independent four-year enrollments inWashington.Other independent schoolsA number of private career institutions offer courseworkand programs – in many cases focused on workforcedevelopment and job training. Cosmetology and computergraphics are two examples, but there are many others. Someof these institutions, though not all, grant associate degreesand/or certificates. Data on these independent schools arenot included in this document. (One source of informationon these institutions is the Workforce Training and EducationCoordinating Board: www.wtb.wa.gov.)3
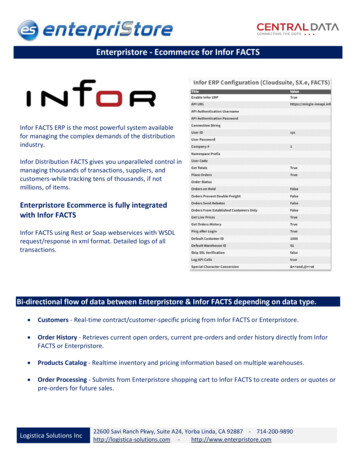
Colleges andenrollmentsPublic four-yearPublic two-yearcommunity andtechnical collegesIndependentfour-yearEnrollments in the public institutions, both four-yearand community and technical colleges, includeenrollments for all funding sources. Most enrollmentsat public institutions are supported, at least in part, by statefunds appropriated by the Legislature. However, someenrollments are funded through outside sources (such ascontracts) or students themselves pay the entire cost ofinstruction.Fall 2005 headcount showsthe largest enrollments atcommunity and technical collegesIndependentfour-year50,950Public communityand technicalcolleges251,75966,518Public researchinstitutions:UW, WSU39,815Publiccomprehensiveinstitutions:CWU, EWU,TESC, WWUSources: State Board for Community and Technical Colleges(SBCTC) and Integrated Postsecondary Education Data System(U.S. Department of Education) for public and independent four-yearinstitutions.Notes: Public data include both state and non-state fundedenrollments. Not shown are enrollments in independent less-than-fouryear institutions.4
Colleges andenrollmentsPublic four-yearFall 2005enrollment(headcount)Enrollments reflect all funding sources:PrimarylocationUniversity of WashingtonSeattle39,251University of Washington BothellBothell1,534University of Washington TacomaTacoma2,189Washington State UniversityPullman/SpokaneWashington State University VancouverVancouver1,975Washington State University Tri-CitiesTri-Cities1,164Central Washington UniversityEllensburg10,190Eastern Washington UniversityCheney10,908The Evergreen State CollegeOlympia4,470Western Washington UniversityBellinghamTotal: Public four-year20,40514,247106,333Source: Integrated Postsecondary Education Data System (U.S. Department of Education), fall 2005.Notes: Enrollments reflect both state-supported and non-state-supported students. Data areestimated for Washington State University by campus. In 2004, the Legislature removed the “branch”designation for Washington State University Spokane.5
Colleges andenrollmentsPublic two-year community and technical colleges29 community colleges, 5 technical collegesPrimaryLocationEnrollments reflect all funding sources:Bates Technical CollegeBellevue Community CollegeBellingham Technical CollegeBig Bend Community CollegeCascadia Community CollegeCentralia CollegeClark CollegeClover Park Technical CollegeColumbia Basin CollegeEdmonds Community CollegeEverett Community CollegeGrays Harbor CollegeGreen River Community CollegeHighline Community CollegeLake Washington Technical CollegeLower Columbia CollegeOlympic CollegePeninsula CollegePierce District:Pierce College PuyallupPierce College Fort SteilacoomRenton Technical CollegeSeattle District:Seattle Central Community CollegeNorth Seattle Community CollegeSouth Seattle Community CollegeShoreline Community CollegeSkagit Valley Community CollegeSouth Puget Sound Community CollegeSpokane District:Spokane Community CollegeSpokane Falls Community CollegeTacoma Community CollegeWalla Walla Community CollegeWenatchee Valley CollegeWhatcom Community CollegeYakima Valley Community CollegeTacomaBellevueBellinghamMoses erettAberdeenAuburnDes MoinesKirklandLongviewBremertonPort PuyallupFort leShorelineMount SpokaneTacomaWalla WallaWenatcheeBellinghamYakimaTotal: Community and technical collegesFall 26,1505,811251,759Source: State Board for Community and Technical Colleges, Enrollment and Staffing Report, fall 2005.Notes: Enrollments reflect both state-supported and non-state-supported students. Seattle Vocational Institute’senrollments are included in the Seattle Central Community College total.6
Colleges andenrollmentsIndependent four-yearPrimarylocationAntioch UniversityArgosy UniversityArt Institute of SeattleBastyr UniversityCity UniversityCornish College of the ArtsCrown CollegeDevry UniversityDigipen Institute of TechnologyFaith Evangelical Lutheran SeminaryGonzaga UniversityHenry Cogswell CollegeHeritage CollegeInternational Academy of Design and TechnologyITT Technical InstituteITT Technical InstituteITT Technical InstituteMars Hill Graduate SchoolNorthwest Baptist SeminaryNorthwest College of ArtNorthwest UniversityPacific Lutheran UniversityPuget Sound Christian CollegeSaint Martin’s UniversitySeattle Institute of Oriental MedicineSeattle Pacific UniversitySeattle UniversityTrinity Lutheran CollegeUniversity of PhoenixUniversity of PhoenixUniversity of Puget SoundWalla Walla CollegeWhitman CollegeWhitworth CollegeTotal: Independent four-yearFall oreSeattleSeattleTacomaFederal pokaneTacomaCollege PlaceWalla ource: Integrated Postsecondary Education Data System (U.S. Department of Education).7
EnrollmentsWhat is thelevel ofstate-supportedfull-timeequivalent (FTE)enrollmentsin publicinstitutions?Fall headcount data cover all students who attendhigher education institutions in Washington –whether they are enrolled in a one-credit course orattend full time. For public colleges and universities, theheadcount enrollment numbers include both enrollmentssupported by state funds as well as enrollmentssupported by other sources, such as contracts withoutside agencies. However, state funding supports alarge proportion of enrollments at public institutions.For budget purposes, the Legislature funds enrollmentsbased on the number of full-time equivalent (FTE)students. FTE enrollments are calculated on total credithours rather than numbers of individuals (heads). Onefull-time equivalent enrollment is equal to 15 credithours for an undergraduate student and 10 credit hoursfor a graduate student. Therefore, because manystudents enroll on a part-time basis, the number ofcalculated FTEs is usually less than the number based onheadcount.Furthermore, FTE enrollments are often calculated as anaverage for the entire year. The Legislature budgets FTEenrollments and, at the end of the year, actual FTEenrollments are calculated. Actual FTEs usually varyslightly from the “budgeted” FTE enrollments.8
EnrollmentsActual average annual FTEs: state-supportedpublic four-year institutions and community and technical colleges(centers and off-campus enrollments included with each 2-032003-042004-052005-06Research institutionsUW Main ,38333,155UW Bothell7998449591,0411,2281,2361,2501,3441,200UW 2UW totalWSU Main ,95417,985WSU Spokane2883834325265676286271,1921,282WSU Tri-Cities647591596639631627677672691WSU 25WSU totalComprehensive 0511,71311,755Four-year 35891,571Community andtechnical 138,241131,489130,933Public ,316222,847222,504Sources: Office of Financial Management, Higher Education Enrollment Statistics, and budget driverreports (as of August 2006).Note: In 2004, the Legislature removed the “branch” designation for Washington State UniversitySpokane.9
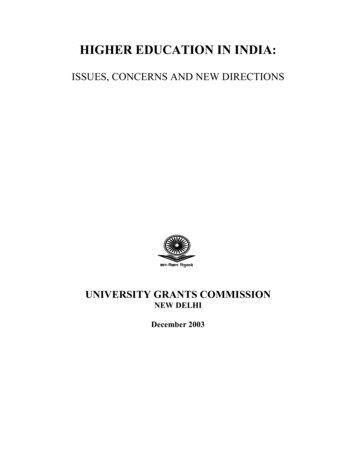
EnrollmentsLooking moreclosely atcommunityand technicalcollegesFour main areasAcademic transfer:Earning credits that can beapplied to a bachelor’sdegree program whenstudents transfer to fouryear institutions.ore than 70 percent of the students enrolled inWashington higher education attend one of thestate’s 34 community and technical colleges,which serve widely distributed population centers.Washington is ranked fifth nationally in terms of thepercentage of its population enrolled in community andtechnical colleges.MIn July 2006, the HECB approved four pilotbaccalaureate programs, enabling Olympic and PeninsulaColleges and Bellevue and South Seattle CommunityColleges to offer bachelors of applied science degrees.Most state-supported FTE enrollments at thetwo-year colleges are in workforce training andacademic transfer programs: 2004-05Workforceeducation: Preparingfor jobs or upgrading jobskills.Basic skills10%Transfer40%Home & familylife/other4%Basic skills: Takingcourses that focus onEnglish as a secondlanguage, adult basiceducation, and coursesleading to a high schooldiploma or GeneralEducation Development(GED) certificate. Note:Some portion of studentsclassified as “transfer” and“workforce” also enroll inone or more basic skillscourses.Home and familylife, other, and notreported: Thesestudents enroll for parenteducation, retirementplanning or otherpurposes. This categoryalso includes students whodid not specify a goalwhen they enrolled.Workforce education46%Percentage distributions have remainedstable over timeWorkforce educationTransferBasic skillsHome & family 6%39%10%5%46%40%10%4%46%40%10%4%Source: State Board for Community and Technical Colleges,Academic Year Report 2004-05.10
EnrollmentsCommunity and technical colleges: FTEs by purpose for attending2004-05 academic year (state supported)TransferBasicskillsHome & llinghamBig BendCascadiaCentraliaClarkClover ParkColumbia BasinEdmondsEverettGrays HarborGreen RiverHighlineLake WashingtonLower ColumbiaOlympicPeninsulaPierce PuyallupPierce SteilacoomRentonSeattle CentralSeattle NorthSeattle SouthShorelineSkagit ValleySouth Puget SoundSpokaneSpokane FallsSpokane Institute forExtended Learning *TacomaWalla WallaWenatchee ValleyWhatcomYakima ValleySystem TotalTotalSource: State Board for Community and Technical Colleges, Academic Year Report 2004-05.Notes: Totals may not add due to rounding. FTEs in this report are different than in other reports due to theway in which FTEs are calculated in variable credit courses. Seattle Vocational Institute’s enrollments areincluded in the Seattle Central Community College total. * Spokane IEL is part of the Spokane District.11
Branch campuses of the University of Washingtonand Washington State University were developedin the early 1990s, marking the first significantexpansion of the state’s public higher education systemin more than two decades. Branch campuses address theissue of access to higher education in urban growth areaswhere there is no public four-year institution.EnrollmentsBranchcampusesLegislation enacted in 2005 authorized lower-divisioncourses and freshman/sophomore admissions at the UWbranch campuses in Bothell and Tacoma, and at WSUVancouver. In 2006, the Legislature called on WSUTri-Cities to develop a plan for expanding into a fouryear institution. In January 2007, the HECB approvedthe proposal, allowing WSU Tri-Cities to beginadmitting lower-division students in fall 2007.Branch campus enrollments have grown 52005064,546Total FTE 6971997981998991999002000012001021,667FTE enrollments by campus1,2821,2001,3671990-912005-0669140623685UW Bothell139UW Tacoma143WSU Spokane * WSU Tri-Cities WSU Vancouver*The 2004 Legislature removed the “branch” designation for Washington State University Spokane.Source: Office of Financial Management, budget driver reports.12
or some students, the idea of “going to college” hastaken on new meaning. New technologies, such assatellite transmissions, cable networks and theInternet, have allowed expanded access to courses andprograms outside the traditional classroom environment.EnrollmentsFDistanceeducationDistance learning can be defined generally as teachersand students physically separated for at least someportion of the instructional time. Access to courseworkis facilitated through one or more distance-deliverymodes – ranging from mailed correspondence, tovideotaped instruction, to interactive Internetconnections.It is important to note that “distance” learning and“traditional” learning are not mutually exclusive.Students may enroll simultaneously in both types ofprograms.The portion of total instruction that can be characterizedas “distance learning” has averaged about 2 percent inthe four-year institutions and 5 percent in the two-yearsystem since data collection began in fall 2000.Distance learning enrollment as a percentage of total enrollmentpublic two-year and four-year institutions:fall 2000 through fall 2004Fall termFour-yearpercentageof totalTwo-yearpercentageof totalTotalfour-yeardistance FTEsTotaltwo-yeardistance 6.1%1,7937,339Definition of distance learning:The distance education learning course is defined as an academic degree credit course that is deliveredpredominantly through pre-recorded media, surface-mailed correspondence, Internet, interactivetelevision technologies, and/or broadcasting.Source: Office of Financial Management, Higher Education Trends and Highlights, March 2005.13
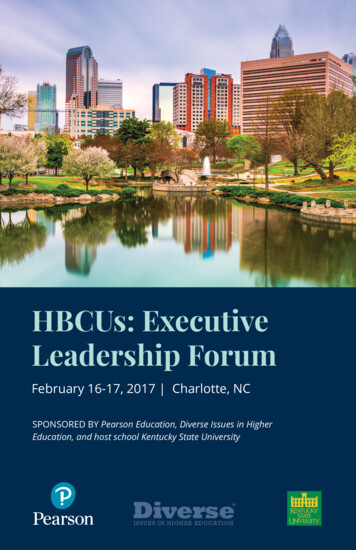
EnrollmentsWhat should thestate anticipatefor future highereducationenrollments?Based on projected 2006-07 participation in publichigher education, the projected enrollments forpublic higher education by 2010-11 would beover 240,000 full-time equivalent (FTE) enrollments.This would allow the same proportion of the state’spopulation to continue to enroll in public highereducation institutions.Similar to current enrollment distributions, futureprojections show the largest numbers of enrollments –about 142,000 FTEs – at community and technicalcolleges. About 99,000 FTEs would be enrolled atpublic four-year institutions.Maintaining the 2006-07 public higher educationparticipation rate will require 16,000 additionalstate-funded FTE enrollments by 2010-11Projected current servicelevel for 2010-11 240,524250,000Growth tomaintaincurrentparticipationrate: 16,162225,000200,000Projected enrollment2006-07 008-092009-102010-11Sources: Projections: Office of Financial Management, Public Two- and Four-Year Headcount and FTEProjections: Current Participation Rate Carried Forward, November 15, 2006.14
The number of high school graduates is anotherimportant predictor of higher educationenrollments. Because a high proportion of newcollege students are recent graduates from high school,tracking their predicted numbers can be useful foranticipating college demand.EnrollmentsProjections ofhigh schoolgraduatesAs the chart below shows, total numbers of high schoolgraduates in the state will continue to increase (with asmall decline in the next decade followed by anotherupswing). Currently, about 60 percent of Washington’shigh school graduates continue directly to an institutionof higher education and most enroll in colleges anduniversities within this state. If this percentage remainsconstant, or increases, the number of high schoolgraduates wanting to enter Washington’s colleges anduniversities will grow.Number of high school graduates in Washington:historical and 47,76545,76040,0001990-91 1993-94 1996-97 1999-00 2002-03 2005-06 2008-09 2011-12 2014-15 2017-18Source: Western Interstate Commission for Higher Education, Knocking at the College Door – 2003.Note: Data include public and private high school graduates.15
Part 2StudentsFacultyStaff171
At public institutions, a larger proportion ofyounger students enroll at four-year institutions,while the two-year community and technicalcolleges have a higher number of older students.Percentages below are based on fall headcounts of thosewho reported age.StudentsWho arethe studentsin highereducation?Age distributionPublic four-year institutions:age distribution in fall 200525-3420%35-499%20-2445%19 & under22%Community and technical colleges
ITT Technical Institute Seattle 601 ITT Technical Institute Everett 328 ITT Technical Institute Spokane 425 Mars Hill Graduate School Bothell 284 Northwest Baptist Seminary Tacoma 76 Northwest College of Art Poulsbo 130 Northwest University Kirkland 1,260 Pacific Lutheran University Tacoma 3,680