Transcription
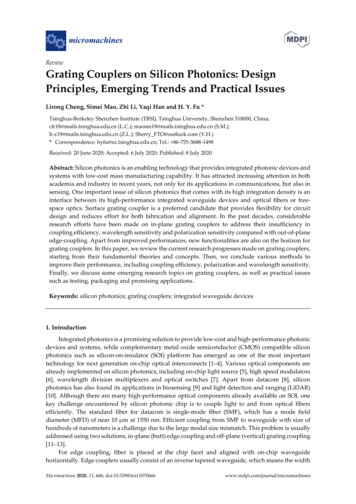
1008JOURNAL OF MICROELECTROMECHANICAL SYSTEMS, VOL. 29, NO. 5, OCTOBER 2020Polysilicon Grating Switches for LiDAREugene H. Cook , Steven J. Spector, Michael G. Moebius , Frederick A. Baruffi, Mirela G. Bancu,Lucas D. Benney, Steven J. Byrnes , Jordan P. Chesin, Sarah J. Geiger, Daniel A. Goldman , Member, IEEE,Alva E. Hare, Benjamin F. Lane, William D. Sawyer, and Chris R. BessetteAbstract— Novel polysilicon grating switches are demonstrated, consisting of an optical grating suspended on a movingplatform above a waveguide. Electrostatic attraction pulls thegrating into close proximity to the waveguide, ejecting light outof the waveguide plane. The switches move only 0.9 to 1.4 µm,and have MHz mechanical resonant frequencies, making themrobust to mechanical vibration and shock. These switches enablea new mode of LiDAR imaging; by creating a focal planearray of switches, and coupling it with a standard camera lens,the LiDAR beam can be scanned across the scene with highspeed and arbitrary pattern. Both time of flight and coherentranging techniques are compatible with this approach. We havedemonstrated a 10 10 pixel array of these switches in a LiDARsystem, collecting 3D raging data at up to 15 meters away and5 frames per second, over a 1 degree field of view with 0.1 degreeresolution. Additionally, we have shown the switches to be robust,efficient, and reliable, actuating at 15 Volts, with speeds fasterthan 4 µs, for over 9 billion cycles without degradation orfailure.[2020-0132]Index Terms— MEMS, MOEMS, switch, LiDAR, grating,micro optics, photonics.Fig. 1. Example LiDAR architecture. The micro-opto-mechanical chip isplaced at the focal plane. Activating one pixel at a time enables the beam tobe directed at any point in the scene.I. I NTRODUCTIONLiDAR is seen as a key enabling sensor component forautonomous vehicles [1], [2]. LiDAR provides an important tool for high-resolution three-dimensional imaging, withsuperior resolution to radar and superior range to ultrasonicsensors. Many current autonomous vehicle development platforms rely on traditional LiDAR systems, which use mechanical systems to sweep a laser beam over the scene. For widedeployment in the automotive market, it will be necessary torealize similar LiDAR performance at small cost and size.A variety of approaches have been developed to enablechip-scale LiDAR components. Optical phased arrays [3], [4]use multiple emitters of controlled phase to electronically steerthe light beam within the scene. These have the advantageof very small size and pure solid-state operation, but theyrely on complicated analog control of many phase shiftersand have difficulty scaling to large arrays. Flash LiDAR [5]simultaneously illuminates the entire scene, and uses an arrayof detectors to measure returns from each point. However,Manuscript received May 5, 2020; revised June 2, 2020; acceptedJune 11, 2020. Date of publication June 30, 2020; date of current versionOctober 7, 2020. Subject Editor M. Rais-Zadeh. (Corresponding author:Eugene H. Cook.)The authors are with the Charles Stark Draper Laboratory, Cambridge,MA 02139 USA (e-mail: ecook@draper.com).Color versions of one or more of the figures in this article are availableonline at http://ieeexplore.ieee.org.Digital Object Identifier 10.1109/JMEMS.2020.3004069it requires expensive detector arrays, and can have difficultykeeping the power output within eye-safe limits. MEMSmirrors have also been developed in a number of configurations [6], to mechanically scan the LiDAR beam over thescene. These mirrors also require precision analog positioncontrol, typically employ a fixed scan pattern taking advantageof the mechanical resonance, and can be sensitive to vibrationand shock because of the suspended flexible structure. Additionally, the design must manage the trade-off between a largemirror to maximize light collection, and a small mirror forfast operation and high resonant frequency, which helps resistvibration.Another technique is to use a waveguide-based photonicintegrated circuit (PIC), with emission gratings, to selectivelyeject light from individual pixels connected to the waveguide.These pixel arrays, placed in the focal plane of a camera, allowa LiDAR beam to be scanned across a scene by sequentiallyactivating each pixel (Fig. 1). Optics similar to those of anordinary camera project the beam into the scene. One way toswitch light within the waveguide network towards the emission gratings is with Mach-Zehnder Interferometers [7], [8].However, this approach requires analog control, relativelyhigh power, and can have switching speed limitations. MEMSoptical switches that can selectively connect waveguide segments have also been demonstrated [9], [10]. These canactuate quickly, and have much higher mechanical resonant1057-7157 2020 IEEE. Personal use is permitted, but republication/redistribution requires IEEE permission.See l for more information.Authorized licensed use limited to: DRAPER. Downloaded on October 08,2020 at 00:50:26 UTC from IEEE Xplore. Restrictions apply.
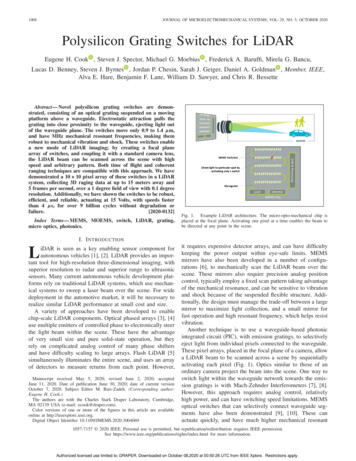
COOK et al.: POLYSILICON GRATING SWITCHES FOR LiDAR1009Fig. 2. A SEM shows the grating switch with stiffener. The waveguide isoriented horizontally, under the center of the device. Flexures support the fourcorners, and the circular features on the sides are electrical routing vias.frequencies than larger MEMS mirrors, rendering them robustagainst vibration. In order to improve compactness, we havecombined the emission grating and the MEMS switch into oneelement, rather than using a larger waveguide switch.Our novel surface micromachined optical switch is presented (Fig. 2). These switches differ from other opticalwaveguide MEMS switches [9], [10] in that they couple intofree space, rather than another waveguide. The switch consistsof an optical grating on a moving structure suspended abovea waveguide. When “OFF” (no voltage applied), the switch isfar enough from the waveguide that light propagating thereindoes not interact with the grating. When voltage is applied andthe switch is “ON” (pulled down), the evanescent field of thelight couples to the grating, and the optical design is such thatthe light is ejected into free space with an engineered emissionangle and numerical aperture.We have also built a LiDAR imager based on theseswitches [11]. The demonstrated LiDAR system was configured in a bistatic arrangement, with separate lens and singledetector element as the receiver. The use of separate chip forthe receiver is well suited for the direct time-of-flight rangemeasurements. Other LiDAR system configurations, such asusing the same grating or an adjacent grating in the receiverare also possible, and are well suited to coherent approachesto measure the range from the reflected signal.II. FABRICATIONThe fabrication process (Fig. 3) begins with a thermal oxidelower cladding, which prevents optical coupling to the siliconsubstrate. Polysilicon is then deposited, implanted with boron,annealed and patterned, forming the lower electrodes whichattract the switch into the “ON” position. LPCVD nitride isdeposited. The nitride waveguides provide low loss (measuredat about 7 dB/cm) while still resisting HF during the release.The nitride is patterned twice. First the waveguide is etched.Dimples (200 nm diameter circles and 200 nm bars) are alsoetched in the nitride, on top of the electrode and under theFig. 3.Fabrication process for the optical switches.Fig. 4.Detail of waveguide and anti-stiction dimples, as shown bymicroscope image taken after the step shown in Figure 3A.flexure locations (Fig. 4). These reduce the contact area andprevent the switch from sticking when pulled down (“ON”state.) The electrode thickness also sets the distance from thewaveguide to the grating in the “ON” state, since the dimplesare the same thickness as the waveguide. A 50 nm nitride slabis left in the etched areas to protect the lower cladding duringrelease. At this stage, the device looks like Fig. 3A and Fig. 4.Authorized licensed use limited to: DRAPER. Downloaded on October 08,2020 at 00:50:26 UTC from IEEE Xplore. Restrictions apply.
1010JOURNAL OF MICROELECTROMECHANICAL SYSTEMS, VOL. 29, NO. 5, OCTOBER 2020Fig. 6. Actuation of the switch at DC was measured with a laser confocalmicroscope. Deflection exhibits the classical non-linear electrostatic pull-inbehavior. This switch had soft flexures, enabling pull-in at 5 V.Fig. 5. Grating detail. Aperiodic gratings were designed to maximize efficiency while tailoring emission angle and numerical aperture. The horizontalwaveguide is visible underneath.Next, PECVD sacrificial oxide is deposited, planarized viaCMP, and patterned, forming a sacrificial layer that willbecome the switch “OFF” state gap of 0.9 or 1.4 μm (Fig. 3B).Vias are etched through the oxide and nitride to provideelectrical connections between the lower poly and the switch.The switch itself is constructed of 300 nm boron-dopedpolysilicon, etched (Fig. 3C) to form an optical grating (in thecenter) and supporting flexures (at the four corners). A detailedSEM of one grating design is shown in Fig. 5. The flexuredimensions are chosen to set the electrostatic pull-in voltagein the range of 5 to 40 Volts while being stiff enough to overcome stiction forces from the contact of the switch with thedimples.The top of some switches is reinforced with an additionalpolysilicon layer deposited on the sidewall of another sacrificial oxide (Fig. 3D). This rib structure, etched in this3rd polysilicon, stiffens the switch plate, to keep the gratinggeometry from deforming under actuation. At this stage,the wafer is diced, and the end facets of the waveguides arepolished to improve coupling with the external optical fiber.The process is completed when the switches are released in HFfollowed by a critical point dry to prevent stiction (Fig. 3E).Throughout the process, contact lithography was used forfeatures down to 1 μm, and e-beam lithography for smallerfeatures.III. M ECHANICAL P ERFORMANCESwitches were first tested by applying DC voltages to theactuation electrodes. Basic switches without the stiffeningstructures of Fig. 1 were tested first. A confocal laser microscope from Keyence was used to measure the deflection of theswitch at each voltage with respect to the fixed anchor points,and example results are shown in Fig. 6. The deflection followsthe classical MEMS formulae for non-linear electrostatic pullin, including: 8kg 3Vpull in 27ε AFig. 7. Dynamic actuation of the switch at 4kHz in 40 Torr. The thin redtrace is the raw output of the vibrometer. The raw output is corrected byoffsetting each continuous portion of the trace in the ordinate to correct fortracking errors in the vibrometer system, yielding the thick blue trace.and z pull in g 3Pull-in actuators are used intentionally for this systembecause they provide the advantage of digital control. Pull-into a specific hard stop location with well-defined opticalperformance is achieved despite variations in applied voltage,and the resulting beam position in the scene is determinedby the location of the switch in the array. This contrasts withmicro mirrors or optical phased arrays, where precise analogcontrol of the mechanical gimbal or phase shifters is necessaryto steer the beam across the scene.Dynamic performance of the switches was also tested, usinga Polytec MSA-400 laser Doppler vibrometer (LDV) system.This system uses an interferometer to measure velocity, andcan also report displacements using a hardware integrator.Tests were performed at 40 Torr and atmospheric pressure.The system includes a function generator, which was used toapply sawtooth waveforms (Fig. 7) to the actuation electrodesto enable examination of behavior over many cycles. Sawtooth waveforms are convenient because their piecewise linearvoltage vs. time segments show the nonlinear electrostaticAuthorized licensed use limited to: DRAPER. Downloaded on October 08,2020 at 00:50:26 UTC from IEEE Xplore. Restrictions apply.
COOK et al.: POLYSILICON GRATING SWITCHES FOR LiDARdisplacement behavior clearly. Actuation occurs with bothpositive and negative voltages, but we have usually biased thesawtooth drive signal, so that only one side results in pull-in.The LDV system is not able to track the comparatively fast( 1 μs) motion during pull-in and release events. These showup as discontinuities in the raw output (red trace in Fig. 7)and as apparent offsets between successive “OFF” states(displacement 0). An additional discontinuity is causedwhen the hardware integrator resets, which is triggered onthe rising zero-crossing of the sawtooth waveform beforebiasing (for example, at t 250, 500, 750 μs in Fig. 7).These erroneous discontinuities are removed by offsetting thecontinuous portion of the trace between them based on theknown “ON” and “OFF” positions from DC measurement ofthe switch actuation.Fig. 7 shows other details and non-idealities as well. First,partial actuation during the negative voltage cycle is visible asa cusp in the displacement (for example at t 188 μs). Also,the ringing of the switch at resonance after release can beseen as the switch returns to the “OFF” state each cycle. Thisresults from low damping at 40 Torr; atmospheric pressuretests showed no ringing. Ringing never occurs at the “ON”position because the stop prevents it. Finally, the “ON” state(for example t 47 to 94 μs) is not flat, indicating that theseoriginal un-stiffened switches are not rigid, and continue todeform once part of them has made contact with the stop.Many-cycle actuation showed that stiction correlates asexpected to spring stiffness, and thus pull-in voltage. Switcheswith about 15V or higher pull-in reliably returned to the“OFF” state, while lower voltage designs sometimes stuck.For 300 μm2 electrode area and 1 μm gap, this voltagethreshold corresponds to a spring constant of about 2 N/mand a spring force in the “ON” state of 2 μN. This force isroughly equivalent to the stiction force, since devices that meetthe stiffness and force threshold do not stick.Devices which did not stick tended to last for many cycles.Fig. 9 shows six example devices, which were all connectedto the function generator at 4kHz over about a month, withdata collected periodically. This corresponded to over 9 billioncycles of actuation. For a typical frame rate of 30 Hz,9 billion cycles corresponds to over 80,000 operational hoursin a LiDAR system, well above automotive requirements.No degradation in switch performance was observed, indicating that the nitride dimples and polysilicon switch do notwear significantly. None of these switches failed after 9 billioncycles; the test was ended to free up the test equipment.Actuation speed was also evaluated (Fig. 8). For actuationspeed tests, a trapezoidal waveform was used, enabling theswitch to fully settle in between ramped actuations. Switcheswere actuated as fast as 2-4 μs. At high speeds where theramp approaches 10 μs, our drive amplifier was unable tomaintain the shape of the waveform, and significant roundingof the trapezoid occurred. The fastest ramp the amplifier couldsupply was approximately 4 μs from 0 to 15 V. Likewise theLDV system is limited to 1 MHz sampling, so a different testapparatus would be needed to fully determine the ultimateswitch speed limit for these devices. However, the switchtimes compare favorably with LiDAR requirements: round-trip1011Fig. 8. Switching times of a few microseconds were demonstrated, sufficientfor LiDAR frame rates and comparable to photon travel time. The “OFF”location varies because the vibrometer cannot track motion at this speed withno error; the displacement was normalized against known switch geometry.Fig. 9.Electrostatic actuation measured by LDV. Six switches, labeled(a) through (f), were tested. Switches were actuated 9 billion times, with nodegradation. Curves are offset arbitrarily in the ordinate to show differences.travel time for a photon to a range of 200 m is 1.33 μs,so switch times of order 1 μs prevent the switching timefrom dominating the system timing. Because the LDV systemcannot track fast movements accurately, the amplitude of thespeed test data in Fig. 8 is not reliable. To ensure we werefully actuating the switches, we started at lower speed sothat the switch could be observed as stationary and thereforeat the limit of its travel, and then gradually increased thespeed, rather than relying on the displacement measurement.The displacements reported in Fig. 8 are then normalized,by dividing the traces by the average displacement differencebetween the stationary on and off periods, to eliminate theunreliable amplitude information.Residual stress in the polysilicon was not a significantfactor in switch deformation. We have used an optimizedpolysilicon deposition process, which deposits at 580 C andrecrystallizes at 600 C. After doping and implant anneal, stressis typically measured at less than 100 MPa by wafer curvature.The resulting flatness of the suspended polysilicon structure isshown in Fig. 10.Authorized licensed use limited to: DRAPER. Downloaded on October 08,2020 at 00:50:26 UTC from IEEE Xplore. Restrictions apply.
1012JOURNAL OF MICROELECTROMECHANICAL SYSTEMS, VOL. 29, NO. 5, OCTOBER 2020Fig. 10. The 3D structure of the unstiffened switch is measured. The “OFF”switch (a), with 0V applied, is flat, but the “ON” switch (b), with 16.3Vapplied, is deformed because of compliance in the electrode plate.The most significant non-ideality in mechanical switchperformance was bending of the central switch structure. Sincethe flexures and switch are fabricated in the same polysiliconlayer, the bending stiffness of the central plate was similarto the flexures, and all parts deflected under actuation. Thiscan be seen in the color variations of Fig. 10b and in thecross section measurement in Figure 11a&c. Deflections of 10sof nm can adversely affect the optical performance of thegrating, since its critical features are sub-wavelength scale.The stiffener polysilicon (shown in Fig. 2) forms a flangedbeam, greatly increasing stiffness of the plate, so deflectionsdecreased from 230 nm to 30 nm (Fig. 11b&d).Fig. 11. Stiffeners greatly reduce bending of the electrode switch, includingelectrodes and grating. Image (a) shows the measured shape of an un-stiffenedswitch, pulled down at 16.3 V. (b) shows a stiffened switch, pulled downat 35 V. The higher voltage is needed because of the higher stiffness andlarger electrostatic gap (1.5 μm instead of 1 μm). Multi-segment cross sectionlocations are illustrated in black on (a) and (b). The cross section of theunstiffened switch (c) shows the center portion bows by 230 nm. In contrast,the stiffened switch (d) has a flatter shape with only 80 nm variation in thecenter portion, and 20 nm in the grating.IV. O PTICAL P ERFORMANCEOptical gratings were tested for performance [11]. In orderto measure performance independent of switching characteristics, gratings without switches were first built directlyon a 100 nm sacrificial oxide gap, simulating the positionwhen pulled down. These gratings showed 73% optical efficiency, which compared well with the modeled efficiencyof 75%. Grating emission patterns also matched the modelwell, as shown in Fig. 12.Arrays of grating switches, as shown in Fig. 13, were usedfor LiDAR. This array comprises 10 10 switches, which formthe focal plane of the LiDAR imaging system as illustratedin Fig. 1. A 1550 nm pulsed laser was connected via fiberto the edge of the waveguide. Electrostatic actuation of eachswitch pixel in sequence directed light out through a lens andaperture. The beam bounced off the target, and was directed bya mirror and lens into a single-photon avalanche diode (SPAD)for detection. The time for each beam pulse to return, dividedby the speed of light, yields the range.One advantage of the beam steering mechanism we demonstrate here is that a standard lens can be selected to map thefocal plane array into the scene, with the desired parameters.The resolution of the received LiDAR image depends onthe lens geometry and pixel spacing (100 μm in this case,though the switch could be patterned at pitches as small as25 μm). For this demonstration, a lens was chosen whichprojects each pixel at a 0.1 degree spacing from each other.Authorized licensed use limited to: DRAPER. Downloaded on October 08,2020 at 00:50:26 UTC from IEEE Xplore. Restrictions apply.
COOK et al.: POLYSILICON GRATING SWITCHES FOR LiDAR1013Fig. 12. Modeled grating emission patterns (left) matched experiment (right),for fixed gratings.Fig. 14. LiDAR point cloud collected using a grating switch array. Axisunits are meters. The foreground (blue points) reflected off a toroidal target,in front of a wall (red points).This image shows full functionality of the LiDAR system,in returning a 3D image from the scene. It should be notedthat a defect in this device prevented much of the light fromreaching the last 3 rows of gratings, and there is no LiDARfrom these rows. However, the grating switches in these rowsotherwise functioned properly.R EFERENCESFig. 13. Optical micrograph shows a fabricated array of 10 10 switches.This array serves as the focal plane of a LiDAR device, projecting light fromthe selected pixel into the optics.This horizontal and vertical resolution was chosen based onrequirements from automotive LiDAR systems. With 10 pixelsthat leads to a 1 degree field of view (FOV). Assuming a10 μs dwell per pixel, a similar LiDAR system could scan100,000 pixels/s, such as in a 4 degree by 10 degree FOVwith 0.1 degree resolution at 25 frames/sec. For larger FOVwith comparable resolution, multiple laser and detector pairscan serve subarrays concurrently, or random-access scanningalgorithms can prioritize scanning of pixels that contain important information.Range resolution for this type of LiDAR system depends inlarge part on the pulse width of the laser, and is independent ofthe beam steering mechanism we present here. We have useda laser with a pulse width of about 1 ns, leading to a rangeresolution of half the light travel distance in that time, or about15 cm. Other contributions come from the jitter in laser pulsetiming, and the detector time resolution, but those are bothmuch smaller than 1 ns in our setup. The range resolutioncould be improved by averaging over several returns, but wehave not done that in this case, since the focus of the work is onthe beam steering system. An example LiDAR data point cloudgathered by this demonstration hardware is shown in Fig. 14.[1] C. Ilas, “Electronic sensing technologies for autonomous ground vehicles: A review,” in Proc. 8TH Int. Symp. Adv. TOPICS Electr. Eng.(ATEE), Bucharest, Romania, May 2013, pp. 1–6.[2] E. Yurtsever, J. Lambert, A. Carballo, and K. Takeda, “A survey ofautonomous driving: Common practices and emerging technologies,”IEEE Access, vol. 8, pp. 58443–58469, 2020, doi: 10.1109/ACCESS.2020.2983149.[3] C. V. Poulton et al., “Coherent solid-state LIDAR with silicon photonicoptical phased arrays,” Opt. Lett., vol. 42, no. 20, p. 4091, Oct. 2017,doi: 10.1364/OL.42.004091.[4] S. A. Miller et al., “512-element actively steered silicon phased array forlow-power LIDAR,” in Proc. Conf. Lasers Electro-Opt., San Hose, CA,USA, 2018, Paper JTh5C-2, doi: 10.1364/CLEO AT.2018.JTh5C.2.[5] P. F. Mcmanamon, P. Banks, J. Beck, D. G. Fried, A. S. Huntington, and E. A. Watson, “Comparison of flash lidar detectoroptions,” Opt. Eng., vol. 56, no. 3, Mar. 2017, Art. no. 031223,doi: 10.1117/1.OE.56.3.031223.[6] A. Kasturi et al., “Comparison of MEMS mirror LiDAR architectures,” Proc. SPIE MOEMS Miniaturized Syst., vol. 11293, Feb. 2020,Art. no. 112930B.[7] J. J. López et al., “Planar-lens enabled beam steering for chip-scaleLIDAR,” in Proc. Conf. Lasers Electro-Opt., 2018. San Jose, CA, 2018,Paper SM3I.1.[8] C. Li, X. Cao, K. Wu, X. Li, and J. Chen, “A switch-based integrated2D beam-steering device for lidar application,” in Proc. Conf. LasersElectro-Opt., San Jose, CA, 2019, Paper JTh2A.[9] T. J. Seok, N. Quack, S. Han, R. S. Muller, and M. C. Wu, “Largescale broadband digital silicon photonic switches with vertical adiabaticcouplers,” Optica, vol. 3, no. 1, pp. 64–70, Jan. 2016.[10] X. Zhang, K. Kwon, J. Henriksson, J. Luo, and M. C. Wu, “20 20focal plane switch array for optical beam steering,” in Proc. Conf. LasersElectro-Opt. (CLEO), San Jose, CA, USA, 2020.[11] S. J. Spector et al., “LiDAR beamsteering by digitally switched MEMSgratings on a silicon photonics platform,” in Proc. Conf. Lasers ElectroOpt. (CLEO), San Jose, CA, USA, 2020.Authorized licensed use limited to: DRAPER. Downloaded on October 08,2020 at 00:50:26 UTC from IEEE Xplore. Restrictions apply.
Abstract—Novel polysilicon grating switches are demon-strated, consisting of an optical grating suspended on a moving platform above a waveguide. Electrostatic attraction pulls the grating into close proximity to the waveguide, ejecting light out of the waveguide plane. The switches move only 0.9 to 1.4 µm,