Transcription
Nova Southeastern UniversityNSUWorksHCNSO Student Theses and DissertationsHCNSO Student Work1-1-2007Comparison of Fish Assemblages betweenMitigation Boulder Reef and Neighboring NaturalHardbottom in Broward County, Florida, USAJessica A. FreemanNova Southeastern UniversityFollow this and additional works at: https://nsuworks.nova.edu/occ stuetdPart of the Marine Biology Commons, and the Oceanography and Atmospheric Sciences andMeteorology CommonsShare Feedback About This ItemNSUWorks CitationJessica A. Freeman. 2007. Comparison of Fish Assemblages between Mitigation Boulder Reef and Neighboring Natural Hardbottom inBroward County, Florida, USA. Master's thesis. Nova Southeastern University. Retrieved from NSUWorks, . (266)https://nsuworks.nova.edu/occ stuetd/266.This Thesis is brought to you by the HCNSO Student Work at NSUWorks. It has been accepted for inclusion in HCNSO Student Theses andDissertations by an authorized administrator of NSUWorks. For more information, please contact nsuworks@nova.edu.
NOVA SOUTHEASTERN UNIVERSITY OCEANOGRAPHIC CENTERComparison of Fish Assemblages between Mitigation BoulderReef and Neighboring Natural Hardbottom inBroward County, Florida, USAByJessica A. FreemanSubmitted to the Faculty ofNova Southeastern University Oceanographic Centerin partial fulfillment of the requirements forthe degree of Master of Science with specialty in:Marine BiologyNova Southeastern University2007
Master of ScienceMarine BiologyThesis ofJESSICA A. FREEMANApprovedThesis CommitteeMajor Professor:Richard E. Spieler, Ph.D.Nova Southeastern University Oceanographic CenterCommittee Member:Paul T. Arena, Ph.D.Nova Southeastern University Farquhar College of Artsand SciencesCommittee Member:Robin L. Sherman, Ph.D.Nova Southeastern University Farquhar College of Artsand Sciences
I. AbstractA beach renourishment project was initiated in May 2005 and completed inFebruary 2006 to restore 11.1 km of shoreline in Broward County, Florida, USA. Formitigation of predicted nearshore hardbottom burial, a boulder reef totaling 3.6 ha wasdeployed in 2003. To examine the replacement value of the mitigation relative to fishes,this study compared fish assemblages on boulder reef to those on adjacent naturalhardbottom. Twenty-five natural hardbottom sites and twenty-five boulder reef sites weresurveyed six times between March 2005 and August 2007. Two non-destructive visualcensus methods, a transect count (30 m long x 2 m wide x 1 m high) and a 20 minuterover diver count (approximately 30 m x 30 m), were conducted at each site to assessabundance and species richness. On transect counts, 7,117 fishes of 96 species werecounted on natural hardbottom, while 11,769 fishes of 119 species were counted onboulder reef. Across both survey types, a total of 271 species was recorded. Significantdifferences among reef fish assemblages were found in both abundance and speciesrichness (p 0.05, ANOVA). In addition, a plot of Bray-Curtis similarity indices indicateddifferences in fish assemblage structure between natural hardbottom and boulder reefwithin all individual years. Natural hardbottom exhibited higher densities of newly settled( 2 cm TL) Haemulon spp., while boulder reef showed higher densities of early juvenile(2-5 cm TL) Haemulon spp. Boulder reef also had a higher abundance of fishes greaterthan 5 cm and piscivorous fishes in general. While boulder reef may provide a suitablehabitat for many fishes, it does not mimic natural hardbottom-associated fishassemblages, nor does it provide a similar nursery habitat for juvenile fishes.i
II. AcknowledgementsThis thesis would not have been possible without the help and support of manypeople. I would like to thank my committee members Drs. Richard Spieler, Paul Arena,and Robin Sherman for all their valuable help, comments, and suggestions throughoutthis process. I especially thank Richard for giving me a job in the ichthyology lab. I’vebeen lucky enough to go on many great research trips through this job, and have gainedgreat experience and true appreciation working with fish while traveling to Akumal,Puerto Morelos, St. Croix, and Veracruz.I would also like to thank the fish lab for all of their hard work collecting data forthis project. There were many early mornings, long days, and even weekends spent outon the water to make sure that the surveys were completed on time. Many people overthe years have helped with these fish counts: Paul Arena, Bethany Basten, David Bryan,Lance Jordan, Kirk Kilfoyle, Danielle Morley, Pat Quinn, and Richard Spieler. Specialthanks goes out to Pat for getting this project going and doing a lot of the leg work tomake sure everything ran smoothly.Finally, I would like to thank my family and friends for always supporting methrough this degree. Even when I told my parents I was going to move 1,000 miles awayfrom home, they showed me love and support to follow my dreams. It has been awonderful three years here at the OC and I will leave here with many great memories andfriends.ii
III. Table of ContentsI.II.III.IV.V.Abstract . iAcknowledgements . iiTable of Contents . iiiList of Figures . vList of Tables . ix1.0 Introduction . 11.1 Background . 11.2 Natural Reef . 31.3 Artificial Reef . 71.4 Statement of Purpose . 72.0 Materials and Methods . 82.1 Background . 92.2 Transect Counts . 92.3 Rover Diver Counts . 122.4 Statistics . 133.0 Results . 143.1 By Year and Across All Years . 143.1.1 June 2004 . 143.1.2 August 2004 . 183.1.3 March 2005 . 203.1.4 August 2005 . 243.1.5 August 2006 . 273.1.6 August 2007 . 313.1.7 Across All Surveys . 373.2 Temporal Variation . 413.2.1 Seasonal Variation . 413.2.2 Yearly Colonization . 413.3 Predator Effects . 493.3.1 Size Classes. 493.3.2 Predators and Juveniles . 553.3.3 Juvenile Fishes . 584.0 Discussion. 605.0 Conclusion . 686.0 Literature Cited . 70iii
Appendix AFish species recorded on all transects by total count (T) and the numberof occurrences seen (O) on both the natural hardbottom (N) and themitigation boulders (B) . 75Appendix B Fish species recorded on rover diver counts for all years with thenumber of occurrences seen on both the natural hardbottom (N) andthe mitigation boulders (B) . 84Appendix C GPS coordinates of natural hardbottom and mitigation bouldertransects. 95Appendix D Fishes present on all transect surveys (both natural hardbottomand mitigation boulder combined) classified according to trophic level.BC benthic carnivore, C cleaner, H herbivore, O omnivore,Pi piscivore, and Pl planktivore . 98iv
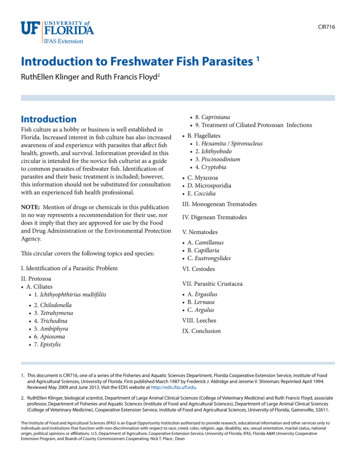
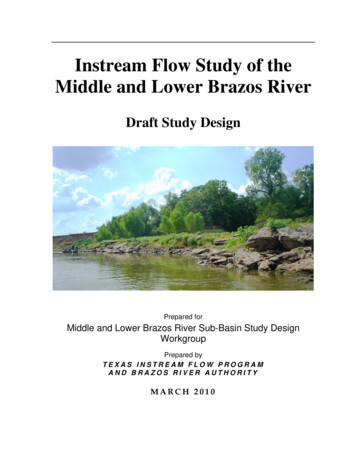
IV. List of FiguresFigure 1. Monitored beach restoration/nourishment projects in Florida. The BrowardCounty Beach Renourishment Project (Segment III) beaches are locatedin the Hollywood/Hallandale area. From Wang et al., 2005 . 2Figure 2. View of the Broward County coastline (a). The red square in (a) isenlarged in (c), showing the LIDAR bathymetry in greater detail. The blackline through (c) shows the location of the bathymetric profile illustrated in(b). Modified from Gilliam, 2007 . 4Figure 3. Laser Airborne Depth Sounding (LADS) image showing the 25 artificialreef transects (blue) and the 25 natural reef transects (yellow) surveyed . 10Figure 4. Layout of transect and rover diver counts at a typical site . 12Figure 5. Mean abundance of fishes (June 2004) on the natural hardbottom (N)versus the mitigation boulders (B) without and with rugositystandardization. The asterisk indicates a significant difference (p 0.05:ANOVA; SNK) in abundance between bars of the same color . 15Figure 6. Mean species richness of fishes (June 2004) on the natural hardbottom (N)versus the mitigation boulders (B) without and with rugositystandardization. The asterisks indicate significant differences (p 0.05:ANOVA; SNK) in species richness between bars of the same color . 15Figure 7. MDS plot (June 2004) of Bray-Curtis similarity indices for the naturalhardbottom (N) and the mitigation boulders (B) not standardized forrugosity . 17Figure 8. MDS plot (June 2004) of Bray-Curtis similarity indices for the naturalhardbottom (N) and the mitigation boulders (B) standardized for rugosity . 17Figure 9. Mean abundance of fishes (August 2004) on the natural hardbottom (N)versus the mitigation boulders (B) without and with rugositystandardization . 18Figure 10. Mean species richness of fishes (August 2004) on the natural hardbottom(N) versus the mitigation boulders (B) without and with rugositystandardization. The asterisks indicate significant differences (p 0.05:ANOVA; SNK) in species richness between bars of the same color . 19Figure 11. MDS plot (August 2004) of Bray-Curtis similarity indices for the naturalhardbottom (N) and the mitigation boulders (B) not standardized forrugosity . 21Figure 12. MDS plot (August 2004) of Bray-Curtis similarity indices for the naturalhardbottom (N) and the mitigation boulders (B) standardized for rugosity . 21Figure 13. Mean abundance of fishes (March 2005) on the natural hardbottom (N)versus the mitigation boulders (B) without and with rugositystandardization . 22Figure 14. Mean species richness of fishes (March 2005) on the natural hardbottom(N) versus the mitigation boulders (B) without and with rugositystandardization. The asterisks indicate significant differences (p 0.05:ANOVA; SNK) in species richness between bars of the same color . 22v
Figure 15. MDS plot (March 2005) of Bray-Curtis similarity indices for the naturalhardbottom (N) and the mitigation boulders (B) not standardized forrugosity . 25Figure 16. MDS plot (March 2005) of Bray-Curtis similarity indices for the naturalhardbottom (N) and the mitigation boulders (B) standardized for rugosity . 25Figure 17. Mean abundance of fishes (August 2005) on the natural hardbottom (N)versus the mitigation boulders (B) without and with rugositystandardization. The asterisk indicates a significant difference (p 0.05:ANOVA; SNK) in abundance between bars of the same color . 26Figure 18. Mean species richness of fishes (August 2005) on the natural hardbottom(N) versus the mitigation boulders (B) without and with rugositystandardization. The asterisk indicates a significant difference (p 0.05:ANOVA; SNK) in species richness between bars of the same color . 26Figure 19. MDS plot (August 2005) of Bray-Curtis similarity indices for the naturalhardbottom (N) and the mitigation boulders (B) not standardized forrugosity . 28Figure 20. MDS plot (August 2005) of Bray-Curtis similarity indices for the naturalhardbottom (N) and the mitigation boulders (B) standardized for rugosity . 28Figure 21. Mean abundance of fishes (August 2006) on the natural hardbottom (N)versus the mitigation boulders (B) without and with rugositystandardization. The asterisks indicate significant differences (p 0.05:ANOVA; SNK) in abundance between bars of the same color . 29Figure 22. Mean species richness of fishes (August 2006) on the natural hardbottom(N) versus the mitigation boulders (B) without and with rugositystandardization. The asterisks indicate significant differences (p 0.05:ANOVA; SNK) in species richness between bars of the same color . 30Figure 23. MDS plot (August 2006) of Bray-Curtis similarity indices for the naturalhardbottom (N) and the mitigation boulders (B) not standardized forrugosity. The oval indicates a second cluster within the naturalhardbottom . 32Figure 24. MDS plot (August 2006) of Bray-Curtis similarity indices for the naturalhardbottom (N) and the mitigation boulders (B) standardized for rugosity.The oval indicates a second cluster within the natural hardbottom . 32Figure 25. Mean abundance of fishes (August 2007) on the natural hardbottom (N)versus the mitigation boulders (B) without and with rugositystandardization . 33Figure 26. Mean species richness of fishes (August 2007) on the natural hardbottom(N) versus the mitigation boulders (B) without and with rugositystandardization. The asterisk indicates a significant difference (p 0.05:ANOVA; SNK) in species richness between bars of the same color . 33Figure 27. Mean abundance of fishes (August 2007) minus grunts 5 cm TL on thenatural hardbottom (N) versus the mitigation boulders (B) without andwith rugosity standardization. The asterisk indicates a significantdifference (p 0.05: ANOVA; SNK) in abundance between bars of thesame color . 34vi
Figure 28. MDS plot (August 2007) of Bray-Curtis similarity indices for the naturalhardbottom (N) and the mitigation boulders (B) not standardized forrugosity. The circle indicates a second cluster within the naturalhardbottom . 36Figure 29. MDS plot (August 2007) of Bray-Curtis similarity indices for the naturalhardbottom (N) and the mitigation boulders (B) standardized for rugosity.The circle indicates a second cluster within the natural hardbottom . 36Figure 30. Mean abundance of fishes (across all surveys) on the natural hardbottom(N) versus the mitigation boulders (B) without and with rugositystandardization. The asterisks indicate significant differences (p 0.05:ANOVA; SNK) in abundance between bars of the same color . 37Figure 31. Mean species richness of fishes (across all surveys) on the naturalhardbottom (N) versus the mitigation boulders (B) without and withrugosity standardization. The asterisks indicate significant differences(p 0.05: ANOVA; SNK) in species richness between bars of the samecolor . 38Figure 32. MDS plot (across all surveys) of Bray-Curtis similarity indices for thenatural hardbottom (N) and the mitigation boulders (B) not standardizedfor rugosity . 39Figure 33. MDS plot (across all surveys) of Bray-Curtis similarity indices for thenatural hardbottom (N) and the mitigation boulders (B) standardized forrugosity . 40Figure 34. Abundance of fishes on natural hardbottom (a) and mitigation boulder (b)transects across all surveys by trophic level. BC benthic carnivore,C cleaner, H herbivore, O omnivore, Pi piscivore, and Pl planktivore . 42Figure 35. MDS plot of abundance values by month on natural hardbottom transects . 43Figure 36. MDS plot of abundance values by month on mitigation boulder transects . 43Figure 37. MDS plot of natural hardbottom transects by year, August only . 44Figure 38. MDS plot of mitigation boulder transects by year, August only . 46Figure 39. Percentage of juvenile fishes present on mitigation boulder transects byyear . 49Figure 40. Mean abundance of fishes 2 cm TL on natural hardbottom (N) andmitigation boulder (B) transects across all surveys. Newman-Keulsgrouping letters that are the same are not significantly different (p 0.05). . 50Figure 41. Mean abundance of fishes 2-5 cm TL on natural hardbottom (N) andmitigation boulder (B) transects across all surveys. Newman-Keulsgrouping letters that are the same are not significantly different (p 0.05). . 50Figure 42. Mean abundance of fishes 5 cm TL on natural hardbottom (N) andmitigation boulder (B) transects across all surveys. Newman-Keulsgrouping letters that are the same are not significantly different (p 0.05). . 51Figure 43. Mean abundance of fishes 5-10 cm TL on natural hardbottom (N) andmitigation boulder (B) transects across all surveys. Newman-Keulsgrouping letters that are the same are not significantly different (p 0.05). . 52Figure 44. Mean abundance of fishes 10-20 cm TL on natural hardbottom (N) andmitigation boulder (B) transects across all surveys. Newman-Keulsgrouping letters that are the same are not significantly different (p 0.05) . 53vii
Figure 45. Mean abundance of fishes 20-30 cm TL on natural hardbottom (N) andmitigation boulder (B) transects across all surveys. Newman-Keulsgrouping letters that are the same are not significantly different (p 0.05) . 54Figure 46. Mean abundance of fishes 30-50 cm TL on natural hardbottom (N) andmitigation boulder (B) transects across all surveys . 54Figure 47. Mean abundance of fishes 50 cm TL on natural hardbottom (N) andmitigation boulder (B) transects across all surveys . 55Figure 48. Abundance of adult and juvenile fishes on natural hardbottom (N) andmitigation boulder (B) transects across all surveys . 59Figure 49. Abundance of juveniles 2 cm in length during August 2007 on naturalhardbottom (N) and mitigation boulder (B) transects. . 59Figure 50. Abundance of juveniles 2-5 cm in length during August 2007 on naturalhardbottom (N) and mitigation boulder (B) transects. . 60viii
V. List of TablesTable 1.Table 2.Table 3.Table 4.Table 5.Table 6.Table 7.Table 8.Table 9.Table 10.Table 11.Table 12.Table 13.SIMPER analysis of dissimilarity showing the percent contribution ofeach species for June 2004 between the natural hardbottom (N) and themitigation boulders (B). The average dissimilarity was 76.57%. . 16SIMPER analysis of dissimilarity showing the percent contribution ofeach species for August 2004 between the natural hardbottom (N) and themitigation boulders (B). The average dissimilarity was 69.38%. . 20SIMPER analysis of dissimilarity showing the percent contribution ofeach species for March 2005 between the natural hardbottom (N) and themitigation boulders (B). The average dissimilarity was 85.68%. . 23SIMPER analysis of dissimilarity showing the percent contribution ofeach species for August 2005 between the natural hardbottom (N) and themitigation boulders (B). The average dissimilarity was 76.67% . 27SIMPER analysis of dissimilarity showing the percent contribution ofeach species for August 2006 between the natural hardbottom (N) and themitigation boulders (B). The average dissimilarity was 78.46%. . 31SIMPER analysis of dissimilarity showing the percent contribution ofeach species for August 2007 between the natural hardbottom (N) and themitigation boulders (B). The average dissimilarity was 77.03%. . 35SIMPER analysis of dissimilarity showing the percent contribution ofeach species across all surveys between the natural hardbottom (N) andthe mitigation boulders (B). The average dissimilarity was 77.02%. . 38SIMPER analysis of dissimilarity showing species contributing the topfifty percent to the dissimilarity between August 2004, 2005, 2006, and2007 on the natural hardbottom (N). 45SIMPER analysis of dissimilarity showing species contributing the topforty percent to the dissimilarity between August 2004, 2005, 2006, and2007 on the mitigation boulders (B). . 47Abundance of predators on August 2007natural hardbottom transects bysize class, common name, and scientific name . 56Abundance of predators on August 2007 mitigation boulder transects bysize class, common name, and scientific name . 56Total number of occurrences of predators noted on natural hardbottomrover diver surveys during August 2007 . 57Total number of occurrences of predators noted on mitigation boulderrover diver surveys during August 2007 . 58ix
1.0 Introduction1.1 BackgroundBeaches are the leading tourist destination in the United States, with seventy-fivepercent of those with summer travel plans including a visit to a beach (Houston, 2002).Beach tourism contributes 39.2 billion to Florida’s state economy (Murley et al., 2005),and reef-related activities, such as fishing, diving, and snorkeling, also provide largeamounts of revenue to the state. Between June 2000 and May 2001, visitors to southeastFlorida spent over 1.8 billion on these reef-related activities. This helped create over35,000 full-time and part-time jobs in Broward County during the same time period(Johns et al., 2003). To ensure continued benefits of this tourism, Florida spends anaverage of 20-40 million a year maintaining its beaches (Finkl, 1996), while largeramounts are spent on beach renourishment projects. Beach renourishment is the processof adding sand to a location where the natural shoreline has eroded. Althoughrenourishment is expensive, the economic return is high. For example, between 1980 and1982, a 16.9 km section of Miami Beach was renourished with dredged sand at a cost of 80 million (Pilkey et al., 1984; Silberman and Klock, 1988). Renourishment, in turn,was correlated with an increase in attendance from eight million visitors in 1978 to 21million visitors in 1983 (Frohling, 1985). Beach erosion, therefore, is a prime concern toboth the Nation’s beach tourism industry and local economies.Beaches are constantly eroding due to poorly designed coastal defense structures(i.e. seawalls, jetties, groin fields), as well as by hurricanes and other natural processeswhich constantly change the shoreline (Silberman and Klock, 1988). Currently, there aremore than 50 active beach renourishment projects being monitored in the state of Florida-1-
dating back to 1989, with about 25% of those renourished beaches occurring in PalmBeach, Broward, and Miami-Dade counties (Finkl et al., 1988; Wang et al., 2005)(Figure 1). The decision regarding when to undergo this expensive process is determinedFigure 1. Monitored beach restoration/nourishment projects in Florida. The BrowardCounty Beach Renourishment Project (Segment III) beaches are located in theHollywood/Hallandale area. From Wang et al., 2005.by weighing the pros and cons of beach renourishment. Positive aspects of beachrenourishment include an increase in recreation and storm protection (Finkl et al., 1988;Silberman and Klock, 1988); enhanced property values; increased sales, income, andemployment (Murley et al., 2005); as well as flood control and habitat for endangeredspecies (Finkl, 1996).However, there are also negative aspects of beach renourishment. Sand must bebrought in from a borrow site and carefully placed onto the recipient beach. This process-2-
has the potential to negatively impact natural ecosystems at both sites. Nearshore habitatcan become completely buried when additional sand is added, and increasedsedimentation may occur as fill material is redistributed by natural processes to a morestable profile (National Research Council, 1995). A 1995 beach restoration project inJupiter, FL, buried nearshore hardbottom habitat, reducing the number of fish speciesfrom 54 to 8 (Lindeman and Snyder, 1999). Broward County has been involved inshoreline protection, beach restoration, and beach sand management since the early1960’s to help combat the state of chronic erosion (USACOE and FDEP, 2005). Previousrenourishment was conducted in John U. Lloyd State Park in 1976 and again in 1989, aswell as in the Hollywood/Hallandale area in 1979 and 1991 (Murley et al., 2003). Thecurrent Broward County Beach Renourishment Project (Segment III) began during 2005to restore 11.1 km of shoreline. This project aimed to restore beaches from the south jettyof Port Everglades and John U. Lloyd State Park through the Hollywood/Hallandale area.State agencies require that adverse effects of surface water activity be mitigated (FloridaStatute 373.414(1)(b)). The success of one form of mitigation, boulder reef, is the focusof this study.1.2 Natural ReefThe Florida reef tract is the northern boundary of existing hard and soft coralcommunities that extend from the Dry Tortugas northward through Palm Beach County,a distance of over 400 km (Goldberg, 1973; Marszalek et al., 1977; Vare, 1991). Thepresence of this high-latitude tropical reef system is due in large part to the FloridaCurrent. The Florida Current, a subsystem of the Gulf Stream, brings tropical water, aswell as plankton and new recruits, to the reef and maintains significantly warmer water-3-
than resident shelf water masses during the winter (Jaap, 1984). In southeast Florida fromMiami-Dade through Palm Beach County, there are three parallel terraces, each separatedby a sand channel, that make up the reef tract (Goldberg, 1973; Moyer et al., 2003; Bankset al., 2007; Walker et al., in press) (Figure 2). This relic reef flourished during theFigure 2. View of the Broward County coastline (a). The red square in (a) is enlarged in(c), showing the LIDAR bathymetry in greater detail. The black line through (c) showsthe location of the bathymetric profile illustrated in (b). Modified from Gilliam, 2007.Holoc
Hardbottom in Broward County, Florida, USA Jessica A. Freeman . Major Professor: _ Richard E. Spieler, Ph.D. Nova Southeastern University Oceanographic Center . Committee Member: _ Paul T. Arena, Ph.D. Nova Southeastern University Farquhar College of Arts and Sciences Committee Member: _ Robin L. Sherman, Ph.D. Nova Southeastern .