Transcription
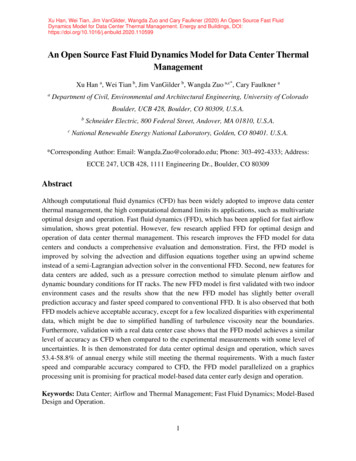
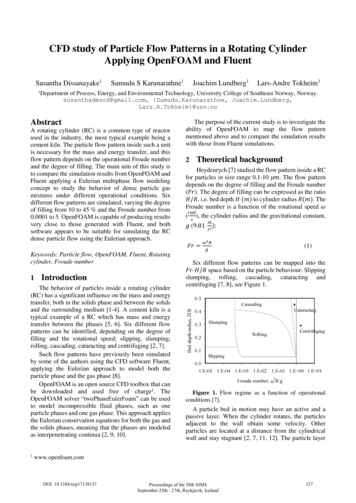
CFD study of Particle Flow Patterns in a Rotating CylinderApplying OpenFOAM and FluentSusantha Dissanayake11Sumudu S Karunarathne1Joachim Lundberg1Department of Process, Energy, and Environmental Technology, University College of Southeast Norway, Norway.susanthadmscd@gmail.com, {Sumudu.Karunarathne, Joachim.Lundberg,Lars.A.Tokheim}@usn.noAbstractA rotating cylinder (RC) is a common type of reactorused in the industry, the most typical example being acement kiln. The particle flow pattern inside such a unitis necessary for the mass and energy transfer, and thisflow pattern depends on the operational Froude numberand the degree of filling. The main aim of this study isto compare the simulation results from OpenFOAM andFluent applying a Eulerian multiphase flow modelingconcept to study the behavior of dense particle gasmixtures under different operational conditions. Sixdifferent flow patterns are simulated, varying the degreeof filling from 10 to 45 % and the Froude number from0.0001 to 5. OpenFOAM is capable of producing resultsvery close to those generated with Fluent, and bothsoftware appears to be suitable for simulating the RCdense particle flow using the Eulerian approach.The purpose of the current study is to investigate theability of OpenFOAM to map the flow patternmentioned above and to compare the simulation resultswith those from Fluent simulations.Theoretical background2Heydenrych [7] studied the flow pattern inside a RCfor particles in size range 0.1-10 𝜇𝑚. The flow patterndepends on the degree of filling and the Froude number(𝐹𝑟). The degree of filling can be expressed as the ratio𝐻/𝑅, i.e. bed depth 𝐻 (𝑚) to cylinder radius 𝑅(𝑚). TheFroude number is a function of the rotational speed 𝜔𝑟𝑎𝑑( ), the cylinder radius and the gravitational constant,𝑠𝑔 (9.81𝐹𝑟 Keywords: Particle flow, OpenFOAM, Fluent, Rotatingcylinder, Froude number1IntroductionThe behavior of particles inside a rotating cylinder(RC) has a significant influence on the mass and energytransfer, both in the solids phase and between the solidsand the surrounding medium [1-4]. A cement kiln is atypical example of a RC which has mass and energytransfer between the phases [5, 6]. Six different flowpatterns can be identified, depending on the degree offilling and the rotational speed; slipping, slumping,rolling, cascading, cataracting and centrifuging [2, 7].Such flow patterns have previously been simulatedby some of the authors using the CFD software Fluent,applying the Eulerian approach to model both theparticle phase and the gas phase [8].OpenFOAM is an open source CFD toolbox that canbe downloaded and used free of charge1. TheOpenFOAM solver “twoPhaseEulerFoam” can be usedto model incompressible fluid phases, such as oneparticle phases and one gas phase. This approach appliesthe Eulerian conservation equations for both the gas andthe solids phases, meaning that the phases are modeledas interpenetrating continua [2, 9, 10].1Lars-Andre Tokheim1𝑚𝑠2):𝜔2 𝑅𝑔(1)Six different flow patterns can be mapped into the𝐹𝑟-𝐻/𝑅 space based on the particle behaviour: Slippingslumping, rolling, cascading, cataracting andcentrifuging [7, 8], see Figure 1.Figure 1. Flow regime as a function of operationalconditions [7].A particle bed in motion may have an active and apassive layer. When the cylinder rotates, the particlesadjacent to the wall obtain some velocity. Otherparticles are located at a distance from the cylindricalwall and stay stagnant [2, 7, 11, 12]. The particle layerwww.openfoam.comDOI: 10.3384/ecp17138137Proceedings of the 58th SIMSSeptember 25th - 27th, Reykjavik, Iceland137
that gains some velocity due to the cylindrical wallrotation is called the active layer, whereas the stagnantlayer of particles is referred to as a passive layer. Whenthe rotational speed increases, the active layer thicknessincreases. An illustration of active and passive layers isshown in Figure 2.predominantly a passive layer, hence slumping is notvery usable in industrial applications.Figure 4. The slumping mode.2.1.3 RollingFigure 1. The active and passive layers development inan RC.2.1 Basic Flow patternsThe six different basic flow patterns are described inthis section.2.1.1 SlippingThe slipping mode can be observed for 𝐻/𝑅 0.15and 𝐹𝑟 0.001. In the slipping mode, the active layershows very little particle movement [7, 13], and theactive layer is very thin compared to the passive layer,see Figure 3. In other words, the passive layer ispredominant in this flow mode. As a result, the particlemixing, the mass trasfers and the heat transfer betweenpaticles and between gas and particles is at a minimum.When 𝐹𝑟 increases to the range 0.001-1 and 𝐻/𝑅 isin the range 0.05-0.35, the rolling mode can beobserved.In the rolling mode, particles close to the cylindricalwall moves with the wall to a certain elevation and thenroll back on the surface of the bed. As a result, a circularbed movement can be observed in the rolling mode, seeFigure 5. Due to this circular particle motion, most ofthe particles touch the cylinder bottom and the uppersurface during operation, meaning that the active layeris dominant. Subsequently, the transfer of heat and massbetween particles and between gas and particles isincreased.For typical industrial operations like that of a cementkiln, the rolling mode is used [1, 5]. According to theNielsen, et al. [5] a cement kiln is operated at 3-4 rpm.Figure 5. Rolling mode.2.1.4 CascadingFigure 3. The slipping mode.2.1.2 SlumpingIf 𝐹𝑟 is kept below 0.001, but 𝐻/𝑅 is increased above0.15, the particle bed tends to move with the movingwall, but then at a some elevation the particles suddenlycollapse and move back towards the initial position [13],see Figure 4. Due to the slumping behavior, the bed isDOI: 10.3384/ecp17138137When the degree of filling increases to a certain levelabove that of the rolling mode, the cascading mode canbe seen [11, 13]. In this mode, the active and passivelayers are difficult to distinguish from each other.In the cascading mode, the particles show a strongeraccumulation on the elevated side, and the top layer ofthe particle bed moves more compared to the rollingmode, see Figure 6. The cascading mode actually givesmaximum mixing and maximum mass and heat transfer.However, since this operation mode consumes extraenergy, it is usually not considered the optimal solution.Proceedings of the 58th SIMSSeptember 25th - 27th, Reykjavik, Iceland138
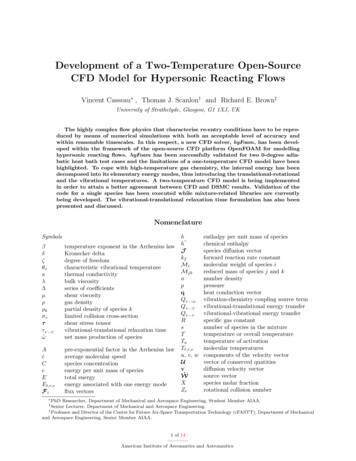
Figure 6. The cascading mode.Figure 8. The centrifuging mode.2.1.5 CataractingFor 𝐹𝑟 1 and high 𝐻/𝑅 values, the cataractingmode occurs [7, 11], see Figure 7. The cataracting modecan be seen in RCs operating at high rotational speeds.The cataracting mode has free falling particles at theelevated end of the cylinder, see Figure 7. Such a flowpattern gives improved mixing with gas phase inside thecylinder. However, the cataracting mode is not beconsidered a viable option in the industrial applicationsas the operational range is very narrow and the rotationalspeed must be very high.Figure 7. Cataracting mode.2.1.6 CentrifugingA further increase in 𝐹𝑟 will give the centrifugalmode. In this mode, most of the particles are pressedtowards the cylindrical wall due to the centrifugal force,see Figure 8. This mode requires extremely highrotational speeds. In the centrifugal mode the activelayer is dominant.For normal industrial operations, in which particlemixing and heat transfer are expected, the centrifugalmode is not used. However, it may be utilized in someapplications, such as drying or separation of solids froma fluid [14].DOI: 10.3384/ecp171381373Simulation studyIn this study, OpenFOAM (version 4.1) and ANSYSFluent (release 16.2) were used, applying the EulerEuler approach, in which a set of continuity andmomentum equations was solved for each phase. Thismeans that gas and solids phases are modeled as twointerpenetrating continua [2]. The method is based onproperty averaging in the time domain, where the localinstantaneous balance of each phase is obtained.Moreover, time averaging of the fluid flow motion isapplied; the Reynolds-Average Navier-Stokes (RANS)method is used to solve the properties of the turbulentflow field [15].The details of the Eulerian model and the particledrag model, as well as additional information, are givenin a previous article by some of the present authors [8,16] and are therefore not repeated here.The six different flow patterns illustrated in Figure 1were simulated using the operational conditions given inTable 1.In the simulation, a lab-scale RC with a radius of0.20 m was considered. The diameter of full-scalecement kilns are typically 10-20 times bigger than this,but lab-scale RC has been practical to use in verificationof results simulated with the Fluent software [8]. Toenable comparison of OpenFOAM and Fluent results,the same RC is the basis for the current study.In the slipping and slumping modes, the rotationalspeed was low (0.67 rpm), so a relatively longoperational time (90 s) had to be simulated to make surethere was enough time for the flow pattern to develop.In the rolling and cascading modes, the rotational speedwas 10 times higher (6.67 rpm), so the time could bereduced by a factor of 10. Moreover, in the cataractingand centrifuging modes, the rotational speeds werehigher by a factor of 10 and 22.5, respectively, so thetime could be reduced accordingly.Proceedings of the 58th SIMSSeptember 25th - 27th, Reykjavik, Iceland139
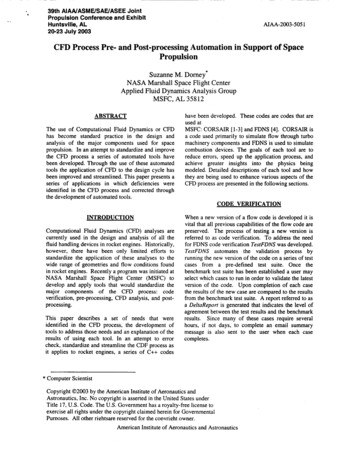
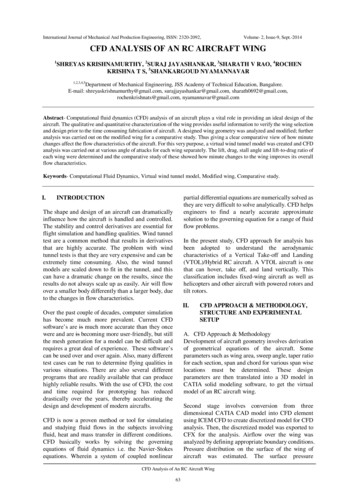
Table 1. Simulation parameters (R 0.20 m).DetailDegreeoffilling, 𝐻/𝑅Rotationalspeed (𝑅𝑃𝑀)FroudenumberTotaltimesimulated 6.71500.00010.00010.010.01159090990.90.4Results and DiscussionFigure 9 and 10 show the results of OpenFOAM andFluent simulations. The red color in Figure 9 designatespure solids, whereas the blue color means no solids (i.e.gas only). Colors in between blue and red indicate areaswhere both phases are present. Both the Fluent andOpenFOAM simulation results match fairly well theoutlined slipping mode flow pattern shown in Figure 3.Figure 10. Slipping mode velocity vectors (left:OpenFOAM gas and particle velocities, right: Fluentparticle velocities).Figure 9. Slipping mode solids fraction (left:OpenFOAM, right: Fluent). Red 100 % solids,Blue 0 % solids.Figure 11 and 12 shows a comparison of theOpenFOAM and the Fluent flow patterns for theslumping mode (Figure 4), which appear after anincrease in filling degree from 10 to 35 %. In Figure 11,the particle bed at an elevated point is shown. It is hardto capture the exact point at which the particle bedcollapses.The OpenFOAM velocity vectors (Figure 10, left)show both the gas phase and the particle phase, whilethe Fluent velocity vectors (Figure 10, right) only showthe particle phase (this is due to different features of thegraphics processing procedures in the two softwarepackages). The velocity vectors are qualitatively inagreement with results from previous studies [6, 12].Figure 11. The slumping mode solids fraction (left:OpenFOAM, right: Fluent).The velocity vectors are shown in Figure 12.According to the figure, the particles at the bottom movein parallel with the cylindrical wall, and the top of thebed has a backward-directed velocity. Moreover, thevelocity at the top of the bed is higher than the bottomvelocity. Both simulation software is capable ofproducing results in agreement with the theory.DOI: 10.3384/ecp17138137Proceedings of the 58th SIMSSeptember 25th - 27th, Reykjavik, Iceland140
the rotational speed at 6.67 rpm) and is in line with thesketch of the pattern shown in Figure 6.Figure 12. Slumping mode velocity vectors (left:OpenFOAM gas and particle velocities, right: Fluentparticle velocities)Figure 13 and 14 shows the rolling mode (Figure 5)results that appear after increasing the rotational speedby a factor of 10 (from 0.67 to 6.67 rpm) and reducingthe filling degree slightly (from 35 to 20 %). Thecharacteristics of this mode are observed both inOpenFOAM and Fluent.Figure 15. The cascading mode solids fraction (left:OpenFOAM, right: Fluent).According to Figure 15, the particles accumulatemore heavily on the elevated side. The particle elevationin this mode is higher than in the rolling mode.Velocity vectors are plotted in Figure 16, andsimilarities can be observed. The particle velocity at thesurface is higher in this mode, as the particle elevationis higher than the rolling mode.Figure 13. Rolling mode solids fraction (left:OpenFOAM right: Fluent).The velocity vector plots in Figure 14 match eachother quite well, even if the different graphicsprocessing procedures makes the gas phase visible inOpenFOAM, but not in Fluent. The bottom particlemovement and the surface particle movement are bothvisible from the plot, and the velocity vectors are also inline with previous studies [6, 17].Figure 16. Cascading mode velocity vectors (left:OpenFOAM gas and particle velocities, right: Fluentparticle velocities).An increase in rotational speed by a factor of 10 (from6.67 to 66.7) causes the cataracting mode (Figure 7) toappear when the filling degree is kept at 45 %, seeFigure 17 and 18.Figure 17 illustrates that both OpenFOAM and Fluentsimulation results show particle showering down,creating a circular type of motion. The OpenFOAMcontours appear to be particularly illustrative in thisrespect.Figure 14. Rolling mode velocity vectors (left:OpenFOAM gas and particle velocities, right: Fluentparticle velocities).The cascading mode flow pattern is observed inFigure 15 and 16. This mode was reached by increasingthe filling degree from 20 to 45 % (while maintainingDOI: 10.3384/ecp17138137Proceedings of the 58th SIMSSeptember 25th - 27th, Reykjavik, Iceland141
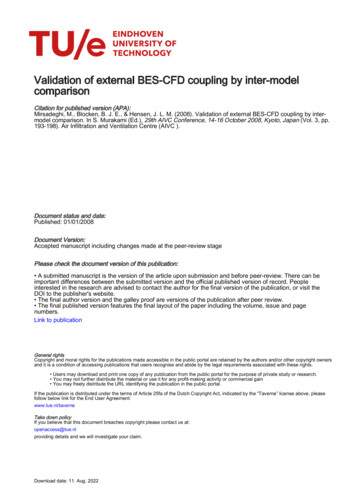
Figure 17. Cataracting mode solids fraction (left:OpenFOAM, right: Fluent).The velocity vectors in Figure 18 match each otherquite closely and also correspond well with resultsreported by Finnie, et al. [17].Figure 18. Cataracting mode velocity vectors (Left:OpenFOAM gas and particle velocities, right: Fluentparticle velocities).Finally, when the rotational speed is increased evenmore (from 66.7 to 150 rpm) while keeping the degreeof filling unchanged (45 %), the particle bed reaches thecentrifugal mode (Figure 8).Both simulation software shows similar behavior forthe solids fraction given in Figure 19.Figure 20. Centrifuging mode velocity vectors (left:OpenFOAM gas and particle velocities, right: Fluentparticle velocities).Also the velocity vector plots in Figure 20 show aclose match with each other. The particle velocity at thewall has the highest velocity, and this is more or lessequal to the cylindrical wall velocity.The flow pattern development in both software for aparticular case is shown in Figure 21 and Figure 22. Thecentrifugal mode was selected in this demonstration asit shows significant differences with time. Images werecaptured at 0, 0.1, 0.2, 0.3, 0.4 𝑠.The flow development over time is very comparablein OpenFOAM and Fluent. At the very beginning,particles are gathered at the bottom of the cylinder at thesame filling degree. As time proceeds, the particlesmove with the cylindrical wall, and after 0.4 𝑠, a moreor less circular flow pattern is observed in both Fluentand OpenFOAM results.It should be mentioned that the OpenFOAMsimulations converged faster than the Fluentsimulations, which can be a decisive factor whenselecting what software to use. As an example,OpenFOAM converges to the solution within a day forthe rolling mode, whereas the Fluent simulation takesabout a week. Moreover, as the OpenFOAM is an opensource software, the scripts are easily adjustable andeasily manipulated by users. Contrary, the Fluent is acommercial software and the user has no access to theoriginal scripts. The graphical interface in OpenFOAMis also very user-friendly.Figure 19. Centrifuging mode solids fraction (left:OpenFOAM right: Fluent).Figure 21. Flow pattern development over time (OpenFOAM); elapsed time from left to right: 0, 0.1, 0.2, 0.3 and 0.4 s.DOI: 10.3384/ecp17138137Proceedings of the 58th SIMSSeptember 25th - 27th, Reykjavik, Iceland142
Figure 22. Flow pattern development over time (Fluent); elapsed time from left to right: 0, 0.1, 0.2, 0.3 and 0.4 s.[8]5ConclusionBased on simulations executed with OpenFOAM andFluent, applying the same approach and the same dragmodels, it can be concluded that two software packagesproduce very similar results. The simulated results alsoagreed well with flow patterns described in theliterature. Hence, for a particular particle diameter,different flow regimes in an RC can be mapped in adiagram of filling degree vs. Froude number (which inturn depends on the rotational speed and the cylinderdiameter).OpenFOAM appears to be faster in producing thesame results, and the interface is user-friendly.However, the two simulation softwares have differentgraphics processing procedures, which makes it difficultto generate plots that are directly comparable.Based on the study it can be concluded that the EulerEuler approach can be successfully utilized in particlegas phase simulations and that both software platformscan be used for this [4][5][6][7]A. A. Boateng, "4 - Granular Flows in Rotary Kilns,"in Rotary Kilns, ed Burlington: ButterworthHeinemann, 2008, pp. 59-100.V. Romero, "Numerical Modelling of Granular Beds inRotary Kilns," Master of Science in ComputerSimulations for Science and Engineering Faculty ofElectrical Engineering, Mathematics and ComputerScience, Delft University of Technology, 2012.Y. L. Ding, J. P. K. Seville, R. Forster, and D. J. Parker,"Solids motion in rolling mode rotating drums operatedat low to medium rotational speeds," ChemicalEngineering Science, vol. 56, pp. 1769-1780, 3// 2001.K. S. Mujumdar and V. V. Ranade, "Simulation ofRotary Cement Kilns Using a One-DimensionalModel," Chemical Engineering Research and Design,vol. 84, pp. 165-177, 3// 2006.A. R. Nielsen, R. W. Aniol, M. B. Larsen, P. Glarborg,and K. Dam-Johansen, "Mixing large and smallparticles in a pilot scale rotary kiln," PowderTechnology, vol. 210, pp. 273-280, 7/10/ 2011.Y. Demagh, H. Ben Moussa, M. Lachi, S. Noui, and L.Bordja, "Surface particle motions in rotating cylinders:Validation and similarity for an industrial scale kiln,"Powder Technology, vol. 224, pp. 260-272, 7// 2012.M. D. Heydenrych, "Modeling of Rotary Kilns,"Doctor of philosophy University of Twente, 2011.DOI: 10.3384/ecp17138137[15][16][17]S. Karunarathna, "Investigation of Mixing andSegregation of Solids in a Rotary Kiln by CFDSimulations," Masters in Process TechnologyDepartment of Process, Energy and EnvironmentalTechnology University College of Southeast NorwayH. Arastoopour, "Numerical simulation andexperimental analysis of gas/solid flow systems: 1999Fluor-Daniel Plenary lecture," Powder Technology,vol. 119, pp. 59-67, 9/24/ 2001.S. Benyahia, H. Arastoopour, T. M. Knowlton, and H.Massah, "Simulation of particles and gas flow behaviorin the riser section of a circulating fluidized bed usingthe kinetic theory approach for the particulate phase,"Powder Technology, vol. 112, pp. 24-33, 10/5/ 2000.Q. J. Zheng and A. B. Yu, "Modelling the granular flowin a rotating drum by the Eulerian finite elementmethod," Powder Technology, vol. 286, pp. 361-370,12// 2015.H. Yin, M. Zhang, and H. Liu, "Numerical simulationof three-dimensional unsteady granular flows in rotarykiln," Powder Technology, vol. 253, pp. 138-145, 2//2014.G. R. Woodle and J. M. Munro, "Particle motion andmixing in a rotary kiln," Powder Technology, vol. 76,pp. 241-245, 1993/09/01 1993.N. Barman and L. S. Badwaik, "Effect of ultrasoundand centrifugal force on carambola (Averrhoacarambola L.) slices during osmotic dehydration,"Ultrasonics Sonochemistry, vol. 34, pp. 37-44, 1//2017.H. K. Versteeg and W. Malalasekera, An Introductionto Computational Fluid Dynamics, 2nd edition ed.:Pearson Education Limited, 2007.S. Karunarathna, C. Jayarathna, and L. A. Tokheim,"Impact of Particle Diameter, Particle Density andDegree of Filling on the Flow Behavior of SolidParticle Mixtures in a Rotating Drum," in The 9thEurosim Congress on Modelling and Simulation, Oulu,Finland, 2016, pp. 955-960.G. J. Finnie, N. P. Kruyt, M. Ye, C. Zeilstra, and J. A.M. Kuipers, "Longitudinal and transverse mixing inrotary kilns: A discrete element method approach,"Chemical Engineering Science, vol. 60, pp. 4083-4091,8// 2005.Proceedings of the 58th SIMSSeptember 25th - 27th, Reykjavik, Iceland143
OpenFOAM is an open source CFD toolbox that can be downloaded and used free of charge1. The OpenFOAM solver "twoPhaseEulerFoam" can be used to model incompressible fluid phases, such as one particle phases and one gas phase. This approach applies the Eulerian conservation equations for both the gas and .