Transcription
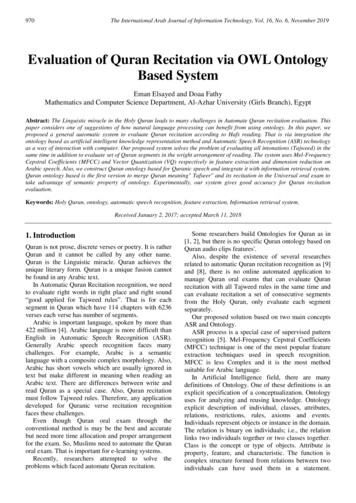
RECITATION NOTES FOR EXPERIMENT # 5 A&BTHIN LAYER CHROMATOGRAPHYHave your lab textbook available for quick reference to specific pages, indicated in red.BASIC PRINCIPLES OF CHROMATOGRAPHYChromatography is yet another technique for the analysis and separation of chemical mixtures. The technique isbased on a polarity interplay between the sample and two other substances called the solid (or stationary)phase, and the mobile phase, which can be a liquid or a gas. As their names indicate, the stationary phasedoes not move, whereas the mobile phase flows across, or through the solid phase.In this “love triangle,” the sample to be separated first becomes adsorbed onto the surface of the solid phasethrough polar interactions. More polar samples adhere (or bind) more strongly than less polar ones. The mobilephase then comes in and sweeps across the stationary phase, competing for the sample. If the mobile phase isa solvent, it is called the eluting solvent. The more polar the solvent, the greater its capacity to carry thecomponents of the mixture with it, “yanking” them away from the solid phase as it moves. Different componentswith different polarities will travel at different rates as the solvent moves, causing their separation.1.1.InitialInitialstate.state: SampleSample isishered ontoonthe solidphasephase.adadsorbedthe solid2.Eluting2. Elutingsolventsolventbeginsbegins totoflowthroughthe solidflowthroughthe phase.solid phase.sample mixturestationary phase,or solid support3.3.AsAsthethesolventmoves,the thesolventmoves,componentsthe mixturemixturecomponents ofof themoveatdifferentrates.move at different rates.the less polar componenttravels faster.eluting solvent the more polar componentthemoreslower.polar componenttravelstravels slower.Some of the most common solid adsorbents used as stationary phases in chromatography are listed in table19.1, p. 760. In the organic chemistry lab the most commonly used are silica gel and alumina due to theirversatile polarity range. Likewise, some common eluting solvents are listed in table 19.2, p. 761 by order ofincreasing polarity, and therefore increasing eluting power. Methylene chloride, ethyl acetate, and ethanolare among the most commonly used.Table 19.3, p. 762, lists some functional groups by order of elution, meaning how fast they move in achromatographic separation. Again, the more polar ones (alcohols, amines, and acids) move slower, whereasthe less polar ones (hydrocarbons and ethers) move faster.THIN LAYER CHROMATOGRAPHY (TLC)In thin layer chromatography the solid phase (silica gel or alumina) is applied as a thin coating on a plastic sheetor glass slide, called a TLC plate (fig. 20.4, p. 783). Using a capillary tube, a solution of the sample is applied onthe solid support as a spot, a technique known as spotting. When the sample dries it becomes adsorbed ontothe solid support. This process can be repeated several times to produce a more concentrated spot.
SPOTTING TECHNIQUE1. Throughout these operations, keep in mind that the coating on the TLC plate is very fragile and easilychips. Plates must be handled with care.2. Using a pencil, not ink, draw a horizontal line about 1 cm from the bottom of the TLC plate to markthe starting point of the sample for elution. Do not apply too much pressure, or you will break thecoating. The sample spots are to be applied on this horizontal line.3. Dip the tip of a capillary micropipette in a solution of the sample to be analyzed. Capillary action willcause the liquid to rise up the pipette.4. Lightly touch the solid support with the tip of the micropipette as if using a fountain pen. A small amountof solution will transfer to the plate forming a spot. As with a real pen, the longer you leave the pipette incontact with the plate the bigger the spot. We don’t want big spots, therefore just “peck” the coating andwithdraw the pipette.5. Wait until the spot dries before applying the next one, which should be done on exactly the same place.With most solutions, 3 or 4 applications of the same solution should suffice to produce a good spot. Aspot that’s too dense or too big can cause problems during the separation.6. If you are applying several different samples on the same plate, make sure their spots do not toucheach other. Adjacent spots must be separated by a minimum distance of 0.5 cm, or they’ll run into eachother during the separation.7. Likewise, spots must not be too close to the edge of the plate, or they can run off the plate duringseparation. Again, spots should be separated from the edges by a minimum of 0.5 cm, except for thebottom of the plate, in which case they should be separated by a minimum of 1 cm. The reason is thatthe plate will be immersed in the eluting solvent to effect the separation, and the eluting solvent shouldnot touch the spots when the separation begins.THE DEVELOPING CHAMBERWhile the spots are being applied and allowed to dry, prepare a developing chamber for the separation (that’sa fancy name for a beaker or jar that’s slightly taller than the TLC plate). Refer to fig. 20.5 on p. 784.To do this take a clear container and place a small amount of eluting solvent inside, just about enough tocover the bottom. You can also take a piece of filter paper whose diameter is about the height of the containerand place it around the walls. Squirt some of the eluting solvent on the filter paper to make it wet so that itadheres to the walls better. This keeps the space inside the container saturated with solvent vapors to minimizeloses by evaporation and improve the separation. Also have a lid or watch glass ready to cover the containerduring the separation.ELUTION TECHNIQUEOnce the TLC plate has been spotted and ready to go, carefully place it inside the developing chamber, tryingto avoid splashing. Remember, we don’t want the solvent to touch the spots before we start the separation. If itdoes, it will cause the spots to smear and they’ll become useless.The plate should be placed upright, slightly inclined against the wall of the container. The solvent should nottouch the spots when the separation first begins, that’s why its level should be below the spots by at least 0.5cm. Cover the container and wait for elution to proceed.By capillary action, the solvent will immediately start rising up the TLC plate. As soon as it comes into contactwith the spots, it will cause the less polar components of the mixture to start moving. The more polarcomponents will also move, but at a less noticeable rate. The following diagram illustrates the process.
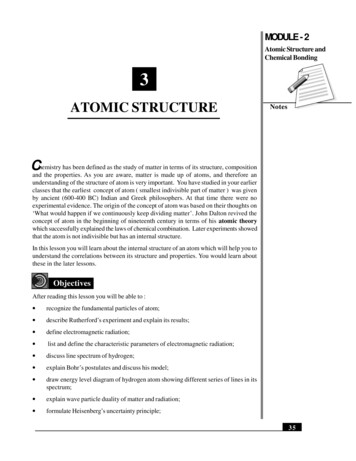
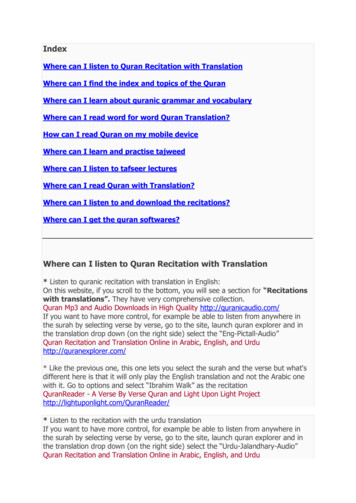
PART A – Separating the components of a mixture using a given solvent.solvent frontsolvent front1 cmInitialTLCInitialTLCplateplatewith withspot spotpencil lineinitial spotTLC plate inside thedeveloping chambersolvent levelAs the solvent movesup, it will cause thespot to move as wellgoodsolventsolventcauses goodAAgoodcausesseparationof thegood separationof themixturecomponentscomponentsof the mixture.When the plate is first placed inside the developing chamber, its bottom should be as parallel as possible withthe solvent level. If the plate enters the solvent at an angle, it will cause a slanted solvent front line which mayresult in poor separation and uneven alignment of the spots.When the solvent front is about 0.5 to 1 cm from reaching the top, it’s time to stop the elution. Do not allow thesolvent front to reach the top of the plate. That may cause erroneous Rf values and may cause spots that areclose together to run into each other. Take the plate out with tweezers and mark the solvent front line with apencil as soon as possible. If you wait too long, it will fade and you will miss a crucial part of information neededto calculate the Rf values.If a poor separation is obtained with a certain solvent, the experiment needs to be repeated with a solvent ofdifferent polarity. As with crystallization, solvent mixtures can be used to achieve intermediate degrees ofpolarity. Low polarity solvents will cause the spots to move more slowly. High polarity solvents will do theopposite. Either extreme can cause poor separation. Only practice will enable you to gain a sense of how toreach a “happy medium.”PART B – Finding the solvent that provides the best separation.A low polarity solvent maymove the spots too slowlyfor a good separationA solvent of intermediatepolarity produces the bestresultsA solvent that’s too polarmay move the spots toofast for a good separation
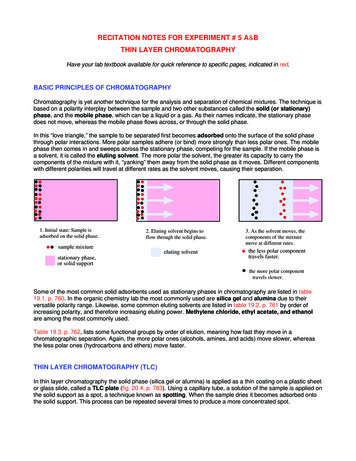
VISUALIZATION TECHNIQUESAfter taking the TLC plate out of the developing chamber and marking the solvent front line, allow the plate todry. Drying can be accelerated by placing the TLC plate on a lukewarm surface. Remember, the plate is madeof plastic, if the plate is too hot the plastic will melt. Once the plate is dry, you need to be able to see thespots. Unless your sample is colored, this is not always possible with the naked eye. Visualization techniquesare methods that enable you to see otherwise “invisible” spots. There are several methods available, but the twomost commonly used in the organic lab are iodine staining, and use of a UV lamp.Iodine reacts with many organic substances to produce compounds which are brownish. Place the TLC plateinside an iodine chamber (again, a fancy name for a jar that contains a few iodine crystals). Close the jar, andwithin a few minutes spots will appear on the plate. This process can be accelerated by placing the chamber ona warm surface. Once you can see the spots, take the TLC plate out of the chamber with tweezers or wearinggloves (iodine is a toxic substance, and so are its vapors). Mark the spots with a pencil.Most commercial TLC plates contain not only the solid phase coating, but also a fluorescent substance that issensitive to ultraviolet (UV) light. By shining UV light with a special lamp on the plate, the coating will appeargreenish. If there are spots or other substances blocking the light, they will appear blackish. This will enable youto mark the places where the spots are with a pencil.Since iodine vapors are toxic, only the UV lamp will be used in the lab.CALCULATING Rf VALUESThe scientific measure of the chromatographic separation in TLC is the Rf value, variously interpreted indifferent sources as retardation factor, ratio to the front, etc. (see p. 788). It is given by the expressiondistance traveled by the spotRf distance traveled by the solvent frontSee fig. 20.8 on p. 788 for an example. Some spots are somewhat large, while others “tail.” Tailing tends tooccur with ionic or highly polar substances that are reluctant to move because they bind too strongly to the solidphase. When this happens the center of mass of the spot is used to measure the distance traveled by the spot.The reaction with iodine as a visualization method is particularly good at revealing the densest part of the spot.center of massdistance traveledby the spot]tailingBy definition, Rf values are always less than 1. An Rf value of 1 or too close to it means that the spot and thesolvent front travel close together and is therefore unreliable. This happens when the eluting solvent is too polarfor the sample. Another run must be made using a less polar solvent to improve the separation.Likewise, if the spot hardly moves and its traveled distance is nearly zero, there has probably been no chancefor separation. This happens when the eluting solvent is not polar enough for the sample. Another run must bemade using a more polar solvent to improve the separation.
RELATIONSHIP BETWEEN Rf VALUE AND POLARITY OF THE SAMPLEIt was mentioned before that the polarity of the sample and its rate of movement are inversely related. The morepolar spot travels slower, and the less polar spot travels faster. Rf values, on the other hand, are directly relatedto the rate of movement. The fastest moving spot has the highest Rf value.Therefore Rf values and polarity are inversely related. The spot with the highest Rf value is the leastpolar (fastest moving), and the spot with the lowest Rf value is the most polar (slowest moving).USES OF Rf VALUES IN TLCRf values are frequently used to compare a known and an unknown substance to determine if they are thesame. As long as their spots are run simultaneously on the same plate, the argument can be made that iftheir Rf values are the same, and if the general appearance of the spots is the same, then they are the samecompound.Rf values depend on: The polar nature of the solvent usedPolar nature of the stationary phasePolar nature of the sampleConditions of the experimentRf values are therefore not exactly reproducible from one experiment to another, even if an effort is made tocarry them under the exact same conditions. When comparing two or more substances, they must be runsimultaneously on the same plate or the comparison is invalid.
EXPERIMENT 5: INSTRUCTIONS FOR PART B.Although the lab textbook proposes several compounds and solvents that you can use in part B, we will use onlytwo substances and three solvents. The two substances are benzoin and benzil. The solvents are hexane(nonpolar), methylene chloride (moderate polarity), and acetone (polar). Therefore, you will spot threesolutions onto each of three TLC plates:a. Benzoin only solutionb. Benzil only solutionc. Benzoin and benzil solution1. PREPARE THREE TLC PLATES. Spot each plate with the above solutions, as follows:benzoinbenzilbenzoin benzil2. DEVELOP THE 3 PLATES AS FOLLOWS: Plate 1 in hexanesPlate 2 in methylene chloridePlate 3 in acetone.3. CALCULATE Rf VALUES for the spots in the three plates.4. REPORT RESULTS explaining which solvent effected the best separation of the benzoin-benzil mixture (thirdspot), and why, based on polarity of the substances and the solvents used.The chemical structures of benzoin and benzil are given on p. 309 of the lab textbook, under Exp. 36B.
phase. When this happens the center of mass of the spot is used to measure the distance traveled by the spot. The reaction with iodine as a visualization method is particularly good at revealing the densest part of the spot. ] tailing center of mass distance traveled by the spot By definition, R f values are always less than 1. An R f