Transcription
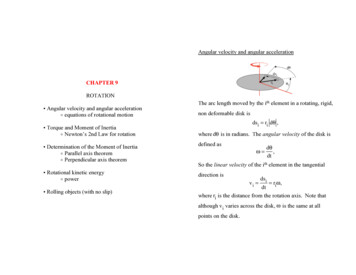
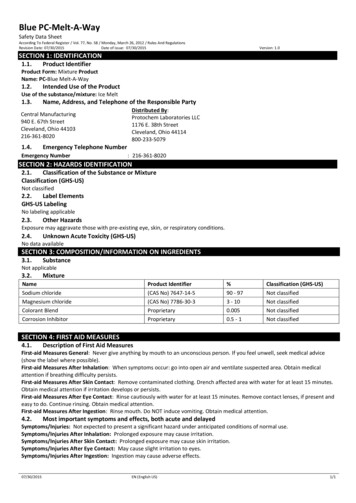
Surface Melt-Induced Acceleration of Greenland Ice-Sheet FlowH. Jay Zwally,1* Waleed Abdalati,2 Tom Herring,3 Kristine Larson,4 Jack Saba,5 Konrad Steffen6Ice flow at a location in the equilibrium zone of the west-central Greenland Ice Sheet accelerates abovethe midwinter average rate during periods of summer melting. The near coincidence of the iceacceleration with the duration of surface melting, followed by deceleration after the melting ceases,indicates that glacial sliding is enhanced by rapid migration of surface meltwater to the ice-bedrockinterface. Interannual variations in the ice acceleration are correlated with variations in the intensity ofthe surface melting, with larger increases accompanying higher amounts of summer melting. Theindicated coupling between surface melting and ice-sheet flow provides a mechanism for rapid, largescale, dynamic responses of ice sheets to climate warming.1Oceans and Ice Branch, Code 971, NASA Goddard Space Flight Center, Greenbelt, MD 20771, USA.Code YS, NASA Headquarters, 300 E Street, SW, Washington, DC 20546, USA.3Department of Earth, Atmospheric, and Planetary Sciences, MIT Room 54-618, 77 MassachusettsAvenue, Cambridge, MA 02139, USA.4Department of Aerospace Engineering Sciences, University of Colorado, Boulder, CO 80309, USA.5Raytheon Inc., Code 971, NASA Goddard Space Flight Center, Greenbelt, MD 20771, USA.6CIRES, University of Colorado, CB 216, Boulder, CO 80309, USA.*To whom correspondence should be addressed. E-mail: jay.zwally@gsfc.nasa.gov2The time scale for dynamic responses of ice sheets to changes in climate (e.g., snow accumulation andsurface temperature) is typically considered to be hundreds to thousands of years (1). Because most icesheet motion occurs by ice deformation in the lower layers, basal sliding, or deformation in basal till, theeffects of changes in surface climate must be transmitted deep into the ice to affect the ice flowmarkedly. In particular, changes in the surface-mass balance alter the ice thickness slowly, and thereforethe driving stresses in the deforming layers, as thickness changes accumulate. Changes in surfacetemperature can also affect the rate of ice deformation or basal sliding, but only after the very slowconduction of heat to the lower layers (2). In contrast to the flow of grounded ice, both floating glaciertongues (3) and Antarctic ice shelves (4) respond quickly to changes in basal heat fluxes and melting, aswell as to the effects of surface meltwater trapping in crevasses. Although the transfer of surfacemeltwater to the base of a grounded ice sheet can provide a rapid mechanism for transferring heat andlubricating fluid to the bottom, this mechanism has not been given much consideration in studies of icesheet dynamics. In particular, the Greenland Ice Sheet is grounded above sea level and is generallybelieved to respond gradually to climate warming (5, 6), mainly by melting at the surface.Increases in ice velocity occur in alpine glaciers during periods of surface melt in summer (7-9) and havealso been observed in Greenland outlet glaciers (10-12). For example, Bindschadler et al. (8) measured avelocity increase from 10 cm/day in winter to 12 cm/day in summer in the Variegated Glacier, a surgetype glacier in Alaska. However, short-term velocity variations have not been observed in the flow of icesheets away from ice streams and outlet glaciers. Even inland of the fast-flowing Jakobshavn Isbrae inwest-central Greenland, seasonal variations were not found (13).Velocity and Melt ObservationsTo examine the possibility of seasonal or interannual changes in ice-sheet flow, we initiated year-roundglobal positioning system (GPS) measurements at the Swiss Camp (14, 15) at 1175 m (69.57 N,49.31 W) near the equilibrium line (16) in west-central Greenland in June 1996 (Fig. 1). The camp isabout 35 km from the ice edge and about 510 km downstream from the ice divide. Characteristic
glaciological features of the region are illustrated in Fig. 2. The ice thickness at the camp is 1220 m (17),and a numerical thermodynamic-dynamic ice model suggests that the basal temperature is at thepressure-melting point (PMP) of -1.0 C (18). The horizontal ice velocity is nearly constant from thesurface to the lower boundary layer, where ice shearing occurs. For basal ice at the PMP, part of thesurface velocity is typically from ice sliding at the base, but the magnitude of sliding is difficult toestimate without borehole measurements (19).Fig. 1. Elevation contours (50 m) on a Landsat Thematic Mapper image (channel 3) taken on 22 June1990, which is typically about one-third of the way through the melt season. Locations of the SwissCamp and the Automated Weather Station at JAR-1 and JAR-2 are marked. The indicated flowlinedirection of 235 E at the camp curves westward toward the grounded ice edge. The grayer areas at lowerelevations in the image are bare ice, with some whiter patches of remaining winter snow near the icesnow line. By the end of the melt season in late August to early September, the firn-ice boundary usuallyretreats to around the average location of the equilibrium line (15) near the Swiss Camp. The darkpatches are melt lakes, some of which show dark lines of inflow channels. Later in the season, meltlakes also form above the equilibrium line. Jacobshavn Isbrae is in the lower part.
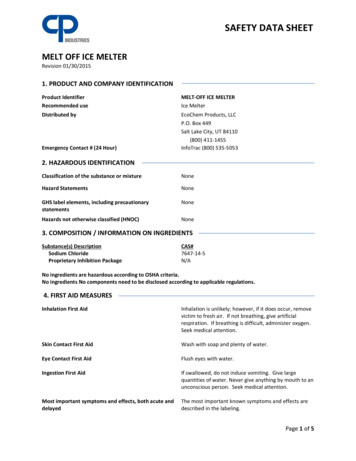
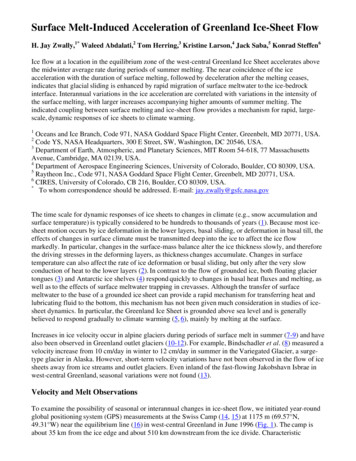
Fig. 2. Schematic of glaciological features in the equilibrium and ablation zones, including surfacelakes, inflow channels, crevasses, and moulins. Ice flow for basal ice at the pressure melting point ispartly from basal sliding and partly from shear deformation, which is mostly in a near-basal boundarylayer.Our ice velocities are derived from GPS-measured positions of a 4-m pole embedded 2 m in the icebeginning in June 1996 (20). The receiver recorded automatically for 12-hour periods at intervals of10 or 15 days (21). GPS data were analyzed using GAMIT and GLOBK software (22). To examinechanges in ice velocity with respect to the direction of ice flow, a smoothed line of motion was derivedas a function of time. The time series of north and east positions [N(t), E(t)] were each fitted to parabolasas a function of time (t). The direction of motion was computed from the derivatives (dN/dE dN/dt/dE/dt) and is approximately a linear function of time. The derived direction of motion is toward thesouthwest at an azimuth of 234.963 E on 1 January 1997 and curving toward the west at the rate of0.106 /year. Although most of the motion is along-track, systematic cross-track displacements up toabout 20 cm occur annually, as discussed below.Figure 3 shows the horizontal along-track velocity from June 1996 through mid-November 1999. Datafrom periods during the winter months with little or no change in velocity were used to compute aconstant base velocity of 31.33 0.02 cm/day (23). In 1996, the velocity increased slightly from thewinter value to a maximum of 32.8 cm/day on August 9, and then returned to the winter value. A smalltemporary increase to 32.8 cm/day also occurred in March of 1997. In subsequent summers, the velocityincreased markedly to a maximum of 35.1 cm/day around 9 August 1997, of 40.1 cm/day around 10 July1998, and of 38.6 cm/day around 30 July 1999. After these periods of accelerating flow, the velocitydecreased markedly to a minimum of 28.9 cm/day around 18 September 1997, of 29.8 cm/day around19 August 1998, and of the lowest value of 27.6 cm/day around 29 August 1999. After the velocityminima, the ice slowly accelerated again over several fall months to return to the midwinter values.
Figure 3. (A) Horizontal ice velocity (red curve) along a smoothed line of motion showing iceaccelerations during the summer melt seasons and the abrupt transitions to deceleration around the timesof melt cessation. The cumulative additional motion (horizontal residual, black) relative to a wintertimeaverage velocity of 31.33 cm/day is 6.0 m by the time of the maximum velocity in 1999. (B) Thevertical residual (blue) indicates a 50-cm uplift at the time of the 1997 transition from accelerating flowto decelerating flow. (C) Cumulative PDDs and PDDs for 10-day intervals (10d DD, red) fromtemperatures measured at the Swiss Camp, showing correlations of the melting with the intensity andtiming of the ice accelerations and decelerations (units are degree-days). Vertical dotted lines mark May1, July 1, and September 1 for each year.The cumulative additional motion (Fig. 3) caused by the summer accelerations was computed as thedifference between the measured positions and the calculated along-track positions that would haveoccurred under a constant velocity of 31.33 cm/day. At the transition from accelerating flow todecelerating flow in early September 1997, the ice had moved an additional 3.0 m relative to the baselinerate. At the 1998 and 1999 transitions, the respective net additional displacements were 4.7 m and 6.0 m.During periods of slower flow in the fall, after the transitions, the additional displacement was reducedby about 45 to 65% (24).From a 21-year record of Greenland surface melting from passive microwave data, the summer of1996 was the second-lowest melt year since 1979, the summer of 1997 was slightly below the 21-yearaverage, and the summers of 1998 and 1999 were well above average (25). We investigated relationshipsbetween the availability of summer meltwater for basal lubrication and changes in the ice velocity usingthe cumulative positive degree-days (PDDs) (26) at the camp, as shown in Fig. 3C. For the foursummers (1996 to 1999), the respective total PDDs were 47.6, 60.8, 116.5, and 94.7. The correspondingmean areas of melt from June through September in the Jacobshavn region from passive microwave datawere 28.2, 52.0, 79.6, and 74.5 103 km2, which show similar year-to-year variations as the PDDs (27).The quality of PDDs as an indicator of ablation and consequent meltwater production was shown by
Braithwaite and Olesen (28), who obtained a 0.96 correlation coefficient between annual ice ablation andPDDs, even though variations in radiation and other energy-balance factors such as wind speed alsoaffect the rate of ice ablation (29).Correlations Between Acceleration and Surface MeltingIn all years, correlations are evident between the changes in ice velocity and both the intensities andtimings of surface melting. For the summers of 1998 and 1999, the respective ratios of the increases invelocity of 8.8 and 7.3 cm/day to the PDDs of 116.5 and 94.7 are nearly the same (0.076 and 0.077),whereas the ratios in 1996 and 1997 are somewhat smaller (0.032 and 0.063). For the summer of1999, the melting period was shorter in duration, but of greater intensity in the month of July than in theother summers.Although melting downstream of the equilibrium line begins a few days to several weeks earlier than atthe camp, comparison of the timing of the acceleration and melting is based on the melt record at thecamp (30). Although some melting usually occurs in May, more-continuous melting does not usuallybegin until the beginning of June. In 1997, the onsets of ice acceleration and melting were nearlysimultaneous in mid-June. In 1998, the acceleration onset (also in mid-June) lagged the melting onset byabout 2 weeks. In 1999, although a small temporary increase in velocity appeared in May, the major iceacceleration and the melting onset were both delayed until the beginning of July. Correlations betweenthe timing of the transitions from acceleration to deceleration and the cessations of melting were alsogood, particularly in 1997 and 1999 when the respective transitions at the beginning of September andmid-August were nearly coincident with the end of melting. In 1998, some melting continued after thetransition in early August. In 1996, the year of minimal acceleration, the ice accelerated in July and earlyAugust until the end of a period of minimal melting in late August when the transition to decelerationoccurred.Acceleration MechanismIn the ablation zone of Greenland, surface meltwater runs along the surface and collects in surface lakesor flows directly into moulins (Fig. 2). Although the internal or subglacial pathways for transit of themeltwater to the margins are generally not known, Thomsen et al. (29) assumed that water flowing intomoulins quickly flows to the bottom and drains subglacially. Whether the drainage pathways tend to bevertical and channel meltwater to the base of the ice sheet, or tend to be horizontal and remain englacial,markedly affects the local availability of water for basal lubrication. One indication that the water flow islargely subglacial, at least near the margins, is that the meltwater primarily leaves the ice sheet insubglacial streams, and not in surface flow over the ice edges. Theoretically, water-filled crevasses areexpected to propagate to the bottom due to the over-burden pressure of water, as compared to ice (31),and could provide numerous pathways for meltwater drainage throughout the ablation zone and for theinitiation of moulins. Mapping of moulins and surface lakes (29) in the ablation zone below the campshows that the areal density of moulins is about 0.2 moulins/km2 and most moulins are not associatedwith the less-numerous surface lakes.Therefore, flow of meltwater through moulins, and perhaps through the numerous crevasses throughoutthe ablation zone, is likely to provide a widespread and continual drainage from the surface to the icebase during the melt season. The surface lakes usually drain during summer, but their drainage tends tobe episodic, depending on the irregular timing of the opening of drainage channels from the lakes (15,32). We believe that the observed correlations between the changes in ice velocity and the timing andintensity of the surface melting show that there is widespread and continual drainage of meltwater fromthe surface to the ice-sheet base during summer ablation. Because the ice base is at the PMP (18), a wetbase maintained by basal melting is expected to be a normal condition throughout the year. Water may
be maintained during winter in subglacial conduits that expand during periods of increased waterpressure and accelerated flow (33). The probable cause of the summer acceleration is an increase in thewater pressure at the bedrock interface, which is a well-known mechanism for velocity variations inalpine glaciers. For example, Iken et al. (33) found that the summer increase in subglacial water pressureactually raised the glacier by as much as 0.6 m and partially decoupled the ice from the bed. Thehorizontal velocity increased by three to six times and was largest at times of maximum upward velocity.The magnitude of the acceleration at the Swiss Camp was small in the low-melt year of 1996 andincreased in later years as the melting increased. Apparently, more meltwater produces largeraccelerations, and the timings of melting and acceleration are closely related. The ice accelerationscommenced a few weeks after the onset of melting. Later, the transition from accelerating to deceleratingice flow occurred near the cessation or slowing of melting at the end of the melt season. The short timebetween melt onset and acceleration, as well as the close timing between the transition and the ending ofablation, suggests that storage of meltwater after production is not an important factor affecting theacceleration.The rapid ice deceleration after the peak velocity is reached could be associated with an increase in basalfriction and reduced basal sliding caused by changes at the ice-bedrock interface that occur during theperiod of increased water flow. As noted above, the ice decelerates to velocities about 10% below theaverage winter velocity before returning to the winter velocity in late fall. This suggests that the basalsliding gradually recovers to normal winter values. Presumably, the ice acceleration begins in the lowerelevations of the ablation zone, with changes in basal sliding, and propagates upstream past the SwissCamp as sliding increases. The process of deceleration is likely to be a combination of changes in basalsliding and the dynamic response of the ice to the changing patterns of driving stresses duringacceleration.In early September 1997, during the one GPS measurement period just at the transition fromaccelerating to decelerating flow, the vertical residuals show a 50-cm uplift of the ice sheet (Fig. 3A).Around the time of the 1998 and 1999 transitions, the excursions of the vertical position were 10 cm,which is on the order of other occasional excursions in the data throughout the year. The 50-cm uplift inthe 1997 data could be indicative of changes in the basal water pressure similar to that in small glaciers(34), or of dynamic effects in the ice occurring as the ice flow at the camp changes from accelerating todecelerating.Around the time of the maximum accelerations in 1997, 1998, and 1999, the direction of the ice motionchanged by about 1 to the right (more westward) over about 30 to 45 days, as shown by 15- to 20-cmcross-track displacements. The peak cross-track velocities are 0.5 to 1 cm/day to the right. After therightward displacement, an equal displacement to the left slowly occurs until the next summer. Thesechanges in direction are in addition to the 0.106 /year average rotation to the right of the smoothed lineof motion. The change in direction during the acceleration could be indicative of changes in the basalfriction and the ratio of the sliding velocity to the velocity from ice deformation.ConclusionsThe interaction among warmer summer temperatures, increased surface meltwater production, waterflow to the base, and increased basal sliding provides a mechanism for rapid response of the ice sheets toclimate change. In general, a direct coupling between increased surface melting and ice-sheet flow hasbeen given little or no consideration in estimates of ice-sheet response to climate change (35). In additionto the direct effect of increased water pressure on the basal sliding, the flow of surface water atapproximately 0 C to basal ice, at the PMP of -1.0 C, transfers heat for additional basal melting. Theoccurrence of this melt-driven acceleration in the equilibrium zone implies that the mechanism may be
occurring throughout much of the ablation zone of the ice sheet, or at least where the basal temperatureis at the PMP. Therefore, the rate of retreat of the ice-sheet margin under climate warming is probablyfaster than predicted by estimates based only on the direct increase in surface ablation (36). Enhancedbasal sliding from surface meltwater may have contributed to the rapid demise of the Laurentide IceSheet during increased summer insolation and surface ablation circa 10,000 years ago (37) and toextensive melting of the Greenland Ice Sheet during the last interglacial (38), by causing a faster flow ofice to the margins, an increase in the thinning rate, and more rapid inward migration of the ablation zone.REFERENCES AND NOTES1. R. B. Alley and I. M. Whillans, J. Geophys. Res. 89, 6487 (1984) [ISI].2. Another long-term dynamic-response mechanism is caused by variation in the dust impurities insnowfall that affects the ice hardness, so the upper layers of Holecene ice with lower dust content areharder than the lower layers of ice-age ice with higher dust content (39).3. E. Rignot, W. B. Krabill, S. P. Gogineni, I. Joughin, J. Geophys. Res. 106, 34007 (2001) [CrossRef].4. T. Scambos, C. Hulbe, M. Fahnestock, J. Bohlander, J. Glaciol. 46, 516 (2000) [ISI].5. C. Ritz, A. Fabre, A. Letreguilly, Clim. Dyn. 13, 11 (1997) .6. P. Huybrechts and J. de Wolde, J. Clim. 12, 2169 (1999) [CrossRef].7. A. Iken, Z. Gletscherkd. Glazialgeol. 13, 23 (1978) .8. R. Bindschadler, W. D. Harrison, C. F. Raymond, R. Crosson, J. Glaciol. 18, 181 (1977) .9. G. H. Gudmundsson, et al., Ann. Glaciol. 31, 63 (2000) .10. N. Reeh and O. B. Olesen (40) found summer velocity fluctuations of 15% on time scales of 2 to10 days in the Daugaard-Jensen Glacier, an outlet glacier on the east coast of Greenland. Also, anobserved 50% velocity increase for about 7.5 hours was inferred to be the result of a subglacialincrease in water pressure caused by the drainage of an ice-dammed lake.11. I. Joughin, S. Tulaczyk, M. Fahnestock, and R. Kwok (41) found a threefold velocity increase duringthe 1995 melt season in the Ryder outlet glacier in northwest Greenland, which they described as ashort-lived mini-surge.12. On Storstrommen Glacier in northeast Greenland, GPS-determined velocities for summer aregenerally greater than winter velocities and annual averages (42).13. K. Echelmeyer and W. D. Harrison, J. Glaciol. 36, 82 (1990) [ISI].14. K. Steffen and J. E. Box, J. Geophys. Res. 106, 33951 (2001) [CrossRef].15. A. Ohmura et al., ETH Greenland Expedition Progress Report No. 1 (Department of Geography,ETH, Zurich, Switzerland, 1991).16. The equilibrium line is defined as the boundary between annual net ice accumulation and netablation at the surface and is located at the upper elevation of bare ice (without refrozen firn orsuperimposed ice) at the end of the summer melt season. The empirical equation for the equilibriumline altitude (ELA) is a decreasing quadratic function of latitude (43) that gives an ELA of 1418 m atthe latitude of the Swiss Camp. The camp was established in 1990 at the nominal location of theequilibrium line, based on surface observations in previous years (29). It lies on a small ridge, andlocal variations in the altitude of the equilibrium zone range from around 1200 m at the camp to1400 m south of the camp.17. Measured by University of Kansas ice-penetrating radar. Data are available online athttp://tornado.rsl.ku.edu/1998thick.htm.18. W. L. Wang, H. J. Zwally, W. Abdalati, S. Luo, Ann. Glaciol., in press, using the measured icethickness of 1220 m. The modeled basal temperature is slightly below the PMP at the ice divide andis essentially at the PMP along a flowline from 400 km above the camp to the ice edge.
19. M. Luthi, M. Funk, A. Iken, S. Gogineni, M. Truffer, J. Glaciol., in press, obtained a ratio of basalsliding of 60% in the lateral shear zone of Jakobshavn Isbrae, but noted that such a high ratio isprobably not representative for the ice sheet.20. GPS data were recorded by a geodetic-quality dual-frequency Trimble 4000 SSi receiver (Trimble,Sunnyvale, CA), which is inside an insulated box in a camp tent and powered by four to six 100-a-hbatteries and two 18-W solar panels. The 2-m extension of the antenna above the ice keeps theantenna above the seasonal snow accumulation, which ranges from about 0.5 to 1.8 m interannually.Yearly data were downloaded when the camp was occupied each May. Data collection ended in thefall of 1999 because of anomalous behavior of the receiver.21. During the spring occupation of the Swiss Camp, data were usually recorded continuously instead ofonce every 10 to 15 days. To avoid large velocity errors for short time intervals, the followingposition data for multiple 12-hour time periods were averaged: 23 to 29 May 1998 (13 periods),23 to 28 May 1999 (10 periods), and 9 and 10 June 1999 (4 periods).22. R. W. King, Documentation of the GAMIT GPS Analysis Software Version 10.05 (2001); andT. A. Herring, Documentation of the GLOBK Software Version 5.1 (2001), MIT, Cambridge, MA.See also http://www-gpsg.mit.edu/ simon/gtgk. The Cartesian coordinates of the antenna werecalculated, relative to bedrock sites at Thule Air Force Base, Kellyville, and Kulusuk in Greenland,from 12-hour increments of data. The average standard deviations of the coordinates calculated withGLOBK is 1.2 cm horizontally and 3.3 cm vertically. The standard deviations of the north and eastcomponents of the positions are somewhat higher during the winter periods (e.g., the standarddeviation of the north component went from a base value of about 0.5 cm to a high of nearly 6 cmduring the winter of 1999). The large uncertainties occurred on days when only the bedrock site atThule was operating and when less than 12 hours of data were recorded at Swiss Camp. Timesassigned to the points are the midpoints of the times of the data increments. The overall averagestandard deviation of the horizontal velocity is 0.14 cm/day. Analysis techniques are also describedin (44).23. The horizontal velocity at markers 2.15 km downstream from Swiss Camp is 0.67 cm/day slowerthan at the camp. Therefore, as the camp moved from 1996 to 1999, the estimated decrease inhorizontal velocity was 0.036 cm/day/year, or 0.14 cm/day during the 4-year period.24. The respective advancements and reductions for 1997, 1998, and 1999 were: 1.8 and 0.8 m, 2.5 and1.6 m, and 2.9 and 1.9 m.25. W. Abdalati and K. Steffen, J. Geophys. Res. 106, 33983 (2001) [CrossRef].26.where Ti are hourly averaged near- suface air temperatures, i 1 if Ti 0, and i 0 if Ti 0.27. The year-to-year ratios of cumulative PDDs to melt areas (19) differ from unity by less than 19%.The Jacobshavn melt region is defined from about 65.5 to 76 N and from the western ice edge to thedivide. The respective cumulative melt-days obtained from passive microwave for the area near thecamp are 30, 60, 97, and 47. The year-to-year correspondence for the camp location is not as good(ratios differ from unity by up to 33%), probably because the passive-microwave index of melt daysrecords only the occurrence of surface melting, whereas the deg-days index registers more for warmdays (e.g., 5 times more for 5 C) than for days that are just above the melting point. In contrast, themelt-area index used for the Jacobshavn region is also sensitive to the intensity of melting, whichexpands the area of melting to higher elevations.28. R. J. Braithwaite, O. B. Olesen, in Glacier Fluctuations and Climate Change, J. Oerlemans, Ed.(Kluwer, Dordrecht, Netherlands, 1989), pp. 219-233.29. H. H. Thomsen, L. Thorning, R. J. Braithwaite, Glacier-Hydrological Conditions on the Inland IceNorth-East of Jakobshavn/Ilusissat, West Greenland: Report 138 (Gronlands Geologiske
Undersogelse, Copenhagen, Denmark, 1998).30. For example, data for 1997 through 1999 from the Automated Weather Station (AWS) (15) at JAR-1at a 960-m elevation and 16.3 km downstream from the camp show that the lag in melting onsetbetween the sites varies from only 1 to 14 days until about 30 deg-days are cumulated. The end ofmelting may occur even closer in time at different elevations in the ablation zone. In 1999 at least,the cessation was almost simultaneous at Swiss Camp, JAR-1, and JAR-2, which is at a 528-melevation and 17.1 km downstream from JAR-1.31. G. de Q. Robin, J. Glaciol. 13, 543 (1974) .32. At the JAR-1 AWS site, which was located near the side of a lake hundreds of meters in diameter,the sonic surface-height data show that the surface level dropped 1.5 m in a few hours on 17 July1996 as the water drained from the ice. A similar drop of 0.8 m occurred on 25 June 1997, when thestation had moved 70 m closer to the lake edge.33. A. Iken, H. Rothlisberger, A. Flotron, W. Haberli, J. Glaciol. 29, 28 (1983) .34. C. F. Raymond, J. Geophys. Res. 92, 9121 (1987) .35. J. T. Houghton et al., Eds., Climate Change 2001: The Scientific Basis (IPCC Report, Cambridge,UK, 2001).36. R. J. Braithwaite and O. B. Olesen, Ann. Glaciol. 14, 20 (1990) .37. P. U. Clark, R. B. Alley, D. Pollard, Science 286, 1103 (1999) [CrossRef] .38. R. M. Koerner, Science 244, 964 (1989) [Abstract/Free Full Text] .39. N. Reeh, Nature 317, 797 (1985) [CrossRef] .40. and O. B. Olesen, Ann. Glaciol. 8, 146 (1986) .41. I. Joughin, S. Tulaczyk, M. Fahnestock, R. Kwok, Science 274, 228 (1996) [Abstract/Free Full Text].42. J. J. Mohr, N. Reeh, S. Madsen, Nature 391, 273 (1998) [CrossRef] .43. H. J. Zwally and M. B. Giovinetto, J. Geophys. Res. 106, 33717 (2001) [CrossRef].44. K. Larson, J. Plumb, J. Zwally, W. Abdalati, Polar. Geogr. 25, 22 (2002) .45. Supported by NASA's ICESat (Ice Cloud and Land Elevation Satellite) science activities andCryospheric Sciences Program.9 April 2002; accepted 30 May 2002Published online 6 June 2002; 10.1126/science.1072708Include this information when citing this paper.
lakes, inflow channels, crevasses, and moulins. Ice flow for basal ice at the pressure melting point is partly from basal sliding and partly from shear deformation, which is mostly in a near-basal boundary layer. Our ice velocities are derived from GPS-measured positions of a 4-m pole embedded 2 m in the ice beginning in June 1996 (20).