Transcription
Albemarle Sound demonstration study for the National MonitoringNetwork for U.S. Coastal Waters and their tributariesMichelle Moorman
From Riggs and Ames, 2003Year 1 Inventory current monitoring programs in the Albemarle Sound Conduct a gap analysis to determine current monitoring needs Conduct a soundwide water-quality synopticYears 2 and 3 Implement a pilot monitoring program to address nutrient and phytoplankton datagaps Publish Albemarle Region monitoring database and reportYear 4 Synthesize available data to report on water quality in the Albemarle Sound
Partner collaboration has been used Document current monitoring programsincluding Location of monitoring sites Agency contacts Type of data collected Links to on-line holdings Metadata Identify specific management issues thatresearch and monitoring could address Collaborate on monitoring and research
Monitoring Report Worked in partnership with APNEP Compiled spreadsheets into a geospatial database that could be queried We have received information from over 20 organizations documenting 58current monitoring projects, 19 current research studies, and 20 recentlydiscontinued monitoring and research projects. Final report will be ready in FY14
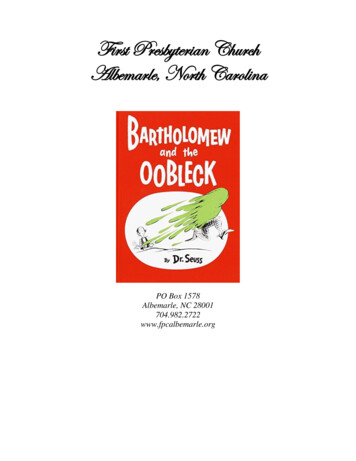
Major management issues identified for theAlbemarle Sound Loss of fisheries– Decline of fisheries, especiallyriver herring, shad, sturgeon, andblue crab– Loss of submerged aquaticvegetation– Eutrophication– Shellfish closures Impacts of climate change– Changing estuarine salinityconcentrations– Estuarine and coastal shorelinemigrationFigure 1. A map published by Titus (2001)illustrating areas of the VA and NC coasts that are atelevations at risk of being affected by rising sealevel.
State and Federal Marine ProtectedAreasin North Carolina
Potential data gaps the demonstration project canaddress Provide a synthesis of all current monitoring efforts in the region Evaluate spatial variation in water and sediment-quality in theAlbemarle Sound from data collected in 2012 Analyze how nutrients, primary production and algal communities varyseasonally in the Sound during 2012-2014 Analyze available datasets to better understand temporal and spatialtrends in water quality
Albemarle Sound Monitoring Objective: Improve understandingof water quality in Albemarle Soundwith a specific emphasis oneutrophication and harmful algalblooms Samples Analyzed for:– Phytoplankton composition,Nutrients, Silica, DOC, Cyanotoxins– Total Suspended Solids– Chlorophyll a, Temp, DO, pH,conductivity, turbidity, PAR, secchidepth, alkalinity– Pesticides (Atrazine and glyphosate)– Metals in water and sediment18
2012 exceedances of regulatory limits or NOAA guidelines 20 Sediment Samples at 20 sites– ERM Lead ( 8.0 ppm, 13 sites)– ERL for Mercury ( 0.15 mg/kg, 7 sites) 41 Water Samples at 33 sites––––––––Chl a ( 40 mg/L, 5 samples)*high pH ( 8.5, 5 samples)*low DO ( 5 mg/L, 2 samples)*Zinc (86 µg/L, 1 sample)*Copper (3 µg/L, 4 samples)*Cyanobacterial cell count ( 100,000 units/mL, 15 samples)**TN ( 1 mg/L, 13 samples)TP ( 0.1 mg/L, 7 samples)
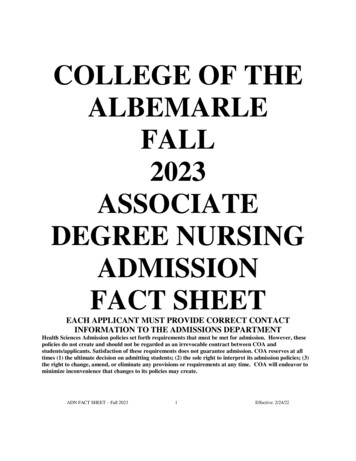
Relationship between cyanobacteria and Chl a450000400000Cyanobacteria (units/mL)350000300000250000200000y 3895.6x 46418R² 0.3559150000100000500000010203040Chl a (mg/L)50607080
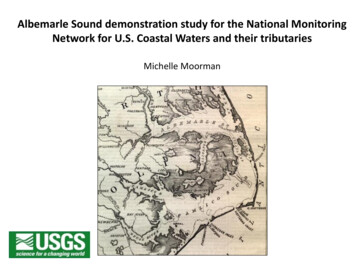
Relationship between TN and Chl a80.0070.00y 33.327x - 9.7223R² 0.6184p 0.000560.00Chl a 00.801.00TN (mg/L)1.201.401.601.802.00
Chl a (mg/L)
Multidimensional Scaling suggests phytoplanktoncommunities are different in the Currituck Sound
Hot spot size(12.5 mile diameter)
Comparison of USGS and DWQ data, 2012OrganizationDateTimeDepth ofphoticzone (m)USGSJul 18 201212001.6.67 .010 .040.038DWQJul 18 201211:501.60.62 0.02 0.020.04USGSJul 17 201213302.7.50 .010 .040.031DWQJul 17 201213:132.50.54 0.02 0.020.02USGSJul 17 201213001.9.48 .010 .040.0235.6DWQJul 17 201212:352.40.57 0.02 0.020.0214USGSJul 17 201212001.6.51 .010 .040.0226.1DWQJul 17 201211:352.40.52 0.02 0.020.0217USGSJul 19 201210302.6.59.011 .040.0278.8DWQJul 19 201210:3020.59 0.02 0.020.0213TKN(mg/L)NH4(mg/L)NO2 NO3(mg/L)TP(mg/L)Chl a(mg/L)10.23.9
Data will be leveraged with USGS Mid-Currituck Bridge Study
August Bloom on the Chowan, August2013
Outcomes of AlbemarleDemonstration Project A geospatial catalogue of current and historical monitoring andresearch efforts in the sound A summary of the current distribution of measured contaminants inthe Sound An improved understanding of how water quality has changedthrough time in the Sound
Albemarle Demonstration projectbeing used to build future work Working with UNC CoastalStudies Institute and USArmy Corps of Engineers toexpand continuousmonitoring effort in theAlbemarle Sound Working with Duke Masters’students to analyze historicdatasets and developvisualization tools Working with partners toidentify funds that can beused to address monitoringgaps in the Albemarle Sound
Huge thanks to our partners! Albemarle-Pamlico National Estuary Partnership Division of Water Resources– Estuarine Monitoring Team– Environmental Sciences Section Division of Marine Fisheries– Elizabeth City Office Coastal Studies InstituteUS Fish and Wildlife ServiceUS Army Corps of Engineers – Duck FRFEastern North Carolina/Southeast Virginia EcoteamEvery person who took the time to report about theirmonitoring program – Thank you!
For more information:National Monitoring lbemarle Demonstration Project:Michelle Moormanmmoorman@usgs.gov919-571-4013
Relationship between Total Algal Density and Cyanobacteria500000450000400000Cyanbacteria (units/mL)350000300000250000200000150000y 1.0426x 25085R² tal Algae (units/mL)300000350000400000450000
6.00y 0.0578x - 0.2751R² 0.45535.00Microcystin 40.00Chl a (µ/L)50.0060.0070.0080.00
Relationship between Chl a and Cylindrospermopsin2.001.80Cylindrospermopsin (µ/L)1.601.40y 0.0095x 0.105R² .0040.00Chl a (µ/L)50.0060.0070.0080.00
Relationship between TP and Chl a80.0070.00y 132.9x 11.406R² 0.143460.00Chl a 50.20TP (mg/L)0.250.300.35
Continuous monitoring of DO, temp, salinity, water level, and turbidity tounderstand temporal dynamics Probabilistic sampling of nutrients in sediment and water Synoptic study of endocrine disrupting chemicals (EDCs) Deriving historical shoreline erosion rates for the sound Developing spatial turbidity models from remotely sensed data Model development to improving understanding of how physical andchemical parameters in the system impact biological endpoints (i.e. SAVdistribution, oyster restoration success, spawning success, algal blooms)
Inventory current monitoring programs in the Albemarle Sound Conduct a gap analysis to determine current monitoring needs Conduct a soundwide water-quality synoptic Years 2 and 3 Implement a pilot monitoring program to address nutrient and phytoplankton data gaps Publish Albemarle Region monitoring database and report Year 4