Transcription
Prepared under NREL Task #VTP2.6407NREL FY13 Vehicle Technologies AOPDOE Milestone ID: #57875DOE Agreement: #22244Office of Vehicle TechnologiesU.S. Department of EnergyProject Milestone: Analysis of Range ExtensionTechniques for Battery Electric VehiclesJeremy Neubauer, Eric Wood, Ahmad PesaranCenter for Transportation Technologies and SystemsNational Renewable Energy LaboratoryJuly 2013NREL/MP-5400-60008NREL is a national laboratory of the U.S. Department of Energy, Office of Energy Efficiency and Renewable Energy, operated by the Alliance for Sustainable Energy, LLC.
ForewordThis report documents completion of the July 2013 milestone as part of NREL’s Vehicle TechnologiesAnnual Operating Plan with the U.S. Department of Energy. The objective was to perform analysison range extension techniques for battery electric vehicles (BEVs).This work represents a significant advancement over previous thru-life BEV analyses using NREL’sBattery Ownership Model, FastSim,* and DRIVE.* Herein, the ability of different charginginfrastructure to increase achievable travel of BEVs in response to real-world, year-long travelhistories is assessed. Effects of battery and cabin thermal response to local climate, batterydegradation, and vehicle auxiliary loads are captured. The results reveal the conditions under whichdifferent public infrastructure options are most effective, and encourage continued study of fastcharging and electric roadway scenarios.The Energy Storage Program of the DOE Vehicle Technologies Office funded this work. We wish tothank our sponsors David Howell and Brian Cunningham in the DOE Office of Vehicle Technologies.Ahmad PesaranEnergy Storage Group Manager, NREL(303) 275-4441ahmad.pesaran@nrel.gov* Developed by NREL’s Vehicle Systems Analysis team2
Executive Summary Battery Ownership Model (BOM) development was initiated in FY10 and completed in FY11 toevaluate the techno-economic analysis of different battery ownership strategies for battery electricvehicles (BEVs). In FY13, we performed extensive model upgrades of BOM to enable higher resolution analyses via:ooooAddition of vehicle cabin and battery thermal modelsClimate data for 100 citiesAdditional real-world driver data to capture the effects of aggression and seasonality in trip takingAn upgraded equivalent-circuit battery model. We have applied this model to study the effects of different range extending infrastructure optionson BEV utility herein. Our findings show that:oAt-home level 1 charging is nearly as good as at-home level 2 charging on average, and sometimes better dueto increased battery degradation with level 2 charging.oAdding at-work charging yields big gains for select commuters, but few to no gains for most commuters.Changing our driver profile toward more “range anxiety” may significantly change this conclusion, however.Ubiquitous level 2 charging can increase average year-10 BEV utility from 83% to 90% for likely driverswithout behavior change when compared to home-only charging.When infrastructure access is universally accessible, the advantage of 50 kW fast charging over level 2charging is marginalized.ooooFast charging has the potential to enable 100% utility factors for many drivers when behavior is responsive toinfrastructure availability, though further analysis is necessary to accurately quantify this potential.Additional analysis of roadway electrification is merited.3
Motivation, Objective, and OutlineMotivationOur FY12 work has shown that the limited range of a BEV can result in a highamount of unachievable travel for some drivers. Not only does this incur highfinancial cost to the driver, but it also results in significant consumption ofgasoline when alternative transport is employed. Several technologies havethe capability to increase the utility of BEVs, reducing gasoline consumptionand potentially total cost as well.Objective: Quantify the ability of varied charging infrastructure (home, work,public (including fast charging), and roadway electrification) to increaseachievable travel of BEVs under real-world conditions.OutlineooooPart 1: Simulation and assumptionsPart 2: ResultsPart 3: Comparisons with previous studiesPart 4: Conclusions and future work.4
Part 1: Simulation and Assumptions
Battery Ownership Model (BOM) V3Major FY13 upgrades: New language (Matlab), higher driving pattern resolution,battery and cabin thermal models, inclusion of cabin HVAC and battery ThermalManagement System (TMS), improved battery electrical model, and more.6
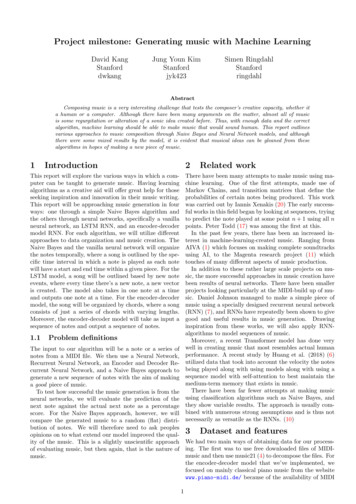
Vehicle Design and Efficiency Employed NREL’s DRIVE cycle for real-worldefficiency predictionoooThe DRIVE cycle was created by applying NREL’s DRIVEtool (developed by the NREL Vehicle Systems Analysisteam) to a set of 2,000 real-world day-long vehiclerecords to create a speed vs. time historyrepresentative of actual driver behavior.For more information, see: Neubauer, J.; Wood, E.(2013). “Accounting for the Variation of DriverAggression in the Simulation of Conventional andAdvanced Vehicles.” Presented at SAE 2013 WorldCongress & Exhibition, April 16:http://papers.sae.org/2013-01-1453/.Note: does not account for grade. Assumed a year 2020 mid-size sedan for the vehicleplatform Applied FastSim to design specific drivetrainsooFastSim is a vehicle simulation tool developed byNREL’s Vehicle Systems Analysis teamNote: We applied a 300 W aux load for EPA-basedsizing, but removed the aux load for DRIVE efficiencycalculation. Aux loads were then added as appropriatewithin the BOM simulations.NREL’sDRIVE cycleVehicle 1:9 sec 0-60 mph75 mile EPA range22.1 kWh battery106 kW motor1576 kg curb weight220 Wh/mi on DRIVE cycle w/o aux.7
Real-World Driving Data: Aggression Real-world, high-accuracy, and high-resolution vehicular velocity histories areneeded to predict the actual on-road variation in vehicle efficiencies of differentdriver and powertrain combinations 2,154 unique vehicle records (spanning 1-2 days each) were sourced from theNREL Transportation Secure Data Center—a composite of data from Los Angeles,CA; Austin, TX; San Antonio, TX; and Houston, TX travel studies The data were recorded using on-board global positioning system data acquisitionsystems filtered down to second-by-second acceleration and velocity histories.8
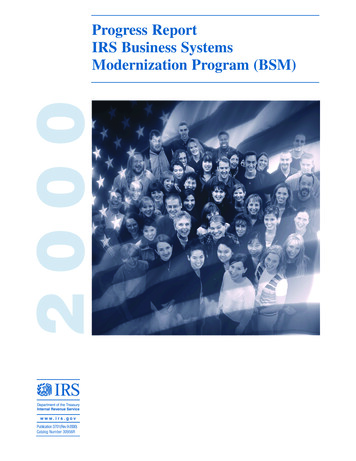
Segmenting Driver Aggression Levels Normalized energy consumption rates show the variation in consumption (y-axis) as afunction of the level of aggression within our data sample (x-axis)We segmented the data into three groups: low aggression (0-25th percentile), normalaggression (25th-75th percentile), and high aggression (75th to 100th percentile)Average value from normal segment used to weight result of consumption predictedby DRIVE cycle for this studySimilar process employed for weighting battery RMS power, used to predict batterythermal response.HighNormalLow9
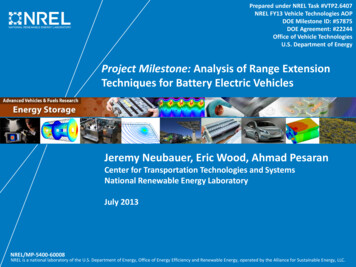
Real-World Driving Data: Trip Distribution Set A 317 vehicle-specific, year-long datarecords were pulled from the PugetSound Regional Councils Traffic ChoicesStudyoRecords selected based on availability of365 consecutive days of data withoutsignificant error Not all drivers are likely to purchaseBEVs; total mileage and percentachievable mileage may be goodindicators of likely BEV drivers We chose to analyze drive patterns thatmeet the following criteria: o80% of their year-one driving isachievable with the BEV withoutinfrastructure supportoMore than 8,000 miles are achieved withthe BEV in year oneWith these criteria, 91 of 317 (29%)drivers were selected as stand-aloneBEV drivers (shown in blue).10
Real-World Driving Data: Trip Distribution Set B The previous 80% utility factorcounts out some high mileagedrivers that could benefit frominfrastructure We therefore created and added asecond set of drive patterns that metthe following criteria:oo Not included in Set AMore than 8,000 miles per year aredriven with a CVWith these criteria, an additional 89of 317 (28%) drivers were selected(shown in red).11
Real-World Driving Data: Trip Distribution Set C “C” is for “Commuter” We segmented a third set of drivepatterns that met the followingcriteria:oo More than 8,000 miles per year aredriven with a CVMore than 200 days per year with atrip to workWith these criteria, a total of 68 of317 (21%) drivers were selected ascommuters (shown in green).12
Tour Decisions Tour a sequence of trips that begins and ends at home Before each tour was taken, we calculated the expected vehicle range remainingat the end of the upcoming touroooCalculated average vehicle efficiency (Wh/mi) observed over the past 100 tripsAssumed perfect knowledge of tour distance to compute required tour energyAssumed perfect knowledge of battery health to calculate remaining range after tour If the predicted remaining vehicle range was 5 miles, the tour was taken; if not,the entire tour was counted as unachieved VMT Note: The small (5 mile) range buffer, perfect tour knowledge, and perfect batteryhealth knowledge made this process representative of a best-case“bold-informed” BEV driver.Small range bufferGood knowledge ofvehicle efficiency,tour distance, andbattery healthOther combinations of“anxious” and “uninformed” drivers would notperform as well.Large range bufferPoor knowledge ofvehicle efficiency,tour distance, andbattery health13
Climate DataAmbient Temperature (degC)45Phx, HourlyPhx DailyLA, HourlyLA, Daily403530252015 Data readily available for aselection of 100 cities1050050100150200Day of Year250Solar Irradiation (W/m/m)1200300350Phx, Daily AvgPhx Daily MaxLA, Daily AvgLA, Daily Max1000800600400ooo2000 Annual ambient temperatureand solar irradiance historiesresolved at the hourly levelwere employed050100150200Day of Year250300Los Angeles, CA, selected as (1)a likely location for BEVadoption and (2) a climaterepresentative of U.S. averageconditionsPhoenix, AZ, selected for highambient temperature and solarirradianceMinneapolis, MN, selected forcold average temperature.35014
Cabin Thermal Model Passive System:oLumped-capacitance network model driven by battery heat generation,ambient temperature, and solar loading Parameter Fitting:oThermal masses and heat transfer coefficients fit from test data.15
Cabin HeatingDOE Advanced Vehicle Testing Activity (AVTA)results show cabin heats from 25 F to 72 F in 600 sec.o BOM results show similar performance withcabin heat power at 4,000 W and on/offcontrolo Henning Lohse-Busch, et. al., “AdvancedPowertrain Research Facility AVTA Nissan LeafTesting and ata/2012nissan leaf/AVTALeaftestinganalysis Major%20summary101212.pdf [accessed 16 July 2013]Note: a 300 W battery heater is included in thissimulation, but has minimal effect on cabinresponseWe set cabin power battery power,assuming a perfectly efficient heater.295290TambTcabTemperature (K) me (s)161000
Cabin Cooling AVTA results show cabin cools from 120 F to 72 F in 200 sec with a power consumption of1,800 Wo Henning Lohse-Busch, et. al., “AdvancedPowertrain Research Facility AVTA Nissan LeafTesting and ata/2012nissan leaf/AVTALeaftestinganalysis Major%20summary101212.pdf [accessed 16 July 2013]BOM model does not account for cabin air masstransfer (Note: AVTA vent temp starts atambient)325o TambWe modified Kac to represent this mass transferas follows:Tcab320TbattIf Ta Tc, Kac Kac 1500 W/KWe modeled air conditioning as a constant heatremoval from cabin of 4,500 W; load on systemwas 1,800 W (coefficient of performance 2.5)315Temperature (K) 310305 Then our cabin response agreed reasonably wellwith AVTA data.3002950100200300400600500Time (s)700800900171000
Battery Thermal Management System Previous studies showed that active thermal managementoffers minimal benefit for BEVs With range extension technologies – particularly fastcharging – BEVs may benefit from active thermalmanagement systems. Only passive battery thermal management was simulatedherein, however, to reduce the size of the design space.18
Life Model ApproachBattery aging datasets fit with empirical, yet physically justifiable, formulas.Calendar fade SEI growth Loss of cyclable lithium a1, d1 f( DOD,T,V).RelativeResistanceRelativeCapacityCycling fade Active material structuredegradation andmechanical fracture a2, e1 f( DOD,T,V).R a1 t1/2 a2 NQ min ( QLi , Qactive )QLi d0 d1 t1/2Qactive e0 e1 NThe life model approach enables life predictions for untested real-world scenarios.19
Life Model Augmentation Life model is mathematicallymanipulated to compute R and Qfor each drive and park eventλ f(C rate) Q’ λ* Q R’ λ* R Q’ & R’ are calculated from Q & R to adjust for the effects of highrate charging not directly accountedfor in the model20Lambda15X: 2Y: 1010X: 0.3Y: 150012Average C Rate during Charge3 Wear from charge rates less than0.3C (level 2) are unaffected; wearfrom 2C charges are increased by afactor of 10 when the “high wear”option is activated.20
Range-Extending Infrastructure Options Parked at Home Charging– Level 1 (L1: 120V, 15 A AC circuit) opportunity– Level 2 (L2: 240V, 32 A AC circuit) timed (midnightto 1 pm)– L2 opportunity Parked at Work Charging– L1 opportunity– L2 opportunity Parked at Public Charging– L1 opportunity– L2 opportunity– Level 3 (L3: 50 kW DC to battery) opportunity Driving at Select Roadways– Road and cabin loads are powered(battery SOC is constant)– Active 8 am to 10 pm covers 57% of all TCS milestraveled.Traffic Choices Study – Summary .pdf [accessed 16 July 2013]TCS tolled roadnetwork used assurrogate for electricroadway deploymentNote: In this study, driver behavioris NOT changed in response toinfrastructure availability (i.e.,drivers do not make additionalstops for fast chargers).21
How To Read The Following PlotsAssumed climateDashed line: Average annualmileage achieved with arange-unrestricted vehicleColored bars: Average yearone mileage achieved withour 75-mile EPA rated BEVBlack bars: Average year-10mileage achieved with our 75mile EPA rated BEVInfrastructureassumed for allcases in chartInfrastructurevaried across x-axisof chartType of variableinfrastructure employedfor this caseFor this example. 9,700 miles were achieved on average across all drive patterns in year-onewhen L1 home charging and no work charging was employed 9,600 miles were achieved on average across all drive patterns in year-10when L1 home charging and L2 work charging was employedNote: We employed Achieved VMT as a high level metric of BEV utility.More Achieved VMT more gasoline, emissions, and financial savings.22
Part 2: Results
Home Charging Minimal penalty fordowngrading from aL2 to L1 charger forSet A and B driversoDrive Pattern Set ADrive Pattern Set BCapacity for L2charging at home maynot be a prerequisitefor BEV ownership Set B drivers achievean average 71%utility factor whenonly home chargingis available.24
Work ChargingDrive Pattern Set C Adding L1 charging at work adds 600 miles / year on average atyear-10oBut some commuters benefit muchmore than others Minimal penalty for downgradingfrom an L2 to L1 charger at workoL1 charging might be good enoughat work, but the difference in L1and L2 work charger installationcosts may be marginal.25
Work ChargingSomeapproachFew commutersprofiles onof atofworkchargingadditionat-workvia smallVMT utersbenefitseelittlesignificantlybenefitto ignificantlybenefit significantlyfrom atfromworkat workchargingcharging26
Work Charging Why not larger gains?oRecall that we assumed a “bold-informed” tour decision algorithm with asmall (5 mile) range buffer and near-perfect tour/vehicle/battery knowledgeoA more “anxious” and/or “uninformed” tour decision algorithm would takefewer long (deep discharge) tours, resulting in less achieved VMT in thecharge-at-home-only scenario (i.e., our charge-at-home-only scenariooverestimates achieved VMT for “anxious” drivers)oHowever, charging at work enables long tours without deep-discharging thebattery; in this situation it is therefore less likely that “anxious-uninformed”drivers would reduce tour-taking relative to “bold-informed” drivers (i.e., ourcharge-at-home-and-work results may not vary much between “boldinformed” and “anxious” drivers)oThus, “anxious” drivers should see a larger improvement in achieved VMTwith the addition of work charging than the “bold-informed” drivers we havesimulated; additional investigation is necessary to confirm.27
Public Charging: Drive Pattern Set A Ubiquitous public charging addsup to 1,600 miles in year 10,increasing the year-10 utilityfactor from 77% to 90% We see diminishing returns aspublic charging power isincreased (L3 adds little gain overL2)oHowever, the benefit of lowerpower charging would besignificantly reduced if stationswere not universally available asis assumed herein The high-wear L3 casesignificantly penalizes year-10VMT, especially in hot climates.28
Public Charging: Drive Pattern Set A Tours-not-taken is indicative ofthe inconvenience of a BEVoIndicative of the maximumnumber of times a borrowed orrental car must be acquired Without public charging, 10 to30 tours are missed per year onaverage With ubiquitous L2 charging,less than 10 tours per year aremissed on average across allthree climates, even in year 10.29
Public Charging: Drive Pattern Set AMany Set A drivers seelarge reductions intours-not-taken per yearwith L2 public chargingOnly 2 Set A driversaverage more than 10tours-not-taken per yearwith L2 public chargingMost Set A driversaverage less than 5tours-not-taken per yearwith L2 public charging30
Public Charging: Drive Pattern Set AIncreased driving and charging leads to slight elevationsin average battery temperature and SOC.31
Public Charging: Drive Pattern Set A Increased throughput, temperature, and SOC of public charging combineto increase battery wear, despite reductions in average cycle DOD Battery wear is dominated by calendar effects in all cases but the L3 highwear case, in which battery wear is dominated by cycle effects.32
Public Charging: Drive Pattern Set AHigher VMT at EOL withmore battery capacityfade implies that highpenetration publiccharging could enablecheaper, smaller rangevehicles to offer thesame utility.33
Public Charging: Drive Pattern Set B Bigger VMT gains (up to 2,000 miles at year-10) than Set A, but lower utility factor(80% in year-10 with level 3 public charging) Trends in SOC, temperature, capacity fade, and resistance growth are similarbetween driver Sets A and B.34
Public Charging: Drive Pattern Set BMany Set A drivers seelarge reductions intours-not-taken per yearwith L2 public chargingOnly 2 Set B driversaverage more than 30tours-not-taken per yearwith L2 public chargingMany Set B driversaverage near or lessthan 5 tours-not-takenper year with L2 publiccharging35
Public Charging: Drive Pattern Set B Set B drivers achieve greater convenience andVMT with Level 2 public charging than Set Adrivers achieve without public charging With identical public charging access, however,Set A drivers achieve greater convenience andVMT than Set B drivers Conclusion: Even with ubiquitous publiccharging, Set A drivers are still better suited toBEVs than Set B drivers.36
Electric Roadway: Drive Pattern Set A High utility factors (95%) in year-10 Some drivers achieve 100% utility factor 800 to 1,800 mile average year-10 increaseover ubiquitous level 3 public chargingwhen the battery has a high wear rate.37
Electric Roadway: Drive Pattern Set A Some drivers have 0 tours-nottaken with the electric roadway Almost all have less than 5/yr.38
Electric Roadway: Drive Pattern Set B 83% utility factor in year-10 Few drivers achieve 100% utility factor 400 mile average year-10 increaseover ubiquitous level 3 public charging.39
Electric Roadway: Drive Pattern Set B Only 2 drivers have 0 tours-nottaken with the electric roadway Most have less than 10/yr.40
Electric Roadway Electric roadway offers only slightly better achievable VMT thanubiquitous level 3 charging, but eliminates sensitivity to batterywear Achieving 100% utility factor for a large fraction of drivers mayrequire out-of-network roadway electrification Additional opportunities:ooooIt is possible that a smaller deployment of electric roadway (class 1and 2 roads only) could offer similar performance at lower costAllowing battery charging while on the electric roadway will improveutility, but by how much?What’s the impact of electric roadways on PHEVs and HEVs?Significant battery down-sizing without sacrificing vehicle utility maybe possible.41
Part 3: Comparison with PreviousStudies
Past Studies Neubauer, J.; Pesaran, A. (2013).“A Techno-Economic Analysis ofBEV Service Providers OfferingBattery Swapping Services.”NREL/CP-5400-58608. Golden,CO: National Renewable EnergyLaboratory. Presented at theSAE 2013 World Congress &Exhibition, April 16. Neubauer, J.; Pesaran, A.(forthcoming). “A TechnoEconomic Analysis of BEVs withFast Charging Infrastructure.”Submitted to the EVS27International Battery, Hybridand Fuel Cell Electric VehicleSymposium, November 17-20.43
Past vs. Present Approach In this study, driver behavior is NOT changed in response toinfrastructure availabilityoFor example, drivers do not make additional stops for fast chargers In previous NREL fast charging and battery swapping studies,behavior IS changed via explicit battery swapping and fast chargeeventsooMax of 2 fast charge events per driver per dayMax of 4 battery swap events per driver per day Also, previous studies:ooooDid not consider origin and destination of tripsMade travel decisions on daily VMT rather than tour distance andbattery SOCUtilized drive patterns based on 3 months of travel, not 12Applied different driver pattern selection criteria.44
Past vs. Present Results Previous studies: nearly 40% ofdrive patterns achieved a 100%utility factor when behaviorchanged in the presence of fastcharge infrastructurePrevious Study Results This study: less than 20% of drivepatterns achieved a 100% utilityfactor when behavior was heldconstant in the presence of fastcharge infrastructureooSet A: 15/91 (16%)Set B: 3/89 (3%) Conclusion: accounting forchanging driver behavior inresponse to infrastructure isimportant to quantify the value offast charge strategies.45
Part 4: Conclusions and Future Work
Home and Work Charging CaveatsoWe assumed “bold-informed” drivers (i.e., low range anxiety and accurateknowledge of vehicle, battery, and pending travel), which underestimated therelative value of work charging to less predictable, more conservative drivers(who would see less utility without work charging than our values indicate) ConclusionsHome Charging: L1 opportunity charging is nearly as good as L2 on average,and sometimes better due to increased battery degradation with L2 chargingo Work Charging: Our analysis shows big gains for select drivers ( 2,000 mi/yr),but biggest impact may be in reduction of range anxietyo Remaining QuestionsHow capable is work charging when home charging is not available (i.e., formulti-dwelling urban homes)?o How is the value of work charging affected when drivers are more anxious andless informed?o47
Public Charging CaveatsoWe studied the effect of ubiquitous public charging infrastructure on “boldinformed” drivers (i.e., predictable travel and low range anxiety) withoutchanging their behavior (i.e., altering trip patterns). As such, our results:- Marginalize differences between charge rates (if charging wasn’t availableeverywhere all the time, battery SOCs would fall lower and higher ratecharging would be more valuable)- Underestimate the relative value of public charging to less predictable,more conservative drivers (who would see less utility without publiccharging than our values indicated)- Underestimate the absolute value of public charging to drivers willing tochange behavior (e.g., make additional stops for fast charging)- BUT they accurately represent the maximum achievable vehicle utilitywithout behavioral changes under high penetrations of public charginginfrastructure.48
Public Charging ConclusionsooDrivers well suited ( 80% utility and 8,000 mi/yr achieved) to 75-mile(EPA rated) BEVs without public infrastructure can increase their utilityfactors from 77% to 90% on average at EOL with L2 and L3 publiccharging, and can reduce missed tours to less than 5/yrRemaining high mileage drivers increase their utility factor from 63% to80% utility factor with L3 public charging, and can reduce missed toursto less than 10/yr Remaining QuestionsooooHow capable is public charging when home charging is not available (i.e.,for multi-dwelling urban homes)?How is the value of public charging affected when drivers are moreanxious and less informed?How much more effective is fast charging when drivers change behaviorin response to infrastructure availability?How does reduced availability of fast charging affect utility?49
Electric Roadway CaveatsoWe assumed a large number of in-network roads are electrified daily from 8 amto 10 pm and are capable of powering road and auxiliary loads, but not capableof charging the battery. This was selected for ease of implementation with theavailable data, and as such does not represent a best or worst case scenario. ConclusionsThis electric roadway scenario offers only slightly better achievable VMT thanubiquitous level 3 charging, but eliminates sensitivity to battery wearo Achieving 100% utility factor for a large fraction of drivers may require out-ofnetwork roadway electrification.o Remaining QuestionsIs it possible that a smaller deployment of electric roadway (class 1 and 2 roadsonly) could offer similar performance at lower cost?o Allowing battery charging while on the electric roadway will improve utility, butby how much?o What’s the impact of electric roadways on PHEVs and HEVs?o Is significant battery down-sizing possible without sacrificing vehicle utility?o50
Acknowledgments This activity is funded by the DOE VehicleTechnologies Office, Energy StorageTechnology We appreciate the support provided by ourDOE program managersooDavid HowellBrian Cunningham Special thanks to NREL’s Vehicle SystemsAnalysis team for supporting this effortwith FastSim and DRIVE Technical questions regarding this workshould be directed to Jeremy Neubauer at303-275-3084 orjeremy.neubauer@nrel.gov.51
Project Milestone: Analysis of Range Extension Techniques for Battery Electric Vehicles . Jeremy Neubauer, Eric Wood, Ahmad Pesaran . Center for Transportation Technologies and Systems . National Renewable Energy Laboratory . July 2013 . Prepared under NREL Task #VTP2.6407 NREL FY13 Vehicle Technologies AOP DOE Milestone ID: #57875 DOE .