Transcription
Lower-bound Analysis of Masonry VaultsP. Block & J. OchsendorfBuilding Technology Program, MIT, Cambridge, MA, USAABSTRACT: This paper applies Thrust-Network Analysis, a three-dimensional computational method for obtaining lower-bound solutions of masonry vaults with complex geometries. The method extends thrust-lineanalysis to three-dimensional problems by finding equilibrium force networks within the vault’s geometry,representing possible paths of the compression forces. Through two case studies, this paper demonstrates thepotential of the method as a powerful tool for understanding, visualizing and exploring the equilibrium ofcompression-only structures. First, an analysis of a series of groin and quadripartite rib vaults investigates theinterrelationship between different parameters and the range of possible equilibrium solutions of these vaults.A second case study analyzes the fan vaults of King’s College Chapel in Cambridge, England.1 INTRODUCTIONMedieval vault builders explored three-dimensionalequilibrium, creating complex forms carefully balanced in compression. The structural properties ofthese sophisticated forms are still poorly understoodbecause of a lack of appropriate analysis methods,i.e. methods relating stability and form.The safety assessment of masonry structures isprimarily a problem of geometry and stability, ratherthan of material stresses (Heyman 1995). Structuresin unreinforced masonry work in compression, andthe tensile capacity of the stone and mortar can beconsidered as negligible. These considerations thendemand new tools in order to understand how thesestructures work and why they are able to stand forcenturies. Linear elastic analysis using finite elementmethods is mainly concerned with stresses, and isnot appropriate for historic structures in masonry.1.1 Lower-bound analysis and the safe theoremHeyman (1966) introduced the safe theorem for masonry structures, also known as the lower boundtheorem. Put simply, a vault in unreinforced masonry will stand if a network of compression forces inequilibrium with the applied loads can be foundwhich fits within the section of the structure. Thissolution is a possible lower-bound solution. Although we will never know how exactly the masonryvault is standing, this is not necessary. The safetheorem guarantees that as long as we can demon-strate one way that the structure could stand, i.e.could be in equilibrium with the external forces,then it is safe. This approach initially neglects sliding, which can be checked afterwards to ensure thatsufficient friction exists. For further reading on lower-bound analysis for unreinforced masonry structures, see Heyman (1995) and Huerta (2001, 2004).1.2 Thrust-line analysis and graphic staticsThrust-line analysis is a particularly powerful method for understanding and exploring the range oflower-bound equilibrium solutions of compressiononly systems, such as unreinforced masonry structures. It visualizes the relative stability of thesestructures by showing the paths of the resultantcompressive forces throughout the structure and, fortwo-dimensional problems, suggests possible collapse mechanisms (Ochsendorf 2002, Block et al.2006b). However, it is primarily a two-dimensionaltechnique and is therefore most appropriate for theanalysis of arches, flying buttresses or any structurewhich can be reduced to a sectional analysis.Graphic statics can be used to compute thrustlines (Fig. 1). The main advantage of using graphicalanalysis is that the funicular polygon visuallyrepresents the forces in the system. Examples ofgraphic statics for fully three-dimensional problemswere performed and demonstrated by Föppl (1892).These analyses were difficult to perform and limitedto statically determinate problems.
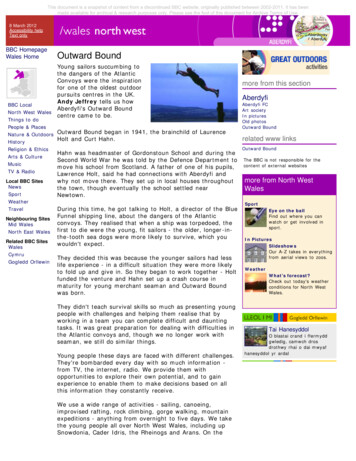
2 EQUILIBRIUM ANALYSIS FOR VAULTS INUNREINFORCED MASONRY2.1 Pseudo-3D equilibrium analysis methodsIn order to analyze three-dimensional structuresusing the same intuitive methods discussed above,the analyst typically must slice the structure,reducing it to a combination of two-dimensionalproblems. In this way, structural behavior is reducedto a combination of arch actions. This processobviously does not capture the full threedimensional behavior of the structure and must relyheavily on the chosen discretization. Theselimitations have been the main reasons why thrustline analysis has not been used extensively for theassessment of complex 3D structures.Wolfe (1921) demonstrated how by slicing up astructure a global pseudo-3D analysis can be doneby combining local thrust lines (Fig. 1). This methodology was entirely manual and quickly becomes tedious (Boothby 2001). Block et al. (2006b) proposeda method to produce models which contain thegraphical construction but which are parametric andinteractive, reducing the tedious iterative nature oftraditional graphic statics. The models demonstratethe range of possible solutions and can be used toinvestigate the effects on the global stability of thevault of varying different parameters such as buttress thickness, arch thickness, level of fill, etc.Smars developed in his PhD thesis (2000) computational tools to perform such a pseudo-3D analysis inan automated fashion, starting from the actual measured geometry of the vaults.2.2 Fully 3D equilibrium analysis methodsThe main problem with three-dimensional equilibrium analysis for masonry vaults is that they arehighly indeterminate structures. Antoni Gaudí’sphysical form-finding process for the church of theColonia Guell can be used to explain this. First, before starting to construct a hanging string model,Gaudi had to decide on a suitable force pattern topology to represent the structural action of thevaults. Then, after choosing the structural logic, it isstill challenging to control or even predict the finalshape, since the equilibrium of each string influences the equilibrium of the entire network. It is atedious, iterative process of adjusting and refining.New form-finding programs which explore hanging models in the virtual world, based on dynamicrelaxation, such as Kilian’s CADenary tool have todeal with the same issues (Kilian and Ochsendorf2005). It is very hard to control and predict how thefinal shape of the compression network will looklike if local changes are being made or a string model is being assembled and hung under gravity. ThisFigure 1. A pseudo-3D analysis of a gothic rib vault usinggraphic statics (Wolfe 1921). The web of the vault is cut intostrips which are analyzed as 2D arches. The main ribs bring theforces from those arches down to the supports.is true for both physical and virtual string models asfor graphical methods.In order to analyze a three-dimensional indeterminate system these unknowns need to be understood and controlled. This can be achieved by describing the problem as an optimization problem.The equilibrium requirements then are formulated asa set of constraints which have to be satisfied whileoptimizing a certain objective function.O’Dwyer (1999) implemented optimization methods to investigate masonry vaults by finding possible compression-only force networks which are entirely contained within the boundaries of the vault.Recently, the problem of controlling a virtual hanging strings network has been elegantly and efficiently been implemented within a similar optimizationframework by Andreu et al. (2007). A hanging stringnetwork is found which fits within the invertedgeometry of the vault to be analyzed.The following section briefly summarizes ThrustNetwork Analysis, a new fully three-dimensional extension to thrust-line analysis based on projectivegeometry, duality theory and linear optimization(Block and Ochsendorf 2007). Examples in Sections 4 and 5 will demonstrate its value for the analysis of vaulted structures in unreinforced masonry.3 THRUST NETWORK ANALYSIS3.1 MotivationOur goal was to develop a three-dimensional versionof thrust-line analysis similar to previous applications using interactive graphic statics. This meansthat the following features should be preserved:
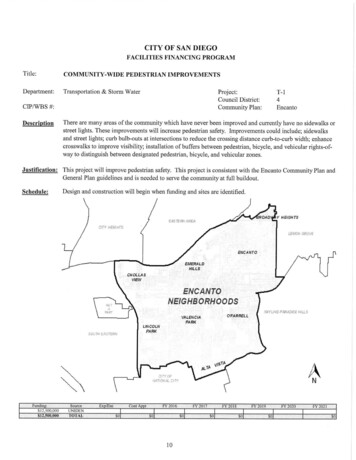
- a graphical and intuitive representation of theforces in the system; and- an interactive exploration of the range of equilibrium solutions bounded by a minimum and maximum thrust.In order to cope with the challenges of the high degree of indeterminacy of three-dimensional problems, as discussed in section 2.2, we want to be ableto:- identify and control the many unknowns (degreesof freedom); and- negotiate between the unknowns by formulatingan optimization problem with different objectivefunctions.Therefore we want to explore the impact of differentassumptions about the force patterns, internal forcedistributions, boundary conditions or loading conditions.3.2 MethodologyThrust-network analysis extends O’Dwyer’s (1999)work on funicular analysis of vaulted masonry structures by adding the reciprocal relationship betweenthe geometry and the in-plane internal forces of networks (Williams 1986), which was first described byMaxwell (1864). Figure 2 demonstrates this relationship: the internal force equilibrium of one grid isrepresented by the geometry of the other grid andvice versa.Thrust-network analysis is developed for loadingconditions where all forces are parallel to each other,such as gravitational loading. Note that this methodis therefore appropriate for historic structures in unreinforced masonry since the dominant loading isself-weight. It is important to note that in this casethe external forces do not appear in the projection ofthe system on the plane perpendicular to the direction of the forces. This means that a plane force diagram can be produced which represents the equilibrium in that plane of the system independent of theexternally applied loads. As a result the force diagram is scale-less since the external forces whichtypically give scale to the force diagram are missing.3.3 Overview of the main stepsThe set-up of the program is summarized below.Block and Ochsendorf (2007) presents details on theproblem formulation and solving procedures.(a) Defining a solution envelope:The compression-only solutions must lie within given boundaries defined by an intrados and an extrados (Fig. 3a). These put height constraints on thenodes of the solution. These limits are obtained fromFigure 2. The two plane grids have a reciprocal relationship asdefined by Maxwell. The equilibrium of a node in one of themis guaranteed by a closed polygon in the other and vice versa.The labeling uses Bow’s notation (Bow 1873).a three-dimensional model of the actual vault.(b) Choosing a force pattern Г:In plan, a possible force pattern topology is constructed (Fig. 3b). The branches represent possibleload paths throughout the structure. The loadednodes represent the horizontal projections of centroids (cf. step d). This pattern is the horizontal projection of the final solution.(c) Generating the reciprocal force diagram Г*:The reciprocal force diagram (Fig. 3c) is producedfrom the force pattern such that correspondingbranches stay parallel and nodal equilibrium in thepattern is guaranteed by closed polygons in the reciprocal diagram (Fig. 2). Note that the applied loadsdo not appear in the force diagram because they reduce to a single point in the horizontal projection(Fig. 4). This results in a force diagram with an unknown scale since the relation between pattern anddiagram is true regardless of their relative scales.(d) Attributing weights:The weights attributed to the loaded nodes comefrom distributing the dead load of the 3-D tributaryarea to those nodes (Fig. 3d). In addition to selfweight, other loads can be applied, such as the levelof fill.(e) Updating the force diagram:In the case of an indeterminate force pattern containing nodes with more than three bars coming togetherper node, the user can change the internal force distribution by manipulating the force diagram (Fig. 4).This notion becomes interesting when forces want tobe attracted to certain lines in the structure, such asalong the ribs.(f) Solving for the equilibrium solution G:Using the geometry of the force pattern and diagram, theweights applied at the nodes and the boundary conditions, this problem can be solved using a one-step linearoptimization (LO).
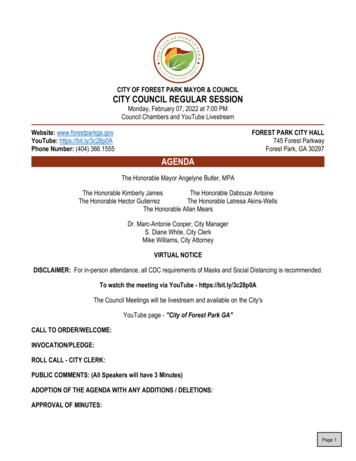
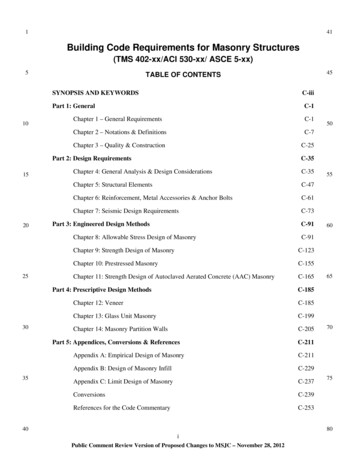
Figure 3. (left image) The input for the Thrust Network Analysis method: (a) the boundaries, the intrados and extrados of the vault;(b) a possible force pattern Г defined on the horizontal plane; (c) the reciprocal force diagram Г* automatically produced from Г;and the weight associated per node coming from the vault’s self-weight and other imposed loads.Figure 4. (right image) For a simple, but indeterminate, 4-bar structure, keeping the load P, the force pattern Γ, and the depth ofthe structure the same, this image shows the effect of manipulating the force diagram Γ*, i.e. changing the internal distributions ofthe forces. Stretching the force diagram to double the size in one direction is equal to doubling the forces in that direction and thusresulting in a structure half as deep in that direction.The constraint equations have the following form(matrix notation):()CT H T H * C z p r 0(1)In this equation, the unknowns are linear combinations of the nodal heights z and the unknown scale ofthe force diagram r. The coefficients in the equationsare functions of the connectivity matrix C, whichrepresents the topology of the networks (Schek1974); the branch lengths H and H* of the force pattern Г and diagram Г* respectively; and p, the loading in each node.We solve simultaneously for the nodal heights ofthe solution and the scale of the force diagram. Thehorizontal components of the forces in the solutionG can easily be found by measuring the lengths ofthe branches in the force diagram grid and multiplying them by the actual scale.3.4 ApplicationsBefore able to solve the problem using LO, the analyst must choose the objective function of the optimization problem. Examples are (1) increasing theload factor of an imposed load until no solution canbe found that fits within the boundaries of the structure (Fig.5a); (2) finding the one solution whichmaximizes the geometric factor of safety to demonstrate if a structure is safe or not (Fig.5b); or (3)finding the range of thrust, defined by a minimumand maximum thrust solution (Fig.5c), to understandthe capacities of the 3D vault.The first option gives an upper-bound solution.O’Dwyer (1999) demonstrates this for a barrel vaultwith a point load. Although such an analysis is relevant for bridge structures, such a loading is unlikelyfor vaults inside of a building. The second option isused by Andreu et al. (2007). If the optimizationproduces a result, then the safe theorem guaranteesthat the vault is safe and the geometric factor ofsafety gives an indication of the relative stability ofthe vault. The third option is used in this paper. Therange of possible thrust values gives a useful characterization of the structural behavior of the vault. Theminimum (or passive) thrust state represents theleast amount this vault can push horizontally on itsneighboring elements, as a function of its selfweight and shape. The maximum (or active) state ofthrust on the other hand represents the largest horizontal force this vault can provide. So, this valuedemonstrates how much horizontal force this vaultcan safely take from its neighboring elements. Forthe optimization problem this means that we want tominimize and maximize the scale of the force diagram, resulting in globally the smallest versus thelargest horizontal forces in the system or also thedeepest versus the shallowest solution which fitsFigure 5. Possible objectives for the LO problem: (a) maximizing the load factor of an applied load; (b) maximizing thegeometric safety factor; and (c) finding the range of thrust values, defined by a minimum and maximum thrust value.
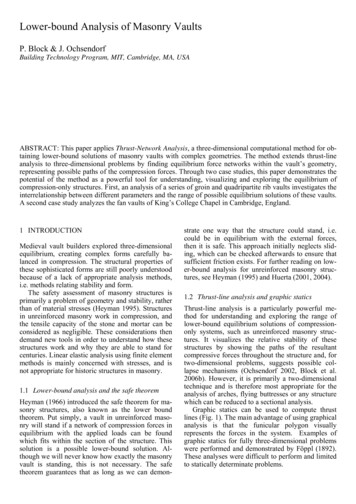
within the boundaries of the structure.The viability of the proposed method is demonstrated through two case studies, highlighting itsmultiple applications. First, an analysis of a series ofgroin and quadripartite rib vaults investigates the interrelationship between different parameters and therange of possible equilibrium solutions of thesevaults. A second case study looks specifically at thefan vaults of King’s College Chapel in Cambridge,England.4 GROIN AND QUADRIPARTITE VAULTSVariables influencing the range of vault thrust include the influence of the web geometry, the boundary conditions, the role and effect of cross-ribs, theassumptions for the internal force patterns, the presence of cracks and other pathologies, and the impactof fill above the haunches.The groin vault shown in Figure 6 is found tohave a range of possible horizontal thrust values atthe corners which vary from 21% to 32% of the totalweight of the vault. This results from the choice of apseudo-3D force pattern inspired by Wolfe’s analysis (Fig. 1), where arches are assumed to span between the ribs, which carry the loads to the supports.The presence of Sabouret cracks which run parallelto the edges of the vault could justify such a pattern.Figure 7 illustrates the relation between the cho-Figure 6. Possible thrust values at the corners for this groinvault range from 21% to 32% of its total weight.sen force patterns (i.e. the horizontal projection ofthe thrust network solution), the reciprocal force diagrams, and the shape of the 3D equilibrium solutions. The image demonstrates how the force diagrams clearly visualize the internal force distributionof the different force path assumptions (e.g. howmuch more force goes into the diagonals comparedto the arches spanning in between them). Not onlythe proportions inside the force diagrams are useful,but the global scale allows for a direct comparisonof the overall magnitude of the forces in the systembetween the different force pattern assumptions.The first force pattern and diagram (Fig. 7a)represent the minimum thrust state shown in Figure6. The second pattern (Fig. 7b) shows a different assumption on how the forces could travel through thestructure: all force lines go directly to the cornerFigure 7. Different possible force patterns for a groin or rib vault: (a) the diagonal ribs bring down the forces to the corner supports,arches in the web span in between the ribs; (b) all force lines go directly to the corner supports; and, (c) primary force lines accumulate towards the supports and a continuous 3-D mesh distributes the loads to these force lines. (d) shows the three-dimensionalthrust network, resulting from the assumptions in (c), which fit within the vault’s geometry.
supports. The force diagram represents in a clear fashion the equilibrium of the corner nodes and centernode. A similar force pattern is used in Section 5 toanalyze the fan vaults. The last pattern (Fig. 7c)shows a fully three-dimensional force pattern. Animportant difference with the previous two assumptions is that forces no longer only go to the cornersupports. This network assumes that a part of thevault is carried along the edges. As a result the thrustat the corner supports will be reduced. The mainforce lines (heavier lines in the force pattern) aredistinguished from a continuous, regular grid in between. As can be seen in the force diagram, moreforce is attracted to the main force lines compared tothe grid lines resulting in primary structural actionover these lines and three-dimensional vault actionbetween them. The location of these force lines canfor example be inspired by the location of ribs in theactual vault. Figure 7d shows a three-dimensionalcompression-only thrust network which fits withinthe groin vault’s geometry.5 FAN VAULTS OF KING’S COLLEGEThe fan vaults of King’s College Chapel in Cambridge, England were constructed between 1512 and1515 (Fig. 8a). These double-curvature vaults werefirst analyzed by Heyman (1977) using membranetheory. These vaults with complex geometries canbe analyzed using thrust-network analysis.From available documentation (Leedy 1980), adetailed three-dimensional model is constructed(Fig. 8b, c). This model is used for obtaining precisenodal height constraints and good approximations ofthe weights applied at each node.Since there are cracks between the transversearches and the conoid fan vaults (Leedy 1980), wecan assume that no compressive forces can be transferred between them. The transverse arches and thefan vaults work independently of each other. Thechosen force pattern should reflect this, i.e. nobranches should cross the interfaces between the fanvault and the transverse arch. Figure 8d shows athrust network which fits within the vault’s sectiondemonstrating that it is stable. The force pattern follows the radial rib pattern.The fill adds weight and alters the thrust-networkbut also adds more depth to the section for thethrust-network to travel through. This is very clear ifwe look at the equilibrium of the main transversearch (Fig. 9). Without the level of fill, this archwould be too thin to stand under its own weight. Thelevel of fill causes an increase of thrust, i.e. the hori-Figure 8. (a) Inside view of the fan vaults of King’s Chapel in Cambridge, (b,c) A detailed model of the geometry of the vaults and(d) a 3D thrust-network solution fitting inside the section of the vaults.
6 DISCUSSIONFigure 9. (a) The line of thrust exits the section of the transverse arch if the level of fill is left out. (b) shows the stable situation with fill.zontal component, of the main arch by less than 25%compared to the case with no fill. On the other hand,the vertical component is more than tripled due tothe added weight of the fill. We can conclude fromthis that the level of fill has a significant stabilizingeffect on the buttresses which carry the arches andthe vaults.Furthermore, the level of fill appeared to be ofcrucial importance in order to find an acceptablethrust-network, which is shown in Figure 8d. In fact,the thrust-lines in the long direction of the vaults only fit within the section due to the fill. Another example illustrating the careful choice of the geometryof the vaults and fill is the added height and weightover the transverse ridges between two adjacent fanvaults (Fig. 8c) which causes a kink in the thrustlines in the short direction of the vaults such thatthey fit in the very steep section. From this preliminary analysis it seems that each stone, and even thelevel of fill, has been sculpted carefully to maintainthe stability of this thin vault.The importance of the level of fill could be investigated even further. For a given vault geometry,what would be the optimal level of fill? What loading would cause the thrust-network to lie as close tothe middle surface of the vault as possible? We cansolve this by using equation (1) differently. For agiven choice of force network and force distribution,we now want to find the funicular loading which results in a given shape (Williams 1990). This meansthat in Equation (1) now C, H, H* and z are knownand that p and r are the unknowns. So, the optimization process now defines the optimal level of fillwhich would cause the thrust-network to lie as closeto the middle surface of the vault as possible.The methodology uses existing 3D drawing softwareas input and output resulting in an interactive toolwith a visual representation of results and force distributions. Analysis proceeds from an accurate 3Dmodel of the vault without the need for abstractionor simplification. The computation is done in MatLAB. The number of elements that the implementation can handle is limited to approximately 500 dueto computational speed but this could easily be improved.For the thrust-network analysis of masonry vaults,various parameters can be changed. (a) Differentforce patterns can be chosen to compare assumptionson how forces may be traveling through the structure. A distinction can be made between primaryforce lines and secondary force lines. (b) The forcediagrams can be manipulated in order to redistributethe internal force distributions. (c) The solution envelopes can be chosen in order to constrain the solutions to the middle third zone of the vault or to exclude the thickness of ribs. (d) Different boundaryconditions can be chosen. The vault can have a continuous edge support or only corner supports. Thisdecision can be influenced by the curvatures of thevaults or by the existence of cracks. (e) Level of fillor other imposed loads can easily be integrated byadding load to affected nodes.In addition, the loading cases do not have to beconstrained to only gravity loads. An initial measureof the stability of a vault under lateral accelerationcan be assessed by applying an equivalent static horizontal force. As shown in Block et al. (2006a) using interactive graphic statics for 2D, this can be simulated by tilting the model.Future work includes the development of a moresophisticated optimization set-up which takes intoaccount all possible force patterns and diagrams andsearches for the absolute minimum and maximumthrust values for the masonry vaults.7 CONCLUSIONThis paper applied Thrust-Network Analysis, a fullythree-dimensional computational method, to obtainlower-bound solutions for masonry vaults with complex geometries.Key elements in the proposed process are (1)force networks, representing possible force pathsthrough the structure; (2) interactive reciprocal diagrams, visualizing the proportional relationship ofall forces in the force network and providing a highlevel of control for the user to understand and manipulate the force distributions within the system; (3)the use of envelopes defining the solution space; and
(4) linear optimization, resulting in fast computationand visualization of results.For the input of the vault geometry and the loading conditions and for the output of the threedimensional results, implementations are written inexisting architectural software. This allows for clearvisualizations of the results, and the smooth integration of the form-finding process in the analysisprocess.Through several examples, this paper demonstrated the potential of thrust-network analysis as apowerful tool for understanding, visualizing and exploring the equilibrium of compression-only structures such as historic vaults in unreinforced masonry.REFERENCESAndreu, A., Gil, L. & Roca, P. 2007. Computational Analysisof Masonry Structures with a Funicular Model. Journal ofEngineering Mechanics 133(4): 473-480.Boothby, T.E. 2001. Analysis of masonry arches and vaults.Progress in Structural Engineering and Materials 3: 246256.Bow, R.H. 1873. Economics of construction in relation toframes structures. London: Spon.Block, P. Dejong, M. & Ochsendorf, J. 2006a. As Hangs theFlexible Line: Equilibrium of Masonry Arches. The NexusNetwork Journal 8(2): 13-24.Block, P., Ciblac, T. & Ochsendorf, J. 2006b. Real-time limitanalysis of vaulted masonry buildings. Computers andStructures 84(29-30): 1841-1852.Block, P. & Ochsendorf, J. 2007. Thrust Network Analysis: Anew methodology for three-dimensional equilibrium. Journal of the International Association for Shell and SpatialStructures 48(3).Cremona, L. 1879. Le Figure Reciproche nella StaticaGrafica. Milan: Ulrico Hoepli.Föppl, A. 1892. Das Fachwerk im Raume. Leipzig: Verlag vonB.G. Teubner.Heyman, J. 1966. The stone skeleton. International Journal ofSolids and Structures 2: 249-279.Heyman, J. 1977. Equilibrium of Shell Structures. Oxford: Clarendon Press.Heyman, J. 1995. The Stone Skeleton: Structural engineeringof masonry architecture. Cambridge: Cambridge UniversityPress.Huerta, S. 2001. Mechanics of masonry vaults: The equilibrium approach. In P.B. Lourenço, P. Roca (eds.), Historical Constructions: 47-70, Guimarães.Huerta, S. 2004. Arcos bóvedas y cúpulas. Geometría y equilibrio en el cálculo tradicional de estructuras de fábrica.Madrid: Instituto Juan de Herrera.Leedy, W.C. 1980. Fan Vaulting: A Study of Form, Technology, and Meaning. Santa Monica: Arts and ArchitecturePress.Maxwell, J.C. 1864. On reciprocal figures and diagrams offorces. Phil. Mag. Series 4(27): 250-261.Ochsendorf, J.A. 2002. Collapse of masonry structures. PhD.dissertation, Department of Engineering, Cambridge University.O'Dwyer, D.W. 1999. Funicular analysis of masonry vaults.Computers and Structures 73(1-5): 187-197.Schek, H.-J. 1974. The Force Density Method for formfindingand computation of general networks. Computer Methodsin Applied Mechanics and Engineering 3: 115-134.Smars, P. 2000. Etudes sur la stabilité des arcs et voûtes. PhDThesis, Department of Civil Engineering, KatholiekeUniversiteit Leuven.Ungewitter, G. 1890. Lehrbuch der gotischen Konstruktionen.Leipzig: Weigel Nachfolger.Williams, C.J.K. 1986. Defining and designing curved flexibletensile surface structures. In J.A. Gregory (ed.), The mathematics of surfaces: 143-177. Oxford: Clarendon Press.Williams, C.J.K. 1990. The generation of a class of structuralforms for vaults and sails. The Structural Engineer 68(12):231-235.Wolfe, W.S. 1921. Graphical analysis: a handbook on graphicstatics. New Cork: McGraw-Hill.
(Fig. 4). This results in a force diagram with an un-known scale since the relation between pattern and diagram is true regardless of their relative scales. (d) Attributing weights: The weights attributed to the loaded nodes come from distributing the dead load of the 3-D tributary area to those nodes (Fig. 3d). In addition to self