Transcription
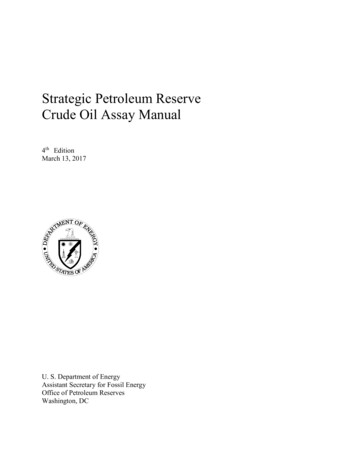
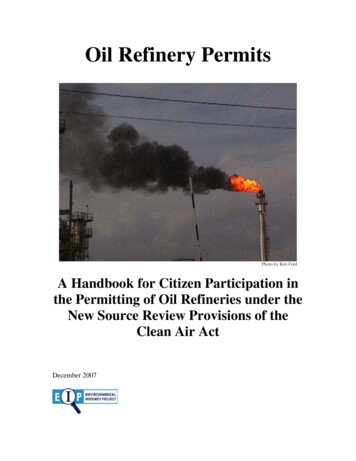
Overview of Crude UnitsCrude units are the first units that process petroleum in any refinery. There objective is toseparate the mixture into several fractions like naphtha, kerosene, diesel and gas oil. Aschematic diagram of an atmospheric crude fractionation unit is shown in Figure TERdieselPA3CrudesteamHENgas oilsteamsour water HEN FURNACEResidue to Vac. TowerFigure 1-1: Atmospheric Crude Unit.Crude oil contains salts which can be harmful to downstream equipment and must beremoved. To remove the salts, water is mixed with the crude oil and typically heated totemperatures between about 215 oF to about 280 oF and allowed to separate in thedesalter. The desalted crude enters another heat exchanger network. Both heat exchangernetworks make use of the vapors of the main column condenser, the pump-around circuitstreams (PA1, PA2 and PA3), and the products that need to be cooled. Then, thepreheated crude enters the furnace, where it is heated to about 340-372 oC (644-700 oF).The partially vaporized crude is fed into the feed region (called flash zone) of theatmospheric column, where the vapor and liquid separate. The vapor includes all thecomponents that comprise the products, while the liquid is the residue with a smallamount of components in the range of gas oil. These components are removed from theresidue by steam stripping at the bottom of the column. Products are withdrawn from theside of the column and side strippers are used to help controlling the composition of lightcomponents. In addition, to more effectively remove heat, liquid is extracted at variouspoints of the column and cooled down to be reinjected at a different position on thecolumn. Cooling water and sometimes air coolers are used in the heat exchangers PA1,PA2 and PA3, but it is always more advantageous to have these streams release their heatto the raw crude oil in the heat exchanger networks (HEN), usually called pre-heating1
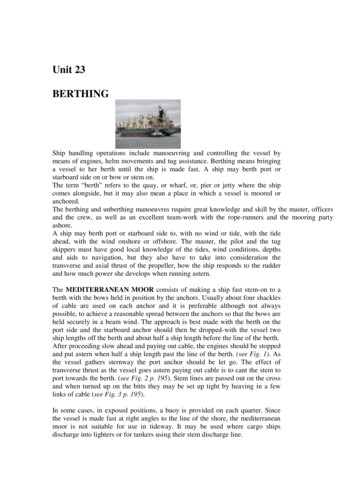
trains. Several different designs and configurations for the heat exchanger network in theconventional crude oil distillation unit are possible. Figure 1-2 shows one particularinstance of a preheating train, not necessarily the best or most recommended one(efficient ones are discussed later). In addition, in some oil distillation units, gas oil is notproduced and instead becomes part of the residue. Such units contain one less sidestripper and one less pump-around than those shown in Figure 1-1 and Figure 1-2.Further, in units in which gas oil is not produced, the diesel may be further separated intoheavy and light diesel.Figure 1-2: Atmospheric Crude Unit-with preheating train.The topped crude leaving the atmospheric tower still contains significant amount ofvaluable oils. These oils cannot be distillated at atmospheric pressure because thetemperature required would be so high that severe thermal cracking takes place. Figure1-3 depicts such a unit. Note first that this unit does not have a condenser and does notfeature side strippers either, simply because products do not have specifications on theirlight end. However, side strippers can be used in specific cases, such as lube base oilproduction.2
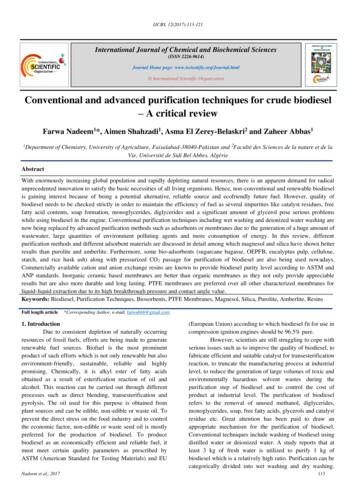
To EjectorsVLGOVHGOTopped CrudeVacuum FurnaceVacuum ResidueFigure 1-3: Atmospheric Crude Unit-with Preheating train.Figure 1-3 shows that light vacuum gas oil (LVGO) and heavy vacuum gas oil (HVGO),are produced. Sometimes, depending on its properties, LVGO is blended with otherproducts like atmospheric diesel. Both are typically used as feed to fluid catalyticcracking units. The vacuum distillation consists of the vacuum furnace, vacuum towerand the vacuum producing system. The topped crude is heated up in the vacuum furnaceto about 400 C. The temperature is controlled to be just below the temperature ofthermal decomposition. Although a single cut of vacuum gas oil (VGO) is allowed insome cases, drawing LVGO and HVGO separately is more beneficial from the point ofview of energy savings, because the resultant HVGO draw temperature is 90-120 Chigher than the corresponding draw temperature of a single VGO cut. Lightercomponents are removed from the residue by steam stripping. In addition coke formationis reduced by circulating partially cooled bottoms to quench the liquid to a lowertemperature. Because the heavy crude fraction contains metal complexes (asphaltenesand porphyrines), which are catalyst poisons for downstream processes, sometimes arecirculation of “wash oil” in the bottom part (not shown in the figure) is included toprevent these compounds to reach the HVGO.Vacuum distillation is widely used to produce catalytic cracking plant feed stocks of lowcarbon content. It is also used to produce lube oil fractions. In practice, the uses ofvacuum distillates and residue depend on the type of crude oil feed, the type of refineryand its downstream processing capacities. The major specifications for the most commonproducts are (Watkins, 1979): Catalytic cracking feedstock: Gas oils for catalytic cracking feedstock require a strictseparation between distillate and residue. The amount of carbon content in these oilsshould be minimal while not sacrificing gas oil recovery. This is necessary to reduce3
coke forming on the cracking catalyst. The metals content, particularly vanadium andnickel, should be controlled because they are severe catalyst poisons.Hydrotreaters or Hydrocrackers Feedstock: These can tolerate a slightly higher metalcontent because the hydrogenation catalysts contain these metals. However, theamount of carbon and asphalt materials should be minimal to prevent coke formation.Distillate fuel oils: Distillate fuel oils to be used directly are specified by API gravity,viscosity, metal content and flash point. Atmospheric boiling ranges can be used todefine the separation.Vacuum residue: The properties of vacuum residue can be defined in several ways.When distillate production is to be maximized, the amount of gas oil allowedremaining in the bottoms stream must be minimized. The residue is blended intoresidual fuels. In this operation, one can normally set the volume percent of either thewhole crude or the topped crude that is to be yielded as vacuum residuum.In the preheating train, the crude is under pressure to suppress vaporization. In the case ofa light crude, the pressure required to suppress vaporization is too high. The solution is toseparate some light components before heating the crude further in the preheat train(Figure 1-4 ). The light components separated in the pre-flash drum are sent to thecolumn directly.condensernaphthaPA1steamPA2Crude OilkerosenevaporsteamDesalterPA3dieselsteamsour waterPreflash drumsteamFurnacegas oilAR to Vac. TowerFigure 1-4 : Pre-flash designIn the pre-fractionation design (Figure 1-5), the light components are separated in apre-fractionation column. Thus, in the pre-flash design, components in the range ofnaphtha are condensed in the condenser of the atmospheric tower, while in the prefractionation design, these components are split into two fractions: light naphthacondensed in the condenser of the pre-fractionation condenser and heavy naphthacondensed in the condenser of the atmospheric tower.4
condenserheavy naphthaPA1light naphthasteamPA2Crude oilkerosenesteamdesalterPA3dieselsteamsour watergas oilsteamprefractionationtowerresiduefurnacemain towerFigure 1-5: Pre-fractionation designThe pre-fractionation design, however, is considered to be similar to the pre-flash designwhen energy consumption is considered (Bagajewicz and Ji, 2002). Because thecondensation heat for naphtha (or light naphtha plus heavy naphtha) is constant, the onlydifference is that the pre-fractionation design provides this heat in two condensers withdifferent temperatures. When there is significant heat surplus in the temperature range ofthe condensers (intermediate and light crudes), the difference does not affect energyconsumption.Finally, in recent years, an alternativestripping-type process was proposed(Figure 1-6), the crude is heated to arelative low temperature (about 150 C)and fed close to the top of the column.Because the crude temperature is low, thevapor ratio of the feed is small. The crudegoes down the column and is heatedconsecutively in three heaters (the upperheater, middle heater and lower heater).Side products are withdrawn from thevapor phases, and rectified in siderectifiers. Although some preliminarystudies indicated that these units could beadvantageous from the point of view ofenergy consumptions, it was later proventhat they are actually less energy efficient.WaterPreheaterNaphthaKeroseneDesalted crudeUHDieselMHGas oilLHSteamAR to Vac. TowerFigure 1-6: Stripping-Type design.5
In the framework of sharp split distillation sequences, the conventional design is anindirect sequence and the stripping-type design is a direct sequence (Liebmann, 1996). Inother words, these two designs are located at the two ends (complete direct and indirectsequences) of the spectrum of distillation sequences. The pre-fractionation design is asequence somewhere between these two extremes. Indeed, the lightest component isseparated first and an indirect sequence follows. The pre-flash design does not fallexactly into regular sharp split distillation theory, but can be considered somehow similarto the pre-fractionation design.In the rest of this unit, we will overview some crude characterization procedures andmeasures, will discuss how crude fractionation products are specified and we will bediscussing the flexibility of conventional atmospheric crude fractionation units. Theseconcepts will be used in Unit 2 to discuss various ways of simulating these units and inthe rest of the course, how can this be used to properly design and retrofit these plants.Crude Oil CharacterizationPetroleum is a mixture of hundreds of hydrocarbons of all type (Alyphatic, Aromatic,Cycloalyphatic, etc) with water, salts, sulfur and nitrogen containing compounds andsome metal complexes. Thus, instead of straight composition, alternative measures areused to characterize it: density, distillation curves, etc. We now discuss some of thosethat are relevant to the use of modern procedures of simulation and design (density, Kfactor as well as TBP and ASTM distillation curves). Notwithstanding their importance,we omit discussing, salt, sulfur, nitrogen as well as metal content, mainly because most ofthese factors are more relevant for processes downstream the crude fractionation unit. Acomplete account of all these methods can be found in Wauquier (1995).DensityThe main classification of crude is by referring to their density. Light crudes have aspecific gravity (d) smaller than 0.825, medium crudes between 0.825 and 0.875, heavycrudes between 0.875 and 1.000 and extra heavy crudes larger than 1.000.While specific gravity may suffice, the petroleum industry uses another scale (API):API 141.5 131.5d(1-1)Thus, light oils have a large API density and heavy ones a low one. Typical low valuesare close to 15 (some Venezuelan oils) to about 40 (some middle east oils).Crudes are also characterized as paraffinic, asphaltic, napthenic and aromatic (pluscombinations of those). This primary classification intends to reflect the relativeabundance of different types of compounds, as their name indicates. These can also bemore characterized in more detail by the density of their heavy gasoline cut (boiling point6
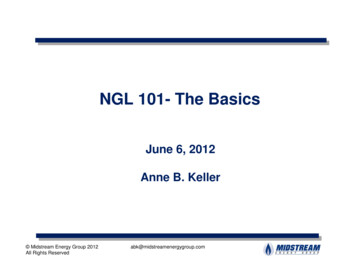
between 100 and 200 oC), d1, and the residue (boiling point larger than 350 oC), d2. Forexample a paraffinic crude has d1 0.76 and d2 0.93, an aromatic crude has d1 0.80 andd2 between 0.93 and 0.975, an asphaltic crude has d1 0.78 and d2 0.975, and so on. Thisis obviously related to the relative abundance of hydrogen and carbon. Nevertheless,there is a need for a unique number, rather than a range, to characterize the type of crudeand this is somewhat reflected by the Watson factor KW.Watson Factor KWThis factor, which was introduced by researchers at Universal Oil products Company(UOP) and for this reason also known as KUOP, is based on the observation that the H/Cratio is related to the boiling points of mixtures, as it is to the individual components.Thus, for pure components, we haveKW (1.8 T )1 / 3d(1-2)where T is the boiling point (Kelvin) and d the specific gravity at 15.6 oC (60 oF). Thisvalue is typically 13 for paraffins, 12 for hydrocarbons whose chain and ring weights areequivalent, 11 for pure naphthenes and 10 for pure aromatics.Because mixtures do not have a unique boiling point, to use this factor in mixtures oneneeds to resort to the use of some average temperature. Thus, one needs to record thetemperatures for which 10, 20, 50, 80 and 90% of the volume has distilled from thesample. Thus if TBP distillation (true boiling point), which is discussed below, is used,we useT T20 T50 T803(1-3)For ASTM distillations (see below), the following is usedT T10 2T50 T904(1-4)While use of this factor has been extremely useful to characterize crudes, the latesttendency, albeit more expensive and time consuming, is to rely on better characterizationmethods based on modern physical tests, like Refractive index and Molecular weight(ndM method), mass spectrometry, ultraviolet (UV) spectrometry, carbon atomdistribution by infrared spectrometry and nuclear magnetic resonance, or bychromatographic (gas and liquid) techniques.True Boiling Point (TBP) Method for Crude CharacterizationThe true boiling point curve is basically a plot of the boiling point of each component ofthe mixture as a function of the cumulative volumetric fraction distilled. It implies that abatch distillation column with a large number of trays and a large reflux ratio is used,which will ensure that each component is separated at a time. In practice, the ASTM7
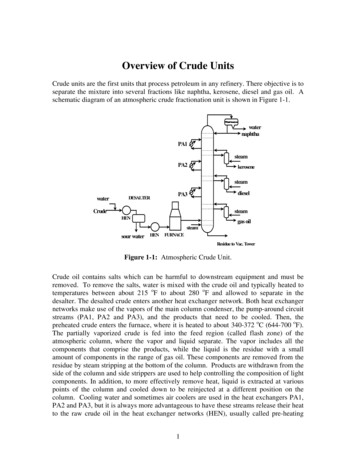
D2892 test method (ASTM is an acronym for American Society for testing andMaterials) is used. It consists of using a 15 to 18 tray distillation column operating at a5:1 reflux ratio. The distilled volume is measured and the temperature in the reboiler isrecorded. An example of such curve is shown in Figure 1-7. In simulators, one enters afew points and a spline interpolation is performed to get the entire curve.Figure 1-7: TBP curve for Kuwait Crude Sp. Gr. 08685 (Taken from “Elements ofPetroleum Processing”, Jones D., 1995)ASTM Methods for Crude CharacterizationIn practice, obtaining the TBP curves are time consuming and expensive. To amelioratethese inconveniences other quicker methods have been developed. One such method,used for almost all petroleum fractions, except for heavy fractions, is the ASTM D86method. In this test, the sample is boiled and the vapors are collected and condensed asthey are produced. Vapor temperatures are then recorded as a function of cumulativeliquid volume collected. Because no reflux is used and there is only one equilibriumstage, the initial boiling point of this assay is larger and the final point is lower than theone in the TBP curve.Another distillation method used for heavy fractions is the ASTM D1160. There is needto use this other method because hydrocarbons start to crack at temperatures higher thanabout 340 oC. The ASTM D1160 is conducted at vacuum conditions (1 to 50 mmHg).There are several other ASTM methods, but we concentrate on these two because theseare the only ones used to specify products. We briefly mention here the simulateddistillation method ASTM D2887, which consists of a chromatographic separation of thecrude into different fractions.8
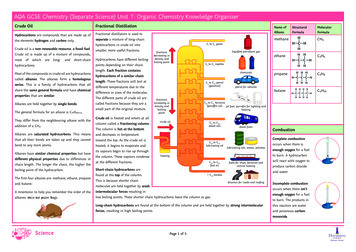
Finally, the Equilibrium Flash vaporization (EFV) method consists of heating up asample keeping vapor and liquid together in the same vessel, that is, not separating itfrom the liquid phase while it is produced, as in the other ASTM D86 and D1160methods. The temperature is recorded as a function of the percentage vaporized.Separation is poorer than in ASTM methods, and therefore, the initial point is higher andthe final point lower. We illustrate the differences between these curves in Figure 1-8.Figure 1-8: TBP, EFV and ASTM curves for a 39.7 degree API light distillate (Copiedfrom “Petroleum refinery Distillation”, Watkins, R.N., 1979).Formulas that allow the transformation between these assays exist and therefore, one canperform all the analysis, using one of them. Typically the TBP is used as the centralreference curve, but the products are often specified using ASTM D86 or D1160 points.Table 1-1: Coefficients to convert TBPto ASTM (Equation 1-5) (RiaziMethod)We now illustrate the conversionformula used to relate TBP values toASTM D86 values. API recommends theRiazi (1979) formula:bT ASTM aTTBP(1-5)where a and b depend on the fractiondistilled, as shown in Table 1-1 anddegrees Kelvin should be used. Similarformulas exist for other conversions.9
Product PropertiesThe TBP curve, together with the density curve can be used to somewhat characterize theproducts that will result from fractionation. This is important, especially if one wants togenerate some initial values to aid simulations to converge. To do this, one needs todefine cut points. These are the temperatures that represent the limits of the fraction ofthe TBP curve that will be produced. This is illustrated in Figure 1-9.A boiling range will then be the range oftemperatures for each product establishedby two cuts. In this section we willillustrate how one can obtain the ASTMand density of one such cut. In addition,we will show how such cut is separatedinto different pseudo components.Once the cut points are established, whenthe fractions are analyzed independently,their end points will be higher than theupper cut point temperature. This is due,of course, to the absence of the heavycomponents. The same can be said for theinitial points, which will be lower than thatof the mixture. This is also illustrated inFigure 1-9Figure 1-9: Cut points and endpoints.Once the cut points are established, the procedure follows the following steps:1. Determine the corresponding volumetric range, which gives the volumetricflowrate of the fraction directly.2. Determine the end point and one other point of the ASTM distillation curve of thefraction.3. Determine the complete TBP distillation curve for the fraction4. Determine the specific gravity of the fraction and the mass flowrate of the productis then determined, if needed.Step 1) The volumetric range is already in percentage fraction, so this is the fraction ofthe total flowrate.Step 2) To calculate the initial and end points (as well as all those in between), one needsto resort to empirical correlations. There are two procedures that are used. Both are basedon obtaining two ASTM points of the curve. In one case, end points and 90% areobtained using the graph of Figure 1-10, which provides the difference between thecorresponding TBP and the ASTM values for selected cases differentiated bytemperature. Alternatively, UOP recommends the linear relation shown in Figure 1-11 for10
the end point and a simple rule for the initial point. The simple rule consists ofsubtracting 15 oF from the lower cut point. This applies to all fractions except the lightestand all vacuum gas oil cuts, for which 50 oF are subtracted.EA.B.C.D.E.End points for fractions starting at 200 OF TBP or lower.End points for fractions starting at 300 OF TBP.End points for fractions starting at 400 OF TBP.End points for fractions starting at 500 OF TBP.90% ASTM temperatures vs. 90% TBP temperatures (allfractions).Figure 1-10: Cut points and end points (Adapted from “Elements of PetroleumProcessing”, Jones D., 1995).Figure 1-11: Cut points and end points (Source UOP).11
Step 3) To obtain the whole ASTM curve, the nomogram of Figure 1-12 is used. The twopoints obtained are located and a straight line is drawn through them. Next, one needs tomake the corresponding correction between ASTM and TBP values (equation 1-5).Step 4) To obtain the density of the fraction one can calculate the mid boiling point ofeach fraction (Figure 1-13). This is the temperature corresponding to the middle of thecorresponding % volume interval. The specific gravity is now easily obtained if thedensity vs. volume fraction, or density vs. TBP curve is available. However, sometimes,the density curve is not available and only the specific gravity of the whole crude isgiven. In such case, one proceeds as follows: The factor KW is calculated using equation(1-2) with the temperature obtained using (1-3). Next, equation (1-2) is inverted to obtainthe specific gravity of the fraction, using the value of KW just calculated and the midpointtemperature.Figure 1-12: Nomogram used to obtain full ASTM curves (Probabilistic plot). (Copiedfrom “Elements of Petroleum Processing”, Jones D., 1995).12
Figure 1-13: Cut points and end pointsExample 1-1:Consider the 197-222 oC (387-432oF) boiling range for the TBP curve given in Figure1-7.Step 1) Volumetric range: According to the figure, the volumetric range corresponding tothese cuts is 27.3-31.2% yield of the fraction is 3.9% vol. This gives us directly thevolumetric flowrate of this fraction, that is, a 3.9% of the total flowrate.Step 2) ASTM end and 90% points: According to Figure 1-10, curve B, the differencecorresponding to the upper cut is 13 oF. Thus, the ASTM end point will be 419 oF (432 oF-13 oF). By using equation (1-5), one obtains the corresponding TBP value (to obtain thecoefficients a and b, we use here the fraction corresponding to 95% and above, that is thelast row of Table 1-1 and we use oK), which is 435.5 oF. According to this figure toobtain the 90% ASTM value, we need the 90% TBP point. We assume that this is equalto the 90% cut point, which is 219.5 oC. Curve E from Figure 1-10 indicates that thedifference is 22 oF. Thus, the 90% ASTM point is 405 oF (427 oF -22 oF). Now, if oneuses Figure 1-11 one obtains 439 oF as the end point. To get the corresponding initialpoint we subtract 15 oF from 387 oF, obtaining 372oF.Step 3) Two straight lines connecting the two sets of points obtained in step 2 are drawn.The first set of points is: (100%, 435.50 oF) and (90%, 405oF). The second set of pointsis: (100%, 440 oF) and (0%, 372oF). The complete curves are then built using the ASTMvalues provided by these two lines.13
Figure 1-14: Step 3) of Example 1-1.Step 4) The middle point of this fraction is 410 oF. Now, from Figure 1-15, one obtainsthe specific gravity: d 0.798. If the curve is not available, one proceeds to calculate theKW factor using (1-2) and the temperature equation (1-3). To do this, one obtains first thethree needed temperatures: T20 148 oC, T50 258 oC, T80 570 oC, which together with thespecific gravity of 0.8685, renders KW 11.80. Now, the specific gravity of the cut isobtained using T 410 oF and KW 11.80 in formula (1-2). The value is: 0.808,remarkably similar!14
Figure 1-15: Specific gravity vs. TBP curve for Kuwait Crude Sp. Gr. 08685. Copiedfrom “Elements of Petroleum Processing”, Jones D., 1995).Exercise 1-1:Consider the Kuwait Crude Sp. Gr. 08685, whose data are given in Figure 1-7 and Figure1-15. Consider a diesel cut with boiling range 432-595 oF.1) Obtain the TBP curve of this cut using the method described above.2) Consider the following volume intervals 13%, 16.5%, 21%, 18%, 18.5% and 13%from the IBP to the EP, respectively. Calculate the middle point temperature, and thespecific gravity of each cut.15
Crude BreakupNow that the procedure to establish the properties of a given fraction is known, weproceed to discuss the procedure needed to determine the complete crude breakup.Examples are given in Table 1-2 and Table 1-3.Table 1-2: Example TBP cut for crude fractionation. (Jones pp. 23)ProductTBP Cut PointsLPG and gasolineIBP-300 oFNaphtha300-385 oFKerosene380-480 oFDiesel480-610 oFAtmospheric Gas Oil (AGO)610-690 oFVacuum Gas Oil (VGO)690-1000 oFTable 1-3: Product Specifications (According to Watkins)ProductSpecificationNaphthaD86 (95% point) 182 CKeroseneD86 (95% point) 271 CDieselD86 (95% point) 327 CGas OilD86 (95% point) 377-410 CIn general, one can start with the values shown in Table 1-3. However, there a detailedanalysis on what is the downstream use of these products sets the quality with moreaccuracy. Consider for example a refinery oriented to produce auto grade diesel, LPGs,kerosene (for cutter stock) and gasolines. The specs for the products in this plant aregiven in Table 1-4.Table 1-4: Example ASTM ranges for Atmospheric crude fractionationProductMax NaphthaNaphtha feed to Naphtha splitter347 oF (ASTM EP)Kerosene335 oF (ASTM 5%)-370 oF (ASTM 95%)Light Diesel385 oF -595 oF (TBP cut points)Heavy Diesel570 oF (5% ASTM)-700 oF (TBP cut point)To generate these some specific properties of these products, other properties than ASTMtemperatures are also used. We summarize some, because they are often used insimulation too.16
We first introduce the concept of Gap, which is used to quantify the overlap betweenadjacent fractions. Consider two adjacent fractions. The (5-95) Gap is the differencebetween the 5% ASTM temperature of a heavy fraction (H) minus the 95% ASTMtemperature of the lighter fraction (L), that is:Gap H , L T5H T95L(1-6)The Gaps recommended by Watkins are given in Table 1-5.Table 1-5: Gap Specifications (According to Watkins)ProductsSpecificationKerosene –Naphtha(5-95) Gap 16.7 CDiesel- Kerosene(5-95) Gap 0 CGas Oil- Diesel(5-95) Gap-5.6 C to –11 CAnother property needed to specify a particular product is its flash point, which is definedas the temperature at which the vapor above the oil will momentarily flash or explode.Usually, this is determined in the laboratory. It is also related to the ASTM 5% point bymeans of the following correlation:Flash Point ( O F) 0.77 ( ASTM 5% O F - 150 O F)(1-7)Other properties are also of importance. They are: Pour point, defined as the temperature at which the oil ceases to flow. The pourpoint is obviously related to pumping problems, which are obviously avoided byheating up the mixture.Cloud point, which is temperature at which the oil becomes cloudy or hazy.Octane number, related to knocking properties and used for gasolines. The octanenumber is important downstream from the crude fractionation unit and is adjusted bya procedure called blending in which different products are mixed to reach thespecification.Cetane number, or Diesel Index, is related to ignition quality and defined as the timeperiod between the start of injection and start of combustion (ignition) of the fuel.The fluids of reference are: n-hexadecane (Cetane Number 100) and alpha methylnaphthalene (Cetane Number 0). Higher cetane fuels will have shorter ignitiondelay periods than lower cetane fuels. The calculated cetane number is often used:this is given by the API gravity times the aniline point (in oF) divided by 100. Inturn, the aniline point is the lowest temperature ( F or C) at which equal volumes ofaniline (C6H5NH2) and the oil form a single phase. It correlates roughly with the17
amount and type of aromatic hydrocarbons in an oil sample. A low AP is indicativeof higher aromatics, while a high AP is indicative of lower aromatics content.Sulfur content in its various forms. Although there are ways to predict the sulfurcontent of products, given those of the crude, we omit these calculations here. Cuts corresponding to different products are typically obtained using a subset of thefollowing specs (although others can be also added to the list):-95% ASTM point (usually the D86 point is used)Allowable Gaps.Minimum Flash pointDesired pour pointDesired cetane number.Sulfur contentConsider for example the specs of Table 1-4. They come from the followingconsiderations:--Naphtha: It will be fed to a catalytic reformer typically requires a charge withASTM IBP 194 oF and EBP 347 oF.Light Diesel and Heavy Diesel: These will be later blended to produce therequired diesel. Such diesel has a pour point of 10 oF. This limits the end point ofthe heavy diesel cut to be 700 oF. Sulfur is of concern here, so the light gas oil isto have less that 0.8% sulfur (Heavy diesel will be hydrotreated). This can bedirectly manipulated through the vol% in the TBP curve (details omitted). If ayield of 18% is chosen, then the cut range obtained is 387-595 oF (cut points). Thelight diesel flash point is 175 oF.Kerosene: A specification of 95% ASTM Temperature 335 oF and a minimumGap of 20 oF with the naphtha and a 10 oF Gap with the light diesel.Exercise 1-2: Obtain the %vol of crude for the specifications given in Table 1-4, usingthe crude of Figure 1-7. For a total of 59689 BPD processed, obtain the correspondingproduct rates.Other PropertiesTo successfully simulate a crude fractionation unit, one also needs to be able to predictproperties like enthalpy, vapor pressure and density, viscosity, surface tension, etc. Theway this is performed is by generating pseudo-components from portions of the TBPcurve, that is, picking a certain interval of volume fraction for example and using the midtemperature of that interval to establish its boiling point. If a density curve is known, thenone can also obtain the density of each pseudo-component. If not, one can use the aid of18
the Watson KW factor to obtain it (the simplifying assumption here is that KW is constantfor all the different fractions).Since the principal characteristics needed to define a pure component are its boilingpoint, standard density and molecular weight, the first two are then given for eachpseudo-component. The molecular weight can be related to these two by a specialformula. In turn critical constants and especial coefficients (e.g. acentric factor,coefficients for equations of state, enthalpy, entropy expressions, etc) are needed tocalculate properties of mixtures. For these, there are also expressions that help calculatethem as a function of normal boiling temperature and standard density. Sin
7 between 100 and 200 oC), d 1, and the residue (boiling point larger than 350 oC), d 2.For example a paraffinic crude has d1 0.76 and d2 0.93, an aromatic crude has d1 0.80 and d2 between 0.93 and 0.975, an asphaltic crude has d1 0.78 and d2 0.975, and so on.This is obviously related to the relative abundance of hydrogen and carbon. Nevertheless, .