Transcription
The Impact of Employer Matching on Savings PlanParticipation under Automatic EnrollmentJohn BeshearsHarvard UniversityJames J. ChoiYale University and NBERDavid LaibsonHarvard University and NBERBrigitte C. MadrianHarvard University and NBERUpdated for the 9th Annual Joint Conference of the Retirement Research Consortium“Challenges and Solutions for Retirement Security”August 9-10, 2007Washington, D.C.The findings and conclusions expressed are solely those of the authors and do notrepresent the views of SSA, National Institute on Aging, the National ScienceFoundation, any other agency of the U.S. Federal Government, the RRC, or the NBER.We thank Hewitt Associates for their help in providing the data. We are particularlygrateful to Pam Hess, Yan Xu, and Lori Lucas at Hewitt for their help with this project.Neel Rao provided excellent research assistance. We appreciate the helpful feedback ofDan McFadden, Olivia Mitchell, and seminar participants at the National Bureau ofEconomic Research. The authors acknowledge financial support from the NationalInstitute on Aging (grant R01-AG021650) and the U.S. Social Security Administration(funded as part of the Retirement Research Consortium). Beshears acknowledgesfinancial support from a National Science Foundation Graduate Research Fellowship.
The Impact of Employer Matching onSavings Plan Participation under Automatic EnrollmentAbstract: Existing research has documented the large impact that automatic enrollmenthas on savings plan participation. All the companies examined in these studies, however,have combined automatic enrollment with an employer match. This raises a questionabout how effective automatic enrollment would be without a direct financial inducementnot to opt out of participation. This paper’s results suggest that the match has only amodest impact on opt-out rates. We estimate that moving from a typical matchingstructure—a match of 50% up to 6% of pay contributed—to no match would reduceparticipation under automatic enrollment at six months after plan eligibility by 5 to 11percentage points. Our analysis includes a firm that switched from a match to a noncontingent employer contribution. This firm’s experience suggests that non-contingentemployer contributions only weakly crowd out employee participation.John BeshearsDepartment of EconomicsHarvard UniversityLittauer CenterCambridge, MA 02138beshears@fas.harvard.eduJames J. ChoiYale School of Management135 Prospect StreetP.O. Box 208200New Haven, CT 06520-8200james.choi@yale.eduDavid LaibsonDepartment of EconomicsHarvard UniversityLittauer CenterCambridge, MA 02138dlaibson@harvard.eduBrigitte C. MadrianKennedy School of GovernmentHarvard University79 JFK StreetCambridge, MA 02138Brigitte Madrian@harvard.edu2
Companies have used a variety of approaches to encourage participation inemployer-sponsored savings plans. The most common approach, the provision of anemployer matching contribution, is now offered by the vast majority of large firms (ProfitSharing Council of America, 2006). Even with a match, however, savings planparticipation rates are often surprisingly low (Choi, Laibson, and Madrian, 2005), andempirical studies of matching contributions’ effect on plan participation have uniformlyfound relatively small effects (Andrews, 1992; Papke and Poterba, 1995; Papke, 1995;Bassett, Fleming, and Rodrigues, 1998; Kusko, Poterba, and Wilcox, 1998; Choi,Laibson, Madrian, and Metrick, 2002; Even and Macpherson, 2005; Duflo et al., 2006;Engelhardt and Kumar, forthcoming).Automatic enrollment is an alternative mechanism for increasing savings planparticipation. In a standard opt-in enrollment scheme, employees must actively elect toparticipate in the plan if they wish to contribute. In contrast, under automatic enrollment,employees are enrolled in their employer’s savings plan at a default contribution rate andasset allocation unless they actively make an alternative choice. Relative to the standardopt-in approach, automatic enrollment dramatically increases plan participation,particularly among younger, low-tenure, and lower-income employees (Madrian andShea, 2001; Choi, Laibson, Madrian, and Metrick, 2002, 2004; Beshears, Choi, Laibson,and Madrian, 2008). The participation rate increase at one year of tenure is as much as 60percentage points.All of the companies in which automatic enrollment has been studied to date havealso offered an employer matching contribution. In principle, the match gives mostemployees a strong reason not to opt out of participation (and indeed, few do). But someextensions of automatic enrollment, such as the Automatic IRA proposal in the U.S., donot include a matching contribution. The extent to which automatic enrollment’seffectiveness relies on the presence of a match is an open question. Without a match, theopt-out rate could be much higher, since participation incentives are greatly reduced. Onthe other hand, if employee inertia drives the automatic enrollment participation effect,we might expect high participation rates even without a matching contribution.We estimate the employer match’s impact on savings plan participation underautomatic enrollment in two ways. First, we study a large firm (Company A) using3
automatic enrollment that replaced its employer match (25% on the first 4% of paycontributed) with an employer contribution equal to 4% of pay plus an annual profitsharing contribution. The employer contribution in the new regime was not contingent onthe employee’s contributions. We find that among new hires with six months of tenure,savings plan participation rates decreased by at most 5 to 6 percentage points after thefirm eliminated the employer match, and overall average employee contribution rates fellby 0.65% of pay.Second, we pool data on savings plan participation at nine firms with automaticenrollment. We use variation in the match structure both across and within firms toidentify the relationship between participation rates and the match. This analysis ispotentially confounded by firm-level omitted variables but still offers suggestiveevidence. We find that a one percentage point decrease in the maximum potential matchas a fraction of salary is associated with a 1.8 to 3.8 percentage point decrease in planparticipation at six months of eligibility. Thus, moving from a typical matching structureof 50% on the first 6% of pay contributed to no match at all would reduce savings planparticipation under automatic enrollment by 5 to 11 percentage points. These results,along with those for Company A discussed above, lead us to conclude that automaticenrollment participation rates are positively related to match generosity, but themagnitude of this effect is modest.Section I describes the savings plan and data for Company A. In Section II, weanalyze the impact of Company A’s change from a matching contribution to a noncontingent contribution. Section III examines the relationship between plan participationand the employer match amount at nine firms with automatic enrollment. Section IVconcludes.I. Savings Plan and Data for Company ACompany A is a Fortune 500 company in the information sector. We will considerthis firm’s employee savings outcomes from January 1, 2002 through December 31,2005. Table 1 lists the salient features of Company A’s 401(k) plan. Plan eligibility isrestricted to employees aged 21 or older. Full-time employees who satisfy this agerequirement are immediately eligible to participate, while part-time employees are4
eligible only after reaching one year of service and having worked 1,000 hours. Becauseof eligibility differences between full- and part-time employees, we restrict our analysisto full-time employees who are eligible for the plan.1 Throughout the sample period, fulltime employees were automatically enrolled in the 401(k) plan. After 30 days of service,employees who did not make an active enrollment election were enrolled at acontribution rate of 3% of salary allocated entirely to a money market fund. The planoffered six other investment options, including employer stock.Until December 31, 2003, the company made matching contributions at a rate of25% on employee contributions up to 4% of pay for employees who had attained at leastone year of service and 1,000 hours of work (thus, the maximum possible employermatch was 1% of pay). The maximum contribution rate over this time period was 25% ofpay. On January 1, 2004, the company discontinued the employer match and replaced itwith an employer contribution of 4% of pay plus an annual profit-sharing contributionthat was not guaranteed in advance. In 2004 and 2005, this profit-sharing contributionwas 5% of salary. The employer contributions in the new regime were not contingentupon the employee’s contributions. The company also reduced the maximum employeecontribution rate to 15% of pay at this time. Throughout the entire sample period,employees were also subject to IRS annual dollar contribution limits.2 Those employeesclassified as “highly compensated” for IRS non-discrimination testing purposes werepotentially subject to stricter contribution rate limits, and for this reason we exclude themfrom the analysis below.Our employee-level data come from Hewitt Associates, a large U.S. benefitsadministration and consulting firm. We have a series of year-end cross-sections of allCompany A employees from 2002 through 2005. These cross-sections containdemographic information such as birth date, hire date, gender, and compensation. Theyalso contain 401(k) variables such as the initial plan eligibility date, current participation1We do not observe full- or part-time status directly in our data. In order to screen out part-time employees,we eliminate those who did not become eligible for the plan within two months of hire. Even though fulltime employees were immediately eligible upon hire, we keep employees with up to a two-month eligibilitylag to allow for the possibility of administrative delays.2In the sample we analyze, only eight out of 645 employees contributed enough in a year to plausibly beconstrained by the IRS annual dollar contribution limits. The results we report below do not account forthis censoring, but they are unaffected if we exclude these eight employees from the analysis.5
status, initial plan participation date, a monthly contribution rate history, and year-endasset allocation and total balances.Our analysis compares two Company A employee cohorts. The “match cohort”contains plan-eligible full-time employees hired between January 1, 2002 and June 30,2003. The “no-match cohort” contains plan-eligible full-time employees hired betweenJanuary 1, 2004 and June 30, 2005. We exclude employees hired between July 1, 2003and December 31, 2003 because these employees were hired under the old regime(employer match), but the point at which we measure participation and contributionoutcomes for our analysis is after the switch to the new regime (a non-contingentemployer contribution). Because our primary outcome variables—plan participation andemployee contribution rates—are measured at six months of tenure, both cohorts arefurther limited to include only individuals whose employment at the company lasted forat least six months.Company A made several significant acquisitions during our sample period.Unfortunately, our data do not identify those employees who joined the firm as a result ofthese acquisitions. To minimize the potentially confounding influence of theseacquisitions, we make three further restrictions to our sample. First, we excludeemployees who lived in states where the acquired companies were headquartered.Second, we exclude employees whose initial appearance in our dataset does notcorrespond to their year of hire (e.g., we exclude employees who are first observed in ourdata in the 2004 cross-section but who are listed as being hired before 2004).3 Third, weexclude employees whose hire dates are revised by more than one calendar month acrossdifferent year-end cross-sections.Our final sample contains 645 employees: 293 in the match cohort and 352 in theno-match cohort.3We make one exception to this second criterion. There are 22 employees who first appear in our data inthe year-end 2003 cross-section with December 2002 hire dates. We include these employees in the samplebecause their absence from the 2002 data is likely due to administrative delays in processing newemployees at year-end rather than due to an acquisition.6
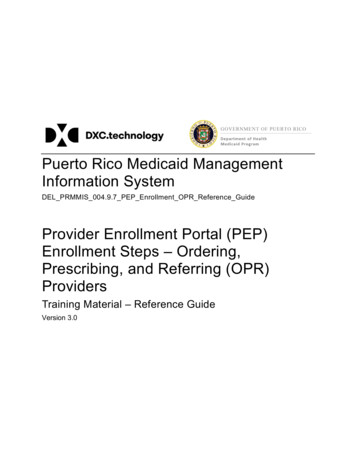
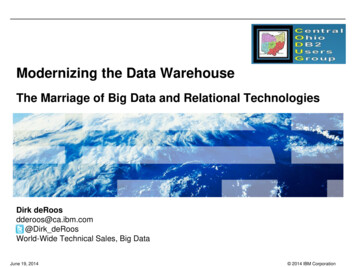
II. Savings Plan Outcomes under Automatic Enrollment with and without anEmployer Match: Company AWe begin our analysis by comparing means across the match and no-matchcohorts. We first consider plan participation, which we define as having a positive (nonzero) employee contribution rate. The first row of Table 2 shows that 89.1% of matchcohort employees were participating in the savings plan at six months of tenure. Incontrast, the six-month participation rate for the no-match cohort is 80.7%. This 8.4percentage point difference in participation rates across the two cohorts is statisticallysignificant and relatively stable from two months of tenure onward. The second row ofTable 2 shows average employee contribution rates at six months of tenure (includingnon-participants with a contribution rate of 0). Given the decline in plan participation, itis not surprising that the average contribution rate also falls from 3.60% to 2.89% ofsalary after the elimination of the employer match. This 0.71% drop is statisticallysignificant and driven both by the participation decline and a reduction in the averagecontribution rate conditional on participation from 4.04% to 3.58% of pay. The 0.46%drop in the conditional average contribution rate, however, is only statistically significantat the 10% level and is partly explained by the concurrent reduction in the maximumallowable contribution rate from 25% to 15% of pay.Figure 1 shows the distribution of employee contribution rates at six months oftenure for the two cohorts separately. We see that the transition from the employer matchto the non-contingent contribution was associated with a decrease in the fraction ofemployees contributing at most positive rates.4 More than two-thirds of employees inboth cohorts contribute at the 3% default contribution rate, consistent with previousresearch on how automatic enrollment affects the employee contribution rate distribution(Madrian and Shea, 2001; Choi, Laibson, Madrian, and Metrick 2002, 2004; Beshears,Choi, Laibson and Madrian, 2008). In contrast to previous research, we observe very fewemployees contributing at the 4% match threshold (only 2% of employees in the matchcohort and 1% of employees in the non-match cohort for whom the match threshold is nolonger relevant). There are several plausible explanations for why so few employees in4The decline in the fraction of employees contributing at a rate greater than 15% in the non-match cohort isan artifact of the reduction in the maximum allowable contribution rate from 25% to 15% of pay thatcoincided with the switch from a matching contribution to a non-contingent contribution.7
the match cohort are at the match threshold. First, the employees at Company A areobserved at only six months of tenure, which does not give them much time to switchfrom the default contribution rate to the match threshold (or another contribution rate oftheir choosing). Second, because the match threshold was only one percentage pointabove the default rate, participants’ incentive to increase their contribution rate to thematch threshold was much weaker than in other firms studied (Choi, Laibson, Madrian,and Metrick, 2005). Finally and perhaps most importantly, employees were not eligible toreceive matching contributions until having completed one year of service, so most of thebenefits from contributing at the match threshold did not accrue to employees at sixmonths of tenure.Of course, the transition from an employer match to a non-contingent contributionmay have been accompanied by other changes at Company A that caused the savingsplan choice differences between the two cohorts. Table 2 shows that relative to the nonmatch cohort, the match cohort was disproportionately female, somewhat older, and hada higher average salary.5,6 Not controlling for these differences could make theparticipation decline due to the employer match elimination look larger than it really was.Table 3 shows the results of regressions that include demographic explanatoryvariables. The first two columns show the coefficients from a linear probabilityregression of savings plan participation at six months of tenure on an indicator for havingbeen hired with an employer match in place, gender, age, and income in 2004 dollars. Incolumn 1, we control linearly for age and income, whereas in column 2 we include ageand income splines.7 The estimated 6.0 to 6.7 percentage point participation impact ofhaving a match is statistically significant and somewhat lower than the raw 8.4percentage point difference seen in Table 2. A probit specification (columns 3 and 4)yields estimated employer match marginal effects of 5.4 to 6.5 percentage points, also5We deflated the salaries of employees in both cohorts to 2004 dollars using the growth in seasonallyadjusted average weekly earnings for private sector workers from the Current Employment Statisticssurvey.6Part of the difference in average age and income between the cohorts might be the result of an internshipprogram that took place in the second half of the sample period. Compared to other employees, internsprobably have weaker motives to participate in the 401(k) plan. To make sure that the presence of interns isnot driving our results, we drop the 29 employees in the sample with incomes of less than 10,000 and redoour analysis. The qualitative results do not change.7The age spline has knots at 30, 40, and 50 years, and the income spline has knots at 20,000, 40,000, 60,000, and 80,000.8
statistically significant. Columns 5 and 6 list the marginal effects from a tobit regressionof employee contribution rates which are censored below at zero and above at 25% (thematch cohort) or 15% (the non-match cohort). Eliminating the employer match atcompany A is associated with a contribution rate decline of about 0.66% of salary, aneffect that is statistically significant and only slightly less than the 0.71% raw effect inTable 2.In summary, controlling for demographic differences between the match and nonmatch cohorts reduces but does not eliminate the estimated impact of the employer matchunder automatic enrollment. Note that these estimates represent the combined effect ofremoving the match and replacing it with a non-contingent contribution. The replacementof a match with a (relatively larger) non-contingent contribution generates a substitutioneffect that discourages employee contributions and a net income effect that alsodiscourages employee contributions. Employee contributions are no longer subsidizedand the employee has more total savings (employee plus employer contributions) for anygiven employee contribution.8 Our estimates provide an upper bound of the effects duesolely to the removal of the employer match, since the simultaneous introduction of thenon-contingent employer contribution generates an income effect that suppressesemployee contributions.9Our analysis also sheds light on the question of savings crowd-out. Our estimatesprovide an upper bound on the negative participation effects due solely to theintroduction of the non-contingent contribution, since the simultaneous elimination of thematch is likely to have discouraged employee participation.10One limitation of many savings studies that use administrative data is the inabilityto address potentially offsetting (or reinforcing) changes in savings behavior outside ofthe account being studied. This caveat applies here as well. Employees have additional8The employee loses a 25% match on contributions up to 4% of income but gains both a non-contingentemployer contribution equal to 4% of income and a non-contingent profit-sharing contribution.9On the other hand, there are some plausible reasons that the introduction of the non-contingentcontribution could increase employee contributions. Employees might view it as a signal that theirexpected future income growth has fallen. Alternatively, employees could interpret the non-contingentcontribution as implicit advice that their optimal savings rate is higher than they previously believed.10A match unambiguously increases participation in a two-period model. Opposite effects are possible inmodels with more periods. However, the empirical literature on matching generally finds positiveparticipation effects. Note that even in a two-period model, matching need not increase the averageemployee contribution due to the substitution effect.9
assets outside their 401(k) plan, and some employees also have other savings plan assetswithin Company A, which has an employee stock ownership plan (ESOP). However,most of the employees in our non-match sample are not eligible to participate in theESOP (employees must have one year of service to be eligible). Moreover, the plan isnon-elective; the company makes ESOP contributions on an annual basis to allemployees who are eligible. With more years of data, it might be possible to assess theextent to which changes in ESOP balances across the two cohorts affect employees’401(k) choices at company A.11 Unfortunately, the data are not presently available toundertake such an analysis, and we do not observe any other financial assets of thiscompany’s employees.III. Employer Matching Level and Savings Plan Participation under AutomaticEnrollment at Nine CompaniesWe now broaden our analysis to explore the relationship between the generosityof the employer match and savings plan participation under automatic enrollment at ninecompanies. We use variation in the employer match structure both within and acrossfirms for identification. However, because of the potential existence of firm-level omittedvariables, the results below must be interpreted with caution.Table 4 describes the match structure at the nine companies used in our analysis.The match rate varies from no match at Company A (beginning in 2004 for the nonmatch cohort) to a 133% match on the first 6% of pay at Company I. Conditional onoffering a match, the match threshold ranges from 2% of pay for employees with lessthan one year of tenure at Company F to 7% of pay at Company B. Two companies havechanges in their employer match over our sample period: Company A (analyzed inSections 2 and 3), which replaced its employer match of 25% on the first 4% of paycontributed with a non-contingent employer contribution in January 2004; and CompanyB, which gradually increased its match rate from 60% to 62% to 65% on the first 7% ofpay contributed.11Madrian and Shea (2001), who first documented large participation increases following automaticenrollment in a 401(k) savings plan, find no evidence of offsetting savings behavior in the Employee StockPurchase Plan (ESPP) of the company they studied.10
For this section’s analysis, we use data that are identical in structure to theCompany A data described in Section 2. We pool employees at the nine firms who areobserved in at least one of the year-end cross-sections from 2002 through 2005.12 Oursample is limited to employees at these firms who meet the following criteria: theybecame eligible for their employer-sponsored savings plan between January 1, 2002 andJune 30, 2005; they became eligible when they were between 21 and 65 years of age;they became eligible when automatic enrollment was in effect; and they did not leave thecompany within six months of becoming eligible. Unlike the analysis in Sections 2 and 3,we do not attempt to filter out part-time employees because we are unable to identifythem for some of the companies. We also do not exclude “highly compensated”employees because we are only analyzing plan participation, a margin on which suchemployees do not face greater constraints than non-highly compensated employees.To assess the relationship between the employer match and savings planparticipation under automatic enrollment, we run a linear probability regression ofsavings plan participation at six months of eligibility on age, income in 2004 dollars,gender, and the generosity of the employer match.13,14 Our key dependent variable ofinterest is the maximum employer match (as a fraction of income) that a participant canreceive by contributing at the match threshold and fulfilling all match-related servicerequirements, given the match structure in place at six months of eligibility. Themaximum employer match does not necessarily correspond to the matching contributionan employee could receive after only six months of eligibility. For example, themaximum employer match as just defined at Company D is 4.2% of pay (a 70% match onthe first 6% of pay), even though employees with less than one year of tenure can receivea match of at most 2.1% of pay (a 35% match on the first 6% of pay). Table 4 lists themaximum employer match used in our regression for each of the nine firms.12Three firms did not have data available for all four years. We drop three additional firm-years becausedifferent employees within a company were offered different matches in these years and we are unable toidentify which employees were offered which match.13Even though our dependent variable is binary, we use a linear probability regression rather than a probitin order to facilitate the graphical display of the results in Figure 2.14Instead of measuring participation at six months of tenure, as done earlier for Company A, we measureparticipation after six months of eligibility because some firms’ employees are not immediately eligibleupon hire. For most employees in the sample, however, six months of tenure and six months of eligibilityare equivalent.11
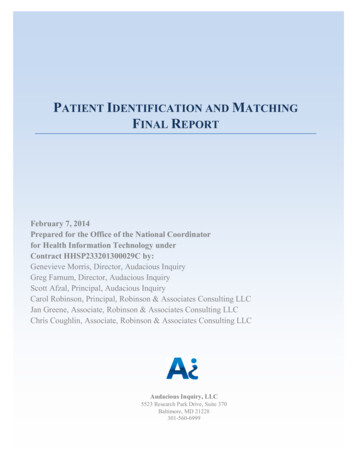
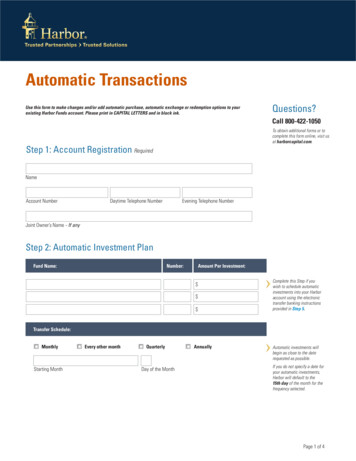
Our employer match variable definition rests on the assumption that employeesare forward-looking with respect to the match when making their decision about whetherto opt out of savings plan participation under automatic enrollment. Given that the servicerequirement to obtain the maximum employer match is at most one year in our sample,we feel that this assumption is appropriate. Only three of our nine firms (Companies A,C, and H) have matches linked to tenure. We also assume that the match rate changeswithin companies A and B were surprises that were not known to employees in advance,since we define the maximum employer match using the match structure in place at thetime we measure participation.Because our maximum employer match variation is largely across-firm variation,we are precluded from putting firm-level fixed effects in these regressions. We do,however, calculate Huber-White standard errors with clustering at the firm level.Column 1 in Table 5 gives the coefficient estimates from the regression describedabove when no other control variables are included. In this specification, decreasing themaximum employer match by 1% of salary is associated with a plan participationreduction at six months of eligibility under automatic enrollment of 2.8 percentage points.This is somewhat smaller than the 5 to 6 percentage point decline observed at CompanyA when it eliminated its employer match. However, as noted earlier, the Company Aestimate is an upper bound on the true effect of match removal, since the match wasreplaced with a non-contingent employer contribution that is theoretically expected todecrease participation.Figure 2 displays the regression results from the first column of Table 5graphically. Every data point in Figure 2 corresponds to a group of employees that sharesthe same firm and maximum employer match (firms whose match changes over time arerepresented in the graph by more than one data point). The maximum match is on the xaxis, and the raw savings plan participation rate is on the y-axis. The regression line fromthe first column of Table 5 is also shown. Figure 2 shows that the positive relationshipbetween the maximum match and participation estimated in Table 5 is robust and doesnot seem to be driven by outliers.12
In column 2 of Table 5, we add control variables, using linear splines for age andincome as well as indicator variables for missing gender, age, and income data.15 Theinclusion of demographic controls reduces the estimated impact of the employer matchslightly: decreasing the maximum employer match by 1% of salary is associated with a2.2 percentage point decline in participation, rather than the 2.8 percentage point declineshown in column 1.Most of the individuals for whom gender, age or income data are missing comefrom three firms. Therefore, we restrict the sample in column 3 to the six firms for whichwe can construct demographic controls.16 When we run the regression without controlvariables—as in column 1—on this restricted sample, the estimated impact of theemployer match increases relative to that in column 1; participation declines by 3.8percentage points when the maximum match decreases by 1% of pay. This suggests thatthere are some differences between the companies in our sample for which we do and donot have demographic data.Finally, in column 4, we add the demographic control variables to the regressionrestricted to companies with demographic information. Just as in the full sample, addingdemographic controls to this restricted sample reduces the estimated impact of theemployer match. Across all of the specifications in Table 5, the coefficient on themaximum employer match ranges from 1.8 to 3.8, indicating that decreasing themaximum employer match by 1% of salary reduces savings plan participation at sixmonths of eligibility under automatic enrollment by 1.8 to 3.8 percentage points.IV. ConclusionsAutomatic enrollment is an incre
We thank Hewitt Associates for their help in providing the data. We are particularly grateful to Pam Hess, Yan Xu, and Lori Lucas at Hewitt for their help with this project. . contribution rate of 3% of salary allocated entirely to a money market fund. The plan offered six other investment options, including employer stock. Until December 31 .