Transcription
Community collegeenrollment crisis?HISTORICAL TRENDS IN COMMUNITYCOLLEGE ENROLLMENT
Table of ContentsExecutive Summary.1Introduction.1Community College Enrollment Trends.2State Trends.10Community College Enrollment in Context.11High School Graduates.13Conclusion.15Appendix.16
Executive SummaryCommunity college enrollments mostly grew during the first decade of the 21st century, accelerating rapidly at the endof that decade as the Great Recession hit. Since a peak enrollment in 2010, the total community college enrollment hasdecreased each fall, declining by more than 1 million students nationally (14.4% ) between 2010 and 2017.Over the course of the 17 years studied in this paper, there were important differences in the enrollment trends fordifferent segments of community college populations. A few key trends include: Full-time student enrollment declined at a faster pace than did the part-time student enrollment between 2010 and2017. All age groups showed declines in enrollment between 2010 and 2017 with the exception of students under the ageof 18. This is largely due to the rapid increase of high school students enrolling in community college classes. While always a majority, women have decreased their share of the community enrollment since their highestrepresentation in 2004. White students were no longer the majority of students enrolled nationally in community colleges in the fall of 2014. While White student enrollment has steadily declined since 2010, non-White student enrollment has remained relativelysteady since 2012—largely driven by increases in Hispanic students. Analysis of state data suggests that enrollments have regional variations. Two states with College Promise programsshowed enrollment increases corresponding with implementation of their state-wide free-tuition programs While enrollment in community colleges has seen decreases since 2010, 4-year public colleges, and to a lesser extent4-year independent colleges, have not seen decreases. Finally, the paper highlights a few other trends that are related to community college enrollment, suggesting that thenumber of high school graduates and college continuation rates of those students may have impacts on communitycolleges.IntroductionCommunity college enrollment has been in decline nationally since peaking in 2010. This report will put the recentcommunity college trends into perspective by reviewing community college enrollment from 2001 through 2017, and byexamining concurrent trends that are related to community college enrollments. This report will provide the reader witha better understanding of enrollment changes for students with different characteristics (such as age, gender, or race andethnicity) as well as by enrollment intensity. In addition, community college enrollment trends will be compared to othersectors of higher education. Furthermore, this report will examine enrollment trends in the context of other national, nonhigher education trends such as unemployment rates and high school graduation rates to better understand the trendswe are seeing in community college enrollment.About the dataThe majority of the data used in this report comes from the Fall Enrollment Survey of the Integrated PostsecondaryEducation Data System (IPEDS). All institutions that participate in the federal financial aid program are required to submitdata to the U.S. Department of Education (ED) through IPEDS. IPEDS collects information on a range of postsecondarytopics including graduation rates, finances, human resources, completions, and enrollment. For the purposes of this1
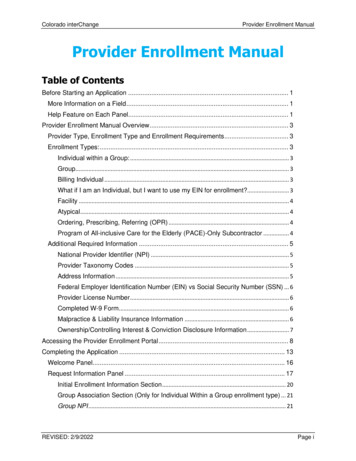
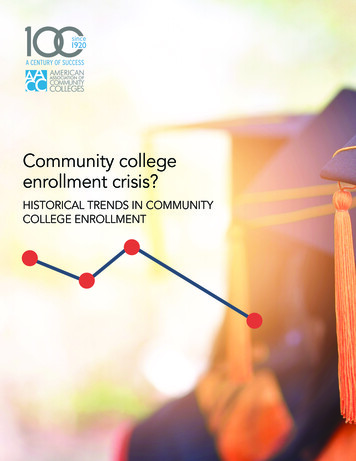
paper, the annual Fall Enrollment Survey was used as the primary data source. Data from each year were used to look atenrollment trends across a 17-year period. One exception to the annual use of data was on enrollment by age, as thisdata is only required to be reported by institutions every other year.Several other sources of national and federal data–to the extent possible–were used to provide a context for theenrollment data. Data sources include the monthly unemployment rate from the Bureau of Labor Statistics (BLS), highschool graduation counts and projections, and high school graduation rates from the National Center for EducationStatistics (NCES).Defining Community CollegesFor the purpose of this analysis, community colleges are defined as regionally accredited institutions, which primarilyaward the associate degree as their highest award. As a result of using this definition, community colleges in this reportwill include colleges that offer a limited number of baccalaureate degrees, such as Miami Dade College in Florida orBellevue College in Washington. Using this definition also means that community colleges in this analysis will excludeassociate degree-granting institutions which do not hold a regional accreditation (such as Reid State Technical Collegein Alabama which is accredited by the Council on Occupational Education). These data, therefore, will not be consistentwith data as generally reported by the U.S. Department of Education’s NCES. NCES generally reports colleges basedon the highest degree the institution offers, and does not use regional accreditation as a demarcation for communitycolleges. For more details on the process for defining and analyzing the data presented here, please contact the author.Community College Enrollment TrendsThousandsData discussed in this report tracks community college enrollment over a 17-year period, from the fall of 2001 to the fallof 2017. Figure 1 displays the fall headcount enrollment (the number of students enrolled at a specified period of timein the fall term of each institution) in community colleges from fall 2001 through fall 2017. These data show an increasein enrollment in the early part of the century,Community college enrollment: 2001 to 2017increasing by 5% between 2001 and 2002.9,000The rate of enrollment increase slowed to8,000a 0.7% average annual increase between7,0002002 and 2006 (2.8% total for the period).Between 2006 and 2010, enrollments6,000spiked to a record high of more than 85,000million students, increasing by 20.3% overthis period, or 4.8% annually. Community4,000college enrollment has been declining since3,000their peak in 2010 by an average of 2.2%2,000each year, or 14.4% over the course of the7 years. Enrollment in 2017 was still greater1,000than 2006, but was less than the level 201320142015201620172007.Figure 12
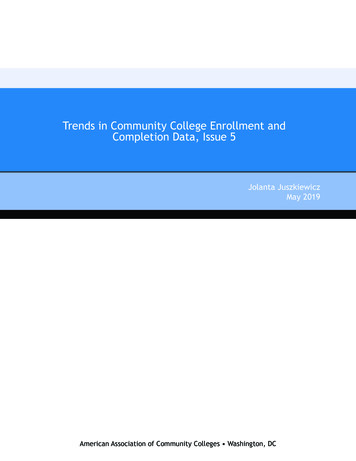
Recently released enrollment estimates for the fall of 2018 from the National Student Clearinghousei indicate thatcommunity college enrollments declined an additional 3.2% from the prior year, which would be below 2006 levels.Community college professionals frequently claim that the economy is an important driver of community collegeenrollments. Of particular note during the time period investigated is the Great Recession, which economists indicatebegan in December 2007. While the recession technically ended in the second quarter of 2009, solid job growth was notseen until 2011.To demonstrate the relationship between community college enrollment and unemployment, Figure 2 plots the nationalunemployment rate against the fall headcount enrollment of community colleges. The data in this figure demonstrates apattern of enrollment that, to a large degree, mirrors the unemployment rate of the country. It is clear in this chart that theGreat Recession, and its lingering impact on the U.S. economy and jobs, had a strong relationship to community collegeenrollment, which peaked at more than 8 million students in fall of 2010—10 months after the peak unemployment rateof 10%. The data also show an increased enrollment in the early part of the 2000’s that was reflective of the early 2000srecession and subsequent unemployment rate. While the unemployment rate and economy are not the only drivers ofcommunity college enrollment (several other issues will be explored later in this paper), it is a critical factor to considerwhen analyzing community college enrollment.To better understand the enrollment trendsacross the 17 years investigated, this paperlooks at key student characteristics availablefor analysis. Analysis of these trends revealsinteresting differences for different studentpopulations across the years nemployment 01520162016201720172017Figure 3 shows the distribution of communitycollege enrollment by attendance status--full-time or part-time enrollment. The dataindicate that during the enrollment surge of2007 through 2010, the share of studentswho attended full time also increased, from40.9% in 2007 to 42.5% in 2010. Followingthe peak in 2010, the ratio of full-timestudents steadily decreased to a low of36.6% in 2017.12%9,000,000Fall Headcount EnrollmentEnrollment StatusCommunity college enrollment and national unemployment rate:2000-2017Fall Enrollment0%Unemployment RateFigure 2One measure of community college attendance frequently used to determine funding levels for community collegesis full-time equivalency (FTE)ii. FTE calculates enrollments where full-time students are equal to one FTE, while parttime students account for a fractional portion of an FTE based on their credit load. As a result of the decrease in totalenrollment, and full-time enrollment decreasing at a faster pace than part-time enrollment, FTE enrollment between3
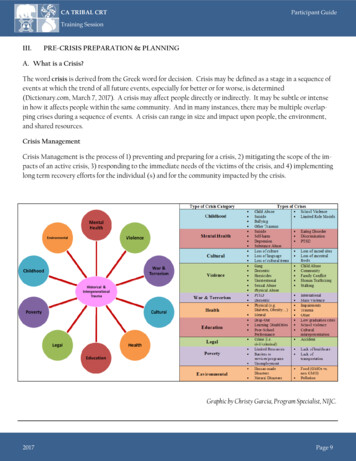
2010 and 2017 decreased at a faster pacethan headcount enrollment. Therefore, theimpact on FTE-driven community collegefunding was even greater than if funding wasbased on fall headcount enrollment alone.Percent of community college enrollment that is fulltime: 2001-201750%45%40%35%Age30%25%Community colleges have always hada diversity in the age range of studentsattending. Across the time period investigated in this report, enrollment trendsshowed considerable variation for differentage groups. Traditional-aged students (18 to21 years of age) make up the largest portionof community college students. As shown inFigure 3Figure 4, the traditional age group showedincreases in enrollment from 2001 to peak enrollment of 3.14 million students in 2009. Since 2009, enrollment for this agehas declined by around 283,000, or about 9.0%. The next age group (22-29-year-olds) showed a more gradual increasein enrollment from 2001 and maintained enrollment increases through 2011, then declined. The 30-49-year-old grouphad a different enrollment pattern over the past 17 years. The enrollment for this age group declined from 2003 to 2007,jumped up in 2009, then declined precipitously from 2011 to 2017. This age group saw a 34% enrollment decreasebetween 2011 and 2017. The only age group showing an increase after 2011 was students who were less than 18 yearsold. This age group increased by more than 350,000 between 2009 and 2017, or an increase of 0102011201220132014201520162017Community college enrollment by age: 2001-2017 (odd numbered years)ThousandsFigure 5 represents the same data, but showsthe distribution of the total enrollment by agegroup. Of note in these data is the steadydecline of 30-49-year-olds as a proportionof the student population, and the rise ofthe 18-21-year-olds and 22-29-year-olds asa proportion of the population. Importantly,even though the 18-21-year-old studentssaw a significant numerical drop the last fewyears (decreasing by around 283,000), thisgroup of students increased as a percentageof the overall population (more than 40%of all students in 2017). Stated differently,even though traditional-aged students aredecreasing in numbers, they are increasingin their importance for community 00500-200120032005Less than 18200718 to 21200922 to 29201130-4920132015201750 or olderFigure 44
To get a deeper appreciation of the trendsin enrollment by age, enrollment trends ofthe selected age groups were separated byenrollment intensity (see Figures 6-10).Distribution of community college enrollment by age: 2001-2017 (odd numbered years)45%40%35%One of the most striking findings is the 30%dramatic and continuing rise in enrollment25%for the less-than-18-year-old students whowere enrolled part time (Figure 6). In fact, 20%the number of part-time students less than 15%age 18 dramatically increased, going from10%287,000 in 2001 to more than 773,000by 2017—an increase of 170%. This age 5%group saw a much less dramatic, but se in the number of students attendingLess than 1818 to 2122 to 2930-4950 or oldercommunity college full time. While the datado not allow us to determine whether theseFigure 5students have graduated from high school,there is strong evidence that these students are predominantly dual enrolled students—students enrolled in collegeclasses while still enrolled in high school. Data from a separate NCES research studyiii indicated that in the 2010-11academic year, there were more than 873,000 students enrolled in formal community college dual enrollment programs,and another 106,000 high school students taking community college credits outside of dual enrollment programs. Thisestimate of 980,000 high school students was based on the full academic year, not just fall enrollment However, if thetrend represented by the fall enrollment data are projected onto the 980,000 students enrolled in 2010-11 academic year,then approximately 1.6 million high schoolstudents took community college creditsLess-than-18-year-old community college enrollment by enrollment status: 2001-2017 (oddnumbered years)during the 2015-16 academic year.900,000The trends for traditional-aged students(students aged 18-21) shown in Figure 7stand apart for several reasons. First, this theonly age group where full-time enrollmentis greater than part-time enrollment—forall other age groups, students are morelikely to be enrolled part time. Second, withthe exception of the less-than-18-year-oldgroup, it is the only age group where parttime enrollment has remained relativelysteady since 2011. However, the gapbetween the number of part-time and fulltime students in 2017 was the smallest since800,000700,000600,000500,000400,0003 011201320152017Full-timeFigure 65
18-21 year old community college enrollment by enrollment status: 2001-2017 (odd numberedyears)22-29 year old community college enrollment by enrollment status: 2001-2017 (odd timeFigure 920132015201750 years or older community college enrollment by enrollment status: 2001-2017 (oddnumbered years)1,400,00020032011Full-timeFigure 830-49 year old community college enrollment by enrollment status: 2001-2015 (odd numberedyears)20012009Part-timeFigure 09Part-time2011201320152017Full-timeFigure 102001. Stated differently, the number of traditional-aged students attending part-time has been a consistent segment ofcommunity college enrollment in recent years, while full-time traditional-aged students have been decreasing (down bymore than 392,000 students between 2009 and 2017). If this trend continues, part-time students will outnumber full-timestudents for this age group in the future.For students aged 22-29, enrollments patterns were similar for part-time and full-time students—increasing in numberthrough 2011, then declining through 2017 (Figure 8). While the pattern was similar for the two groups, the rate ofincrease entering the Great Recession was steeper for full-time students, and the decline after 2011 more rapid forfull-time enrollees. Given the high unemployment rate in at the end of the recession, one possible explanation for theincrease for this age group is the need for upskilling or retraining for displaced workers. Part-time enrollment wouldrequire a longer period of enrollment to attain a credential, or similar experience, and therefore may account for theslower decline in enrollment for this aged population.While the enrollment trend shown for students aged 30-49 attending full time mirrored that of students aged 22-29(Figure 9), it even more clearly tracked with the periods of higher unemployment rates during the two recessions of the2000s noted earlier in this report (see Figure 2). The data suggest that the population of individuals aged 30-49 who are6
displaced from employment may be particularly likely to enroll full time at community colleges. However, unlike the nextyounger age group, this age group did not show increases for part-time enrollment in the early part of 2000s, did havea slight increase in 2009, but then continued the decreases shown earlier in the 2000s.Enrollment for individuals aged 50 or older (Figure 10) was the smallest age group enrolled in community colleges,reaching a peak enrollment of nearly 400,000 students in the fall of 2009 (by contrast, there were more than 3.1 milliontraditional-aged students in fall of 2009). The enrollment trend for this age group was similar to the students aged 30-49.Part-time enrollment peaked in 2009 for this age group, and declined consistently each of the following years. Full-timeenrollment for this group did not peak until fall of 2013, however the number enrolled full time was relatively small withapproximately 73,000 students.GenderOver the course of the years studied in this paper, female enrollment has out-paced male enrollment in communitycolleges. The distribution of enrollment by gender has been relatively stable, ranging from a high of 58.7% femaleenrollment to a low of 56.3% female enrollment (Figure 11). The trend line, however, does provide some interestingdata. Women increased their share of enrollment from 2001 to 2004 to a high of 58.7%. The share of community collegeenrollment that was female declined during the remainder of the period investigated, with the exception of 2011, andultimately reached its lowest proportion of enrollment at 56.3% in 2016. As a point of reference, this chart also shows thepercent of undergraduates in the rest of higher education who are female. Females comprise a greater percentage of allundergraduate enrollment, and females make up a higher percentage of community college enrollment than is seen inother degree-granting institutions.Race / EthnicityPercent of college enrollment that is female: 2001-201559.0%This section investigates the trends incommunity college enrollment by theracial and ethnic background of students.When reviewing these data it is importantto note that the way racial and ethnic datawere collected by the U.S. Departmentof Education changed between 2008 and2010. As a result, the trends may in part bean artifact of the changes in how data werecollected and 6.4%56.0%55.0%54.0%Key changes instituted at that time 102011201220132014201520162017Community CollegeNon-community collegecolleges reporting students with morethan one race as a separate category andFigure 11classifying students as Hispanic if theyindicate they are of Hispanic ethnicity,regardless of their race. As a result, students who report more than one race would previously have been in one of therace categories, and will no longer be in that category, but will appear in the “more than one race” category. Or, for7
example, students who indicate that they are Hispanic andBlack or Native American will be included in the “Hispanic”classification, not in the Black or Native American categories.There is no way to determine the extent these changes impactthe trends, so readers are urged to consider these definitionalchanges when interpreting these findings.Distribution of community college enrollment White students and all other students:2001-201770.0%60.0%50.0%40.0%30.0%In reviewing the 17-year trends, one of the most notable trends isthe steady decline of White students as a percentage of studentsenrolled in community colleges (Figure 12). The percentage ofthe community college enrollment that is White dropped froma high of 60% in 2001 to 46.2% in 2017. In terms of the numberof students, the number of White students peaked in 2010,similar to the overall trend for community college enrollment.However, the overall 17-year trend reflected a decrease of morethan 581,000 (15%) White students between 2001 and 2017,while enrollment for all other students increased by more than1.2 million (48%) over the same period. As shown in Figure 13,enrollment in community colleges for non-White students hasbeen level over the four most recent years, suggesting that thedrop of White student enrollment is a significant factor in theoverall decrease in community college enrollment from 2012 to2017.Figure 14 highlights the distribution of non-White enrollmentfrom 2001 to 2017. The most striking trend is the steadyincrease in the percent of Hispanic students enrolled incommunity colleges. In 2001, Hispanic students were 13.9%of community college students, and by 2017, they made upnearly a quarter (24.9%) of community college enrollments.In terms of raw numbers, Hispanic student enrollmen nearlydoubled, increasing by 98% between 2001 and 2017, anddespite the overall decline in enrollments at communitycolleges between 2010 and 2017, Hispanic enrollmentsincreased each year across that 62017All other studentsFigure 12Community college enrollment White students and all other students: 0120022003200420052006200720082009All other Students201020112012201320142015WhiteFigure 13Non-White community college enrollment by race and ethnicity: 2001-201730.0%25.0%20.0%15.0%10.0%Following students of Hispanic origin, the next largestminority enrollment group in community colleges was AfricanAmerican students. In 2011, African American students hadtheir highest enrollment (1.17 million students) and had their5.0%0.0%200120022003Native American200420052006Asian or Pacific Islander20072008Black2009Hispanic201020112012More than One race20132014Unknown201520162017Non Resident alienFigure 148
largest proportion of community college enrollments (14.6% of all students). Since that time, the number of AfricanAmerican students has decreased to around 890,000 in 2017, comprising only 12.7% of community college enrollments.Students who indicated they were of Asian and Pacific Island descent represented approximately 6% of the communitycollege population. Their proportion of community college enrollment fluctuated somewhat across the 17-year periodfrom a low of 5.6% in 2011 to a high of 6.3% in 2001 and 2007. The number of Asian and Pacific Island students peakedin 2009 at 472,000, declining the next 4 years to 425,800 and remaining relatively flat into 2017.While the percentage of Native American students has remained relatively constant, it has slowly decreased over the 17year period from a high of 1.3% in the early 2000s, to 1.0% in 2017. In 2009, nearly 97,500 community college studentsindicated they were Native American, but by 2017 the number had dropped to 68,000.As noted above, the category of more than one race was first collected for fall of 2008. It was optional in 2008 and 2009as colleges transitioned to the new race and ethnicity categories, and this is reflected in the data reported. Since thisdata element was first collected, students who reported that they were more than one race has shown a steady increaseboth in terms of the percentage of community college students (to a high of 3.4% in 2017) as well as the overall numberof students (to a high of 240,000 in 2017).Non-resident alien studentsiv are fewer than 2% of the total community college enrollment. In 2017, approximately121,000 community college students were non-resident aliens—below their peak enrollment 2 years earlier. Non-residentalien students constituted their smallest share of community college enrollment in 2011 at 1.3%.The enrollment trends reported above represent the total enrollment in community colleges each fall. Another way tolook at the trend in diversity in community colleges is to look at first-time attendees—students new to postsecondaryeducationv. While the data tend to mirror the total population of students attending community colleges, as demonstratedin Figure 15, the trend line for WhitePercent of first-time community college students who were White, Hispanic or Africanstudents and Hispanic students is even moreAmerican: 2001-201570%dramatic for first-time students than for thepopulation as a whole. The percentage of60%first-time students at community collegeswho are White has decreased from 61%50%in 2001 to 43% in 2017. The percent of40%first-time students who are Hispanic hasalmost doubled during this same time30%period, and now represents more than a20%quarter (27%) of all students who begin incommunity colleges. It also is notable that10%the percentage of first-time students 01220132014201520162017are Black has consistently been higher thanWhiteHispanicBlacktheir representation in the total enrollment.In other words, Black students are more likelyFigure 15to be first-time in college than a returningstudent in community colleges.9
State TrendsEnrollment trends also were analyzed at the state level to see if there were any noticeable trends by states. Analysis ofstate trends was limited to the public community colleges in each state. There are a number of ways state policies canimpact community college enrollments, such as tuition and fee policies for public colleges, student aid policies for publiccolleges—particularly College Promise type programs, transfer and articulation policies, state funding to communitycolleges, and a variety of other policies. Exploring all of these is beyond the scope of this paper, but it is useful to get asense of the enrollment trends for the last 8 years—from before the recession in 2007 to the most recent data available(2017).Between 2016 and 2017, total community college enrollment decreased by 1.4%. However, this enrollment declinewas not consistent across all states. During this period, 36 states had decreases in community college enrollment and14 states saw increases in community college enrolment. Texas saw the largest numeric increase (10,300) and Idahothe largest percentage increase (5.3%) increase in the last year of data available. On the negative side, Georgia sawthe largest numeric (20,800) and percentage (12.6%) decrease. However, it is important to note that Georgia has beenconsolidating community colleges into their universities, and some of the enrollment decline has to do with colleges nolonger reporting their data as community colleges. Illinois had the second largest numeric decrease (10,770) from thefall of 2016 to fall of 2017.Nationally, public community college enrollment in 2017 was slightly higher than it was in 2007—before the impacts ofthe recession. Looking at the trends for all 50 states, 7 states reported fall enrollment at a lower rate in fall 2017 than wasreported in 2007. Utah had the largest percentage decrease in enrollment with a difference of 26% fewer students (about15,600 fewer students) in 2017 than reported in 2007; however it is important to note that this was in part due to collegesmoving from community college status to predominantly baccalaureate degree granting status. Kentucky also had alarge drop in enrollment (26% decrease) from 2007 to 2017. California had the largest drop in the number of studentsat 38,500 during this time period; however, it only represented a 3% drop in enrollment from their 2007 enrollment.Alaska also showed significant drops in enrollment over this time period, but that was largely due to the fact that collegeschanged from community colleges to 4-year colleges in this timeframe—resulting in a decrease in community collegeenrollments for the state.Of the states with higher enrollment in the fall of 2017 compared to 2007, Louisiana had the largest percentage netincrease with 30% more students); however, fall 2007, enrollments in Louisiana were deflated as they had not reboundedfrom the effects of Hurricane Katrina in 2005. There were several other states that also had enrollments well above thepre-recession enrollment spike.Maine’s enrollment numbers were 23% higher in 2017 than in 2007—the next largest percentage gain. Of the othercolleges that had higher 2017 enrollments than they did in 2007, Texas had the highest net gain in number of studentsat 140,100, which was 22% higher than 10 years earlier. Other states that had maintained enrollment rates above prerecession levels were Colorado (20%), and North Dakota, South Dakota, and Fl
data to the U.S. Department of Education (ED) through IPEDS. IPEDS collects information on a range of postsecondary topics including graduation rates, finances, human resources, completions, and enrollment. For the purposes of this 1. 2 paper, the annual Fall Enrollment Survey was used as the primary data source.