Transcription
A Report from the University of Vermont Transportation Research CenterVermont Bicycle and PedestrianCounting ProgramFinal ReportTRC Report 17-006November 2017Karen Sentoff & James L. Sullivan
UVM TRC Report # 17-006Vermont Bicycle and Pedestrian Counting ProgramNovember 28, 2017Prepared by:Karen SentoffJames SullivanTransportation Research CenterFarrell Hall210 Colchester AvenueBurlington, VT 05405
UVM TRC Report # 17-006AcknowledgementsThe authors would like to acknowledge VTrans for providing funding for thiswork.DisclaimerThe contents of this report reflect the views of the authors, who areresponsible for the facts and the accuracy of the data presented herein. Thecontents do not necessarily reflect the official view or policies of the UVMTransportation Research Center. This report does not constitute a standard,specification, or regulation.i
UVM TRC Report # 17-006Table of ContentsAcknowledgements . iList of Tables . ivList of Figures . ivExecutive Summary. viiCount Database Development . viiWeb Portal and Data Input Tool Development . xiGap Analysis and Selection of New Count Sites . xiiiComparison of Automated Infrared Counts and Video Manual Counts . xivComparison of Strava Metro Data and Count Summary Data. xivConclusions and Recommendations . xv1Introduction . 12Best Practices in Count Data Management . 43452.1Count Data Programs . 42.2Count Location Selection . 52.3Methods for Counting Bicyclists and Pedestrians . 72.4Data Protocols and Management . 102.5Public Portals . 13Description of Data . 193.1Data Gathered from Other Sources. 193.2Data Collected During this Project . 31Methodology . 354.1Database Development and Estimation of Site Summary Parameters 354.2Development of Data Web Portal . 374.3Development of Data Input Tool . 404.4Gap Analysis and Selection of New Count Sites . 594.5Comparison of Data Collection Methods . 62Results . 64ii
UVM TRC Report # 17-0065.1Database Development and Estimation of Site Summary Parameters 645.2Spatial Distribution of Sites . 655.3Temporal Distribution of Counts. 675.4Gap Analysis and Selection of New Count Sites . 705.5Comparison of Data Collection Methods . 726Conclusions and Recommendations . 857References . 88Appendix A: Site Summary Parameters Calculation Formulae. 92Appendix B: Bicycle and Pedestrian Count Program Field Data Sheet . 93Appendix C: Manual Count Template . 97Appendix D: Site Selection Additional Information . 99Appendix E: Data Dictionary for Data Input Tool . 104iii
UVM TRC Report # 17-006List of TablesTable 1. Data Fields for Count Programs . 11Table 2. Bicyclist and Pedestrian Count Program Review Agencies. 15Table 3. Automated count site summary of metrics. 21Table 4. Video-based manual count summary of metrics. . 24Table 5. Multiuse path facility inventory with associated trail name, townjurisdiction, length in miles, data source, and whether a count has been conductedon a site along the facility to date. . 27Table 6. Vermont Bicycling and Pedestrian Count Database Structure . 36Table 7. Tabulation Existing Count Sites and Statewide Mileage by Class . 60Table 8. Existing count sites by class . 64Table 9. Summary of ADT, PHT, and PDT at Sites with an ADT. 65Table 10. New Count Site Locations . 70Table 11. Hourly Count Comparison . 73Table 12. Comparison of Strava Metro data and count data ADTs . 79List of FiguresFigure 1. Data collection technology decision flowchart. . 9Figure 2. An example of a public data portal from the DVRPC with site details opendisplaying count data. . 17Figure 3. Street view of the sidewalk outside of St. Johnsbury Academy. . 20Figure 4. Application of an automated infrared counter on a shared-use path . 21Figure 5. Street view of Center Street in Rutland, outside of the ParamountTheater. . 22Figure 6. Hourly counts on Center Street in Rutland. 23Figure 7. Motion activated video camera. 23Figure 8. Video data validation of the EcoCounter attached to the sign post in theframe above. . 34Figure 9. Vermont Bike and Pedestrian Count Data web portal map view of countlocations. . 38Figure 10. Vermont Bike and Pedestrian Count Data site detail. . 39Figure 11. Peak-hour travel averager, which takes the average PHT for all of thesites that fall within the gray shadow area, representing a 5-mile radius. . 40Figure 12. The Data Input Information section of the data input tool prompts theuser for their affiliation and contact information. . 42iv
UVM TRC Report # 17-006Figure 13. New Site Location selection will lead user to define the new site for thedatabase. . 43Figure 14. Old Site Location selection will prompt the user for the Site ID from theVermont Bike and Pedestrian Data Portal and ask if any changes in infrastructurehave been introduced since the site was last counted. . 44Figure 15. In defining a new site location, user is prompted to select one of the 255towns in Vermont. 45Figure 16. The map of the Regional Planning Commissions in Vermont accompaniesthe pre-populated pull down menu to select which RPC jurisdiction the new countsite is located. . 45Figure 17. Open ended entries to define the facility name, nearest cross street orlandmark, and additional description of the count site. . 46Figure 18. Interactive map to pinpoint the exact count location. In this example,the map is zoomed in all of the way with satellite view toggled on. 47Figure 19. Defining the count facility as on-network will prompt the user to identifythe road classification type and the posted speed limit. . 48Figure 20. Count site details Questions 1 and 2 define the facilities counted and ifthey are paved or not. . 49Figure 21. If facilities were not included in the count, but exist at the count site, theuser will be prompted to identify which facility types were NOT counted. . 50Figure 22. Aerial view of example count site location where multiple facility typeswould be selected depending on the count type. 53Figure 23. Count directional indication for Direction A with site diagram. . 54Figure 24. Count data collection specifics if the observation was manuallyconducted. . 55Figure 25. Count data collection specifics if the count was automatically collected. 56Figure 26. Question to specify the start date and time of data collection. . 57Figure 27. The duration and frequency of the count data collection. . 58Figure 28. Manual data file upload prompt. 59Figure 29. Automated data file upload prompt. . 59Figure 30. Occlusion at an automated infrared counter. . 62Figure 31. Count Locations in Vermont, with Normalized County ADTs . 66Figure 32. Average hourly volumes from all automated infrared count sites inVermont . 68Figure 33. Average daily volumes by month from all automated infrared count sitesin Vermont . 69Figure 34. Video-based manual and EcoCounter count comparison. . 73Figure 35. Example of social cluster passing EcoCounter. . 76v
UVM TRC Report # 17-006Figure 36. a) Bicyclist passes the infrared counter on a bike lane in the traveledway. b) Pedestrians on the opposing sidewalk are missed by the placement of theEcoCounter . 77Figure 37. Google Streetview image of a cyclist along the travel way adjacent to amultiuse path (side path). . 78Figure 38. Example of a cyclist on the sidewalk being tallied by an infraredEcoCounter, instead of the adjacent on-road bike lane. 79vi
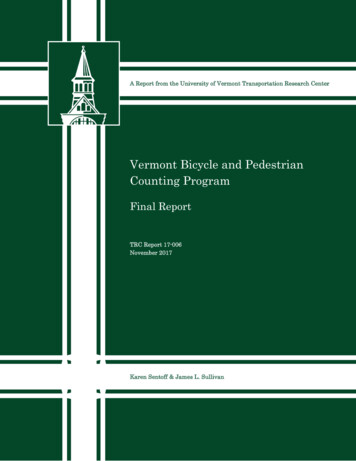
UVM TRC Report # 17-006Executive SummaryTraffic counts are used extensively in transportation system management,planning, policy and research. Counts help us better understand spatialrelationships and temporal trends in travel activity. In spite of the growingrecognition of the importance of non-motorized travel, tracking of bicyclistand pedestrian travel behavior with counts lags behind comparable effortsfocused on motorized travel. Count data helps agencies to better understandthe non-motorized transportation activity in their jurisdictions by designingand prescribing: data collection locations to count non-motorized transportation users; methods appropriate for counting at each location; data processing and management structures to assemble and qualityassure data; and, web portals to disseminate the information to the public and otherstakeholders.In Vermont, non-motorized traffic counts are collected by the UVM TRC,VTrans, and several of the state’s regional planning commissions. RPCscollect counts in support of local initiatives and at the request of VTrans.The VTrans Traffic Research Unit has also collected a series of manualcounts and the Agency recently purchased data from Strava, Inc., whichincludes data on routes used by cyclists who used the Strava app between2014 and 2016 in Vermont. Strava’s mobile app and its desktop websiteinterface allow athletes to track, analyze, plan, and share their trainingrides and runs. The Strava Metro product anonymizes and aggregates all ofthe cycling (and running) data recorded by Strava members for the giventime frame aggregated onto a GIS of the street network.The variety of collection efforts creates a diverse set of statewide count data,but it makes compilation of a single state-wide archive challenging. Thegoals of this project were to create a bicycle and pedestrian count databasefor the state of Vermont, communicate the state of non-motorized travelstatewide, and make recommendations for future data collection andmanagement.Count Database DevelopmentAll existing counts in Vermont were compiled into a new unified database,with four separate tables linked by a new site ID.The database contains over200,000 hours of observation at 194 locations:vii
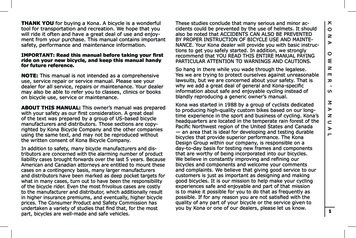
UVM TRC Report # 17-006Count Locations in VermontThe majority of count sites and durations were either on multiuse paths (72sites with over 60,000 hours) or sidewalks along Class 1 Town Highways (43sites with nearly 140,000 hours). Class 1 Town Highways in Vermont arepredominantly located in the core of downtown districts or village centers.viii
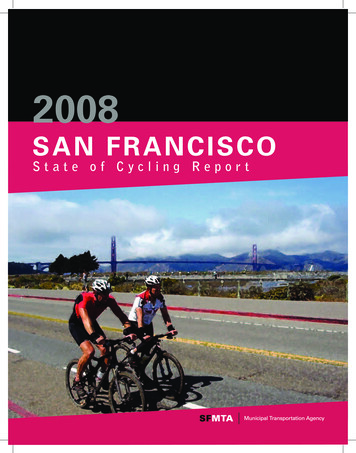
UVM TRC Report # 17-006All 194 locations have a peak hourly travel (PHT), since even the manualcount sites covered at least one hour. The PHT represents the largestrecorded count of cyclists and pedestrian over 4 consecutive 15-minuteperiods. The average PHT across all 194 sites was 110, indicating that thefocus of all counts to date has generally been at locations where high levelsof walking and cycling are expected.69 of the 194 sites also have an average daily travel (ADT), which is theaverage of any full calendar days of counts:Summary of ADT, PHT, and PDT at Sites with an ADTMinimumMaximumMeanAverage Daily Travel41,864312Peak Hourly Travel0899182Peak Daily Travel44,9667812473,1652,962Duration (hours)The average hourly volume of cyclists and pedestrians in Vermont providesan indication of travel throughout the average day:ix
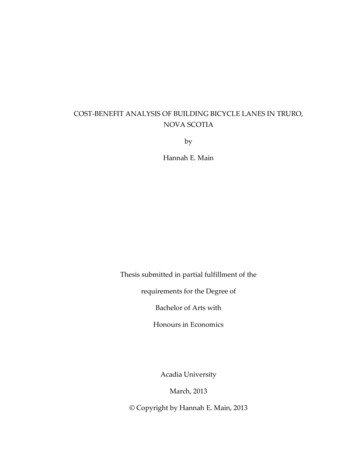
UVM TRC Report # 17-006Average hourly volumes from all automated infrared count sites in VermontAverage daily volumes at the automated infrared sites provide an indicationof the seasonal fluctuations:x
UVM TRC Report # 17-006Average daily volumes by month from all automated infrared count sites in VermontWeb Portal and Data Input Tool DevelopmentA web portal was developed with an html index script that enlists map tilesfrom OpenStreetMap and CartoDB (now CARTO), and aerial imagery fromUSGS to view and interact with the Site Data in a GIS web environment.The tool includes a number of useful features for viewing and accessing data:xi
UVM TRC Report # 17-006Vermont Bike and Pedestrian Count Data web portal map view of count locations.In order to achieve organized and uniformly-formatted data input from manydifferent resources, controlling the input data accepted by the Agency wascritical. The team investigated options for controlling data input.LimeSurvey met all of the criteria and was designed and administered fromUVM’s secure and redundant servers. The first page of the data input toolprompts the user to identify their affiliation and provide contact information:xii
UVM TRC Report # 17-006The Data Input Information section of the data input tool prompts the user for their affiliation andcontact information.Gap Analysis and Selection of New Count SitesScreenline counts are observations of traffic, in this case bicyclist andpedestrian traffic, that cross a single imaginary line tangential to the facilityon which individuals are traveling. In order to gain an improvedunderstanding of non-motorized travel activity, a robust set of countlocations is needed. A spatiotemporal / categorical gap analysis and semirandom site selection process were employed in order to improve therobustness of the set of count locations in Vermont.A tabulation of the total mileage of each roadway class was assumed toinform the ideal, representative temporal and spatial distribution of countsby class:xiii
UVM TRC Report # 17-006Tabulation Existing Count Sites and Statewide Mileage by ClassExisting Count SitesClassPercent of PercentTotalof of TotalUS Highway6%1%6193%State Highway9% 1%17719%Class 1 Town Highway22%66%1411%Class 2 Town Highway12%1%275015%Class 3 Town Highway11%2%842745%Class 4 Town Highway0%0%16069%Private2% 1%279515%National/State Forest Highway0%0%3162%Multiuse Paths37%29%2371%To remove bias from the process of selecting new sites in each class, astratified random sampling technique was used. A total of 20 new sites wereselected in this way, and 1 of them was identified for automated infraredcounting if it already had infrastructure that would allow that method to beused.Comparison of Automated Infrared Counts and Video Manual CountsA video manual review count at the Colchester Avenue test site wasconducted to better understand the potential inaccuracies in automatedinfrared counts. The presence of clustered groups of pedestrians resulted inundercounting by automated infrared. Correction factors varied between 1.00and 2.00, with an average across all 27 hours of 1.17.Comparison of Strava Metro Data and Count Summary DataThe average comparison ratio between the Strava Metro Data and the countsummary data is 0.8%, indicating that only approximately 0.8% of the nonmotorized traffic stream is represented by users of the Strava app. This ratiois significantly lower than comparable values reported by Strava for otherxiv
UVM TRC Report # 17-006regions in the U.S., but is not surprising because most of the average dailycounts from the Strava Metro data were lower than 1.0 on Vermont’s roads.The average comparison ratios for sites by facility type are: Sidewalks or foot bridges – 0.6%, Multiuse paths and trails – 0.4% Roadways with no dedicated walking or cycling infrastructure – 1.5%.Conclusions and RecommendationsThe overarching goal of this project was to lay the foundation for acomprehensive non-motorized count program for the state of Vermont. Todate, on data has been collected without a standard protocol or repository inplace. This guidance and its affiliated tools will help the Agency betterimplement the non-motorized count program statewide.The key outcomes of this work included: Creation of a new data input tool that standardized the data formatsand response options based on national protocols Creation of a new database with a linked Site ID to prevent dataduplication and loss Creation of a new web portal to view the existing count data in sitesummary form or to download raw data. Recommendations for 20 new count sites to generate a morerepresentative count database, as counting to date has been focused onsidewalks and multiuse paths where high non-motorized volumes areexpected. Automated infrared counts can be multiplied by a correction factor of1.16 to account for occlusion, but this factor is affected by the socialcontext of the pedestrian activity at the site – occlusion is moreprevalent when pedestrians travel together in large groups. Strava Metro Data only accounts for about 0.8% of Vermont’s dailynon-motorized travel, but can be a useful source of complete-screenlinedata when sidewalk or on-network multiuse path counts need to besupplemented with roadway volumes.We encourage the use of this guidance and the web portal as the primarymethodology to collect and report data on non-motorized transportationxv
UVM TRC Report # 17-006across the state. This will ensure uniformly formatted data for integrationinto a singular data repository accessible to the public.The primary data resources that are integral to this project require thecontinued efforts of various entities to collect the non-motorized count dataacross the state. Therefore, we strongly encourage continued support of theregional planning commissions to count non-motorized users as part of theTransportation Planning Initiative. We also encourage other individuals,including other representatives from municipalities, agencies, and advocacygroups, to report any data they collect to the portal.xvi
UVM TRC Report # 17-0061 IntroductionTraffic counts are used extensively in transportation system management,planning, policy and research. Counts help us better understand spatialrelationships and temporal trends in travel activity. In recent years, manytransportation planning agencies have started counting bicyclists andpedestrians using our public infrastructure for the same purposes. Vermonthas been a leader with VTrans, several regional planning agencies and theuniversity all active in counting non-motorized travel.In spite of the growing recognition of the importance of non-motorized travel,tracking of bicyclist and pedestrian travel behavior with counts lags behindcomparable efforts focused on motorized travel. The Bureau ofTransportation Statistics (BTS) has identified the systematic,methodologically consistent collection of non-motorized travel data as apriority for improving infrastructure and safety analysis (BTS, 2000).Obstacles to calculating bicycle and pedestrian miles of travel (BPMT)include the expense and technical challenges of collecting bicyclist andpedestrian (BP) counts (Hocherman et al., 1988; Green-Roesel et al., 2007).Because pedestrian movement is less restricted than vehicle movement andbecause pedestrians may move in closely overlapping groups, the countingprocess is more difficult to automate than it is for vehicles (Hocherman et al.,1988). Newer pneumatic and infrared equipment work well in some settings,but are not well suited to all outdoor environments (Green-Roesel et al.,2007). Consequently, BP counts remain more dependent on expensivemanual data collection and continuous count data is scarce. In addition, BPcounts have tended to focus on more highly traveled paths in more bike- andpedestrian-friendly towns and locations, leaving significant spatial gaps inBP datasets (Zhang et al., 2010). Temporal and spatial shortcomings of nonmotorized travel counts such as these present challenges to transportationplanners. Planners often assume negligible or even no non-motorized trafficin outlying or rural areas due to the lack of data (Hammond and Elliott,2011).Calculating travel volumes, assessing safety and evaluating trends in nonmotorized travel are only a few of the potential uses of statewide bicycle andpedestrian counts. Focused questions from the public, regional planningcommissions (RPCs), and other state agencies about non-motorized travelcan inform policies to encourage travel that is both conducive to greenhousegas reductions and improved health outcomes. Analysis of specific travelcorridors can justify and inform the optimal siting and design of new bicycleand pedestrian infrastructure. Most importantly, statewide understanding of1
UVM TRC Report # 17-006bicycle and pedestrian travel can be a critical component to VTrans’commitment to safety on its roadways.All of these potential uses of bicycle and pedestrian counts will benefit fromthe compilation of all count data statewide into a single, searchable GISbased database. Whether searching for trends in non-motorized travel overtime, or supporting an equitable spatial distribution of infrastructurefunding, it will be critical for users to know that all of the data that has beencollected in Vermont is included, and for that data to be easily accessible.The UVM TRC has worked with the Chittenden County Regional PlanningCommission (CCRPC) to build a spatially and temporally robust data set ofbicycle and pedestrian counts in Chittenden County, and to develop betterestimation models where count data is lacking. Extensive research analyseshave allowed a better understanding of the factors of the built environmentwhich contribute to BP activity locally (Lu and Sullivan, 2011). Varyingthese factors has required the collection of counts from rural roads that lackexclusive walking or biking infrastructure but nonetheless were found tohave non-motorized traffic volume. The unique challenge of collecting BPcounts in these rural locations has resulted in a new protocol, which includesthe use of a closed-circuit video camera and digital video recorder. This newprotocol has proven successful throughout the rural settings in ChittendenCounty.At the same time, the importance of seasonality and weather on BP counts isbetter understood from year-round BP counts using Eco-Counter pyroelectric sensors. These unique sensors make it possible to collect continuouscounts in areas where facilities are shared by cyclists and pedestrians, likeshared-use paths and also on sidewalks. From these year-round counts, theeffects of changing seasons and daily weather have been established andquantified, so that year-round estimates can be made elsewhere based onshort-term counts. From this new robust dataset, the team presented andcompared annual BPMT estimates for Chittenden County calculated usingseasonally specific, day-of-week adjustment factors (Dowds and Sullivan,2011).In Vermont, non-motorized traffic counts are collected by the UVM TRC,VTrans, and several of the state’s regional planning commissions. RPCscollect counts in support of local initiatives and at the request of VTrans.The VTrans Traffic Research Unit has also collected a series of manualcounts. Counts collected by the RPCs are catalogued and archived in supportof the state’s Bicycle and Pedestrian Policy Plan (VTrans, 2008). The Bicycleand Pedestrian Policy Plan explicitly calls for the tracking of usage of BPinfrastructure to measure performance of these facilities. Through May 2011,the Agency had archived 130 BP counts statewide (outside of Chittenden2
UVM TRC Report # 17-006County) and the CCRPC has catalogued over 400 BP counts during the sametime period (2000 to 2010). The Agency has also recently purchased datafrom Strava, Inc. which includes data on routes used by cyclists who used theStrava app between 2014 and 2016 in Vermont. While limited in terms ofrepresentativeness, this user-based data may be a useful complement to thecount data collected in the field.The variety of collection efforts creates a diverse set of statewide count data,but it makes compilation of a single state-wide archive challenging. Thegoals of this project were to create a bicycle and pedestrian count databasefor the state of Vermont, communicate the state of non-motorized travelstatewide, and make recommendations for future data collection andmanagement. The specific objectives of this project were to:1. review best practices in non-motorized count data management andcount planning;2. gather all existing counts into a single database and create orimplement a bike and pedestrian count data web portal;3. validate the existing count data and the methods of collection;4. identify gaps in the statewide data set;5. develop a continued counting plan to be implemented by VTrans.3
UVM TRC Report # 17-0062 Best Practices in Count Data Management2.1 Count Data ProgramsThe current state of practice for bicyclist and pedestrian counting programsacross the country varies tremendously depending on local or regionalinitiative. Without a federal mandate like that which exists for vehiclecounting, the impetus for implementing non-motorized count programs isbased primarily on a more localized desire to account for bicyclist andpedestrian travel in short and long-term planning activities, infrastructureimprovements, or policy-making. Therefore many states, metropolitanplanning organizations, and city municipalities have created their owncounting programs catered to their particular needs. Efforts by thesejurisdictions are guided by generic protocols from resources like the NCHRPGuidebook on Pedestrian and Bicycle Volume Data Collection and NationalBicycle and Pedestrian Documentation Project (NBPD), but actuallyimplemented and managed more locally. In some cases the count programsare volunteer-driven, manual count oriented like Washington State DOT,wh
UVM TRC Report # 17-006 . Vermont Bicycle and Pedestrian Counting Program November 28, 2017