Transcription
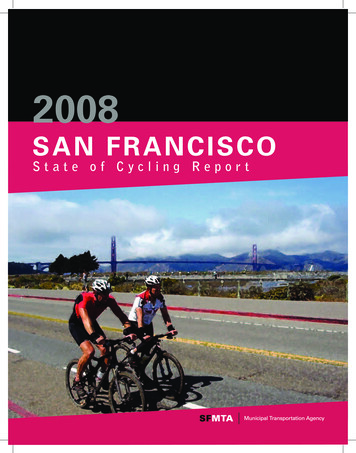
2008SA N F R A N C I S C OState of Cycling Report
2008SAN FRANCISCOState of Cycling Report
Table of Contents1Introduction23Purpose of the State of Cycling ReportHistory of the State of Cycling Report3Bicycle Counts445PurposeHow the Counts Were ConductedResults7Bicycle Survey889PurposeHow the Survey Was ConductedResults19 Improving Bicycling in San Francisco202122Rating Bicycling in San FranciscoRecommendationsPlans for Future ReportsList of Figures4689910111213141516161717181818Figure 1. Bicycle Count LocationsFigure 2. San Francisco Bicycle Counts 2006-2008Figure 3. Intercept Survey LocationsFigure 4. Measures of Bicycle Ridership in San FranciscoFigure 5. Proportion of Frequent Cyclists to Infrequent Cyclists in San FranciscoFigure 6. Trip Purpose as a Percentage of All Trips Made in a DayFigure 7. Cyclists’ Motivation to RideFigure 8. Reported Gender of Frequent vs. Infrequent CyclistsFigure 9. Ratings of Barriers to BicyclingFigure 10. Percentage of Respondents who Identified Each Barrier as a Hindrance toBicyclingFigure 11. Frequent and Infrequent Cyclists’ Familiarity with San Francisco’s BicyclingResourcesFigure 12. All Cyclists’ Ratings of San Francisco’s Bicycling InfrastructureFigure 13. Frequent and Infrequent Cyclists’ Perceptions of San Francisco’s BicyclingInfrastructureFigure 14. Agreement with Statement “Cyclists have a legal right to use the road”Figure 15. Commonly Witnessed Unsafe Cycling BehaviorsFigure 16. Commonly Witnessed Unsafe Motorist Behaviors Toward CyclistsFigure 17. Unsafe Driving and Cycling Behavior: Differences in PerceptionFigure 18. Safety and Cyclist BehaviorList of Tables581220Table 1. Locations with Statistically Significant Changes in Bicycle Volumes during theEvening CommuteTable 2. Location and Day of Intercept SurveysTable 3. Ethnic and Racial Comparison of Survey Data to San Francisco PopulationTable 4. Rating Bicycling in San Francisco
City of San FranciscoMayor Gavin NewsomSan Francisco Board of SupervisorsSan Francisco MunicipalTransportation Agency (SFMTA)Nathaniel P. Ford Sr., Executive Director/CEOBoard of Directors:James McCray, Jr.Tom NolanCameron BeachShirley Breyer BlackMalcolm A. HeinickeJerry LeeBruce OkaBicycle Advisory Committee:Dr. Andrew BindmanRichard TillesMarc BrandtSusan KingHitesh SonejiBert HillJerry ErvinRufus J. Davis, Jr.Casey AllenTechnical Advisory Committee:Michael RadetskyFaiz KhanMelissa PelkeyTravis FoxDr. Andrew BindmanSan Francisco Bicycle CoalitionCONSULTING TEAMAlta Planning DesignBrett Hondorp, PrincipalLauren Ledbetter, AssociateHolly Dabral, DesignerHenne GroupJeff Henne, Principal
1 IntroductionOver the past several years the number of people bicycling in SanFrancisco has surged. Bike to Work Day has seen dramatic increasessince its inception in 1994, with bicycles outnumbering cars two to oneon Market Street at Van Ness Avenue during 2008’s Bike to Work Day.Bicycle usage has increased on roadways where the City has installedbicycle lanes including Valencia Street, Polk Street and Fell Street.1 SanFrancisco voters asked for and received car-free Saturdays in GoldenGate Park. The San Francisco Municipal Transportation Agency (SFMTA)recognizes and supports the increased popularity of bicycling and theassociated environmental, health and transportation benefits. At the sametime, the Agency acknowledges the potential for safety issues and roaduser conflicts that may arise as more cyclists—and more people new tourban bicycling—take to the streets. This first State of Cycling Reporthas been developed to provide a snapshot of cycling in San Franciscoand to identify ways that the SFMTA can increase safe bicycling.1 See evaluation reports for these three streets on the San Francisco Municipal Transportation Agency’s website:http://www.sfmta.com/cms/rbikes/3172.htmlS a n Fr a n c i sc o S t ate of C ycling 2008 1
Purpose of theState of Cycling ReportThis first State of CyclingReport is intended to give asnapshot of cycling in SanFrancisco. The report providesa baseline analysis of bicyclingfrom information gathered viabicycle counts and surveysconducted during 2006,2007 and 2008. This reportresponds to the questions: How have bicycle volumeschanged between 2006 and2008? How much do peoplebicycle in San Francisco? Who is bicycling in SanFrancisco and who is not? Why are people bicyclingand what motivates them todo so? What are the differences, ifany, between people whobicycle and people who donot? What barriers preventpeople from bicycling in SanFrancisco? How satisfied are cyclistswith San Francisco’sbicycling infrastructure? How safe and comfortabledo people feel whenbicycling in San Francisco? How well do cyclists andmotorists share the road? How well-known are theSFMTA’s bicycling outreachprograms?In addition to this State ofCycling Report, the SFMTAhas published two companiontechnical documents thatprovide detailed descriptionsof the count and surveymethodologies along withadditional analysis, andinclude summary tables ofcount and survey results.History of theState of Cycling ReportIn August 2006, the SFMTABicycle Program conducted itsfirst citywide bicycle count toprovide a baseline for futurebicycle count comparisons.Thirty-three locations wereselected for bicycle counts.In August 2007 and in August2008, the City conductedfollow-up bicycle counts,which were compared to the2006 counts to determinechanges in cycling volumesand patterns.In spring 2008, the Cityconducted two survey effortsincluding a random phonesurvey of San Franciscoresidents and cyclist interceptsurveys at 15 locations. Bothsurveys included a “trip diary”component. Approximately400 usable responses werereceived from each survey.These 800 responses wereanalyzed and compared todetermine characteristics ofbicycling trips, characteristicsof cyclists, behavior of cyclistsand attitudes toward bicycling.2 S an Francisco M u n i c i p a l Tr a n s p o r t a t i o n Ag e n c y
2 Bicycle CountsThe bicycle counts collected during 2006, 2007 and 2008 providea valuable snapshot of the level of cycling in San Francisco. Thesecounts serve as baseline measurements for the SFMTA BicycleProgram. An analysis of these counts identified several statisticallysignificant trends in ridership, including a 14 percent increase in overallbicycle ridership from 2006 to 2007, a 24 percent increase in overallbicycle ridership from 2007 to 2008 and a 43 percent increase inoverall bicycle ridership from 2006 to 2008. Future counts are plannedso that the City can continue to track changes in bicycle ridership.This chapter provides a brief overview of the 2006-08 bicycle count data.For a more detailed report on the latest data, please see the “2008 SanFrancisco Bicycle Count Report.”S a n Fr a n c i sc o S t ate of C ycling 2008 3
Purpose of the BicycleCountsCounts were collected atthree general locations: 1) inthe downtown core, 2) at asecondary cordon establishedmidway across the City alongkey bicycle routes, and 3) inoutlying neighborhoods. Mostcount locations were at theintersection of two bicycleroutes. Figure 1 shows thecount locations from 2006-08.At each count location,observers recorded thenumber of cyclists, thedirection of the cyclist andwhether cyclists were ridingon sidewalks or riding againstthe designated flow of traffic.At locations where bicyclevolumes were low, observersalso recorded if a cyclist waswearing a helmet and notedthe perceived gender of thecyclist.How the Counts WereConductedBicycle counts wereconducted at 33 intersectionsduring August of 2006,2007 and 2008. A total of35 counts were conductedeach year, with 31 countsoccurring during the eveningpeak period from 5:00-6:30p.m. Three counts tookplace in the morning peakperiod from 8:00-9:00 a.m.,and one during the middayperiod from 1:00-2:00 p.m.Bicyclists at 5th and Marketstreets were counted duringall three periods. The eveningpeak period was chosenas the focus, as there is agreater mix of trips than in themorning when most trips arework-related.The SFMTA has establishedregular bicycle counts forseveral reasons. First, thesecounts document baselinebicycling activity at keylocations and allow the City tomeasure changes in bicyclevolumes over time. Second,correlating count data withchanges in the environmentsuch as installation of bicyclelanes, increased publicityaround cycling or economicchanges, such as increasedgas prices, may assist theSFMTA in understanding howthese changes affect travelbehavior. With additional data,forecasting models can beimproved to better predictchanges in cycling rates.Figure 1. Bicycle Count LocationsCount Locationsa.m.a.m./p.m./Middayp.m.Bicycle NetworkNew 2008 LocationsBike RoutesBike LanesBike YSBATUNNELGENESLHARNEYMESTOWNIN TERS POHUNTNYUNOMAOLSA N BRTH19SKYLINEEALINUITCARRPA ULSE LLSAGAMORE4 S an Francisco M u n i c i p a l Tr a n s p o r t a t i o n Ag e n c yPHOREBARNEVSHBAYMISERM ANBROTHERHOODEVANSALELKEGENNESSEEPHELANBENITOSA NUHOLLOWAYSAINT CHARLESTELUNADOLO O35THEINDIAST RCRESCENTVSILHEARSTMINNES OTASESan Francisco BayILLINOI S STINDIANAJOGH4TNKIND3RBAKE ROERADRYSAOAKDEANNED16THORO CEECHNHYSBAER EYRT HSEKANSASN19THRCBAH5TMONTGUERREROSANCH EZYWONPOTREROTTSSWKANSASBENEMCESAR CHAVE Z26TH30THHOH8TRGDMARIPO SAHARRISONOEUREK ACDAURHDIVISIONVALENC IANCLAYTONHOAAT11SANCH EZRYAHWH7TNTHSIO22NDAPOR TOLSLS10ISUNEOTOJERSEYSIDH20THFOINLAKE MERCEDEMH17THCLIPPE RWOODYBA TH20THSUNSE TYLIROCTAVIAFELLBO SSKMUAR23RDWINSTONHNPO LKWE BS TERSC OTTFU LTONDUBOCESLOATJOM23RDOVICENTERTSSTO CK TORSTEINEMASO NIC6THSUSPARNASBUTAYLOROSESVER34THGRE AT HWYDGEL LEIST ERMC ALLGROV EPA GEKIRKHAMPacific OceanPA CIF ICWE BS TERPRESIDICHERRYTR ANHUGOMSUTTERGATERZAKELUPOSTGEARYGOLD 47THMIDD LELYONIDTOARGUELLO34THCABRILLOJF KEROSG8THOB15THTLINPO INTBA YICHGREENWLAKE23RD30THCLEMENTINPONP TO25THEL CAMINO DE L MARNORTHABROCTAVFRSHCOMHAM3R DDELFIWASHALAN CISCOEYSSLINCOLNSANSOMRIMARINAMASO N00.51Mile
The City will continue toconduct bicycle countsannually, with the ultimate goalof installing automated bicyclecounters throughout the City.ResultsComparing bicycle countsfrom 2006 to those collectedin 2007 and 2008 allowsthe SFMTA to identifychanges in bicycle volumes,safety behavior and otherdemographic information.Volume TrendsA comparison of bicyclingvolumes between 2006, 2007and 2008 indicates:Bicycling is increasing inSan Francisco.Between 2006 and 2008San Francisco experienceda statistically significant 43percent overall increase in thenumber of bicyclists countedat 33 intersections.Bicycling is on the riseduring the eveningcommute.The highest cyclist volumeswere recorded at: Embarcadero at Broadway(458 cyclists) 5th/Cyril Magnin at Market(443 cyclists) 11th at Market (419 cyclists) 17th at Valencia (360cyclists) Embarcadero at Broadway(326 cyclists) 5th/Cyril Magnin at Market(322 cyclists)Natural Variation in theNumber of Bicycles at aLocationThe number of cyclists counted at alocation may vary by 10 percent ( /-)The same four locationsaccounted for 38 percentof the total cyclistvolumes counted duringthe evening commute in2008:from one day to the next. This meansthat what may seem like an importantincrease or decrease in bicycle volumescould be just part of the natural variation.The changes in bicycle volumes listed inTable 1 are statistically significant changes outside of this normal daily variation. 11th at Market (522 cyclists) 17th at Valencia (485cyclists)As more data is collected, the City will beable to determine a more accurate dailyvariation at each count location and willbe able to develop a better understandingof what changes in bicycle volumes arestatistically significant.Table 1: Locations with Statistically Significant Changesin Bicycle Volumes during the Evening Commute (2006 to2008)Between 2006 and 2007,San Francisco experienceda statistically significant 12percent increase in citywidecyclist volumes during theevening commute. From2007 to 2008, there was a 39percent increase in citywidecyclist volumes during theevening commute.LocationFour of 33 locationsaccounted for 39 percentof the total cyclistvolumes counted duringthe evening commute in2007.20062008Bicycle CountsBicycle Counts% Change11th at Market39052234%11th at Howard15623249%8th at Townsend12319155%Sutter at Stockton3269116%Polk at McAllister16921427%5th/Cyril Magnin at Market31444341%Illinois at Mariposa264365%17th at Valencia32548549%23rd at Potrero2450108%Scott at Fell14722251%Scott at Page29241843%Marina at Cervantes18335292%Embarcadero at Townsend13124083%Embarcadero at Broadway23645894%7th at 16th5910578%Randall at San Jose2476217%Geneva at Alemany822175%Source: Bicycle Counts 2006 and 2008.Note: Percent change is statistically significant at a 95 percent confidence level.S a n Fr a n c i sc o S t ate of C ycling 2008 5
Safety Trends**From 2006 to 2007, twolocations exhibitedstatistically significantdecreases in sidewalkriding:Masonic at Golden Gate(-86 percent) and 14th atFolsom (-88 percent). Mostother locations exhibited aslight decrease in sidewalkriding that was not statisticallysignificant.From 2006 to 2007,downtown locationsshowed a statisticallysignificant decrease inwrong-way riding (-28percent), while nondowntown sites showeda statistically significantincrease in wrong-wayriding (120 percent).These trends should bemonitored closely when theinstallation of new bicyclelanes and shared lanemarkings—both of which areintended to decrease wrongway riding—resumes after theBike Plan injunction is lifted.Figure 2: San Francisco Bicycle Counts 2006-08Number of CyclistsTotal 7,884*80007000Total 6,4156000Downtown3,375Total wn4,509From 2007 to 2008, helmetwearing showed a fivepercent decrease from 72percent to 67 percent.These percentages are basedon total reported helmet/no helmet riders, not onthe total number of cyclistscounted citywide. As notedbelow, these percent changeswere not tested for statisticalsignificance.Gender Trends**From 2006 to 2007, thepercentage of femalebicyclists showed a veryslight decrease from 25percent to 24 percent.Sutter at Polk, Polk atMcAllister, 5th /Cyril Magninat Market, 7th at 16th andArguello at Lake all sawstatistically significantincreases in the number offemale riders counted. Thisanalysis is based on gendercounts at 18 locations, sincethe remaining locations onlyhad gender counts availablefor one year.From 2007 to 2008, theshare of female ridersincreased from 24 percentto 27 percent.These percentages are basedon total reported female/maleriders, not on the total numberof cyclists counted citywide.As noted below, these percentchanges were not tested forstatistical significance.10000Year 2006Year 2007Year 2008* For comparison purposes, totals exclude some count locations which were changedfrom 2007 to 2008. Please see Table 2 in the “2008 San Francisco Bicycle Count Report”for more detailed information.Source: 2006-08 San Francisco Bicycle Counts6 S an Francisco M u n i c i p a l Tr a n s p o r t a t i o n Ag e n c y** A statistical analysis was not performed forthe 2008 data pertaining to safety or gendertrends because this data was not collected ata consistent number of locations from 2007 to2008 (due to the high volume of bicyclists andlocation changes). However, general trends from2007 to 2008 were observed.
3 Bicycle SurveyAs part of the 2008 survey effort, over 800 people were asked aboutbicycling in San Francisco. This survey answered important questionsthat will direct the SFMTA’s Bicycle Program in the future: Whatpercentage of San Franciscans are cyclists? How often do people ride?What motivates someone to ride? What barriers are there to bicyclingin San Francisco and how can people be encouraged to ride more?How do cyclists feel about San Francisco’s bicycle facilities? What arethe differences between frequent cyclists and occasional cyclists? Howmany cyclists obey traffic laws? What are attitudes and behaviors towardcyclists? Some of these questions have not been answered before, andthe answers are surprising.S a n Fr a n c i sc o S t ate of C ycling 2008 7
Purpose of the BicycleSurveyThe survey was developed fortwo reasons: first, to identifytrends in bicycling habits andcyclists’ perceptions of thebicycling environment; second,to estimate the number ofbicycle trips taken on anaverage day and the purposeand duration of those trips.How the Survey WasConductedSurvey data was collectedusing two methods:1. Phone surveyA phone survey wasconducted during Spring2007 of randomly selectedSan Francisco residents. Theresponses collected fromthis survey represent all SanFranciscans, not just thosewho bicycle and include thosewho do not engage in anyform of cycling activity. In all,408 usable responses werecollected.2. Intercept surveyAn intercept survey of“practicing cyclists” wascollected during May 2008.Fifteen locations distributedthroughout San Franciscowere used as survey collectionpoints.Surveys were collectedduring 24 collection times, witha quarter of these collectiontimes scheduled at “EnergizerStations” during Bike to WorkDay.After agreeing to participatein the survey, a cyclist wasgiven two ways to participate:in-person at the time of theintercept or via an onlinesurvey. A total of 416 usableresponses were collected.Intercept surveys wereconducted in English, Spanishand Chinese.All survey respondents wereasked to complete trip diaryinformation for the prior day.The sampling methods andthe number of responsescollected were designed toprovide responses that wouldbe statistically significant witha five percent margin of errorand 95 percent confidencerate.Figure 3: Intercept Survey LocationsMarina & CervantesPacific OceanFerry Building3rd & Clement12th & ClementCyril Magnin & MarketPolk & MarketScott & Fell4th & KingJFK & Transverse9th & Brannan19th & IrvingSunset & Judah17th & Valencia19th & JudahSanFranciscoBayHarrison & Cesar ChavezTable 2: Location and Day of Intercept SurveysDay of Week of InterceptLocationBike toWorkDayOtherWeekdayNon-native SpeakersWeekendSurveyconductedin Chinese19th and IrvingXXX19th and Judah(N-Judah Station)XXXSunset and Judah(N-Judah Station)XXClement Street (3rd to 5th Ave)XClement Street (9th to 12thAve)Surveyconductedin SpanishXXX9th and BrannanXHarrison at Cesar ChavezXXX5th/Cyril Magnin at MarketXXXXXXScott at FellXXSan Francisco Civic Center(Market and Polk)XSan Francisco Ferry BuildingMarina at CervantesXValencia at 17thXJFK at TransverseFourth and King (CaltrainStation)8 S an Francisco M u n i c i p a l Tr a n s p o r t a t i o n Ag e n c yXXXXXX
ResultsFigure 4: Measures of Bicycle Ridership in San FranciscoHow much do peoplebicycle in San Francisco?San Francisco continues tohave a high rate of bicycling.The City should capitalizeon this high level of bicyclingand continue to support itthrough infrastructure andprogrammatic improvements. Nearly 16 percent ofphone survey respondentsreported bicycling anaverage of two or moredays per week for all trippurposes (Figure 5). It is estimated that thereare approximately 128,000bicycle trips made each dayin San Francisco. Approximately six percent ofall trips in San Francisco arecompleted via bicycle.Percentage of Trips6.0%6%5%4%3%2.7%2.0%2%1%0%2000 U.S. Census - Work Trips2007 ACS - Work Trips2008 SFMTA Survey - All TripsSources: 2000 U.S. Census, 2007 U.S. Census - American Community Survey, 2008 SFMTA citywide surveyNote: The U.S. Census only measures work trips for those 16 years or older. The SFMTA survey number represents alltrips in San Francisco made by bicycle.Frequent and InfrequentCyclistsTo analyze the survey results, respondents were grouped into two categories:Figure 5: Proportion of Frequent Cyclists to InfrequentCyclists in San FranciscoPercentage of Respondentsfrequent cyclists — those who selfreported that they bicycle two or moretimes per week, and infrequent cyclists —those who self-reported that they bicycle100 %one or zero times per week. Infrequent84%80 %cyclists include people who never bicycle.TripsA “trip” is defined as travel from onedestination to another. Any stop along a60 %journey is considered a destination. Forexample, a journey from work to the grocery store to home would count as two40 %trips: one from work to the grocery storeand one from the grocery store to home.20 %16%Trip DiarySurvey respondents were asked to complete trip diaries. Trip diaries are a list of0%all trips that a person makes in a set timeFrequent CyclistsInfrequent CyclistsSource: Phone (self-reported frequency of bicycling)Note: Frequent cyclists are those who reported bicycling 2 or more times per week. Infrequent cyclists are those whoreported bicycling less than 2 times per week, including those who didn’t bicycle.period. Trip diaries for the San FranciscoState of Cycling Report asked respondents to report the trip purpose and modefor all trips they made the day before.S a n Fr a n c i sc o S t ate of C ycling 2008 9
Why are people bicyclingin San Francisco?are successfully using theirbicycle to get to work andschool and to shop.Specific findings from thesurvey include:Bicycling rates in SanFrancisco are distinct fromnational trends. While nearlya third of bicycle trips arefor leisure or exercise, themajority of bicycle trips inthe City are for utilitarianpurposes, particularlycommuting to work and schooland shopping (Figure 6).This is notably different fromnational trends, which indicatethat 52 percent of bicycle tripsare recreational and only fivepercent are school or workcommute related.1 Bicyclingin San Francisco is clearlya viable means of everydaytransportation as evidencedby the number of people who 36 percent of bicycle tripsare for leisure or fitness/exercise. 28 percent of bicycle tripsare for work or are workrelated. 25 percent of bicycle tripsare shopping related. Eight percent of bicycle tripsare school or educationrelated.1 The 2002 National Survey of Pedestrian andCyclists Attitudes and Behaviors conducted bythe Bureau of Transportation Statistics and theNational Highway Traffic Safety Administration.Figure 6: Trip Purpose as a Percentage of All Trips Made in a DayPercentage of Trips35 %Bicycle Trips33%All Trips30 %27%28%25%25 %20 %18%18%16%15 %12%10 %8%7%5%5%5%0%ShoppingWork or Work RelatedLeisureFitness/ExerciseSource: Phone Trip Diary. N 1,195 total trips and 80 bicycle trips.Note: Return to home trips are included in all categories. Numbers may not add up to 100% due to rounding.10 S an Francisc o M u n i c i p a l Tr a n s p o r t a t i o n Ag e n c yPickup/Drop offSchool/Education
What motivates cycliststo bicycle?Specific findings from thesurvey include:San Francisco’s bicyclistsare motivated to bicycle formany reasons, but the mostcommonly cited reason is“exercise.” Approximatelyone-third of all respondentscited environmental reasons,enjoying time outdoors andthe low cost of bicyclingcompared to driving or transitas motivations to bicycle(Figure 7). This suggeststhat programs to encouragepeople to bicycle shouldfocus on health and fitness,environmental benefits andthe cost benefits of bicycling. Regardless of the purposeof the trip, 51 percent ofrespondents cited “exercise”as a motivation to bicycle. 20 percent of respondentswere motivated to bicyclebecause bicycling was“faster than driving.” People who identify as amember of the bicyclingcommunity and bicyclebecause it is faster thantransit and cheaper thandriving and transit aresignificantly more likely tobicycle two or more timesper week.Figure 7: Cyclists’ Motivation to RidePercentage of Respondents60 %51%50 %39%40 %38%35%30%30 %20%18%20 %15%10 %0%ExerciseEnvironment/air qualityEnjoytime outdoorsCheaperthan driving/transitFasterthan transitFaster thandrivingIdentify asmember ofbicyclingcommunityAlone time/downtimeSource: Phone and Intercept, all respondents who bicycled at least once in the last year.Note: Respondents could choose more than one answer.S a n Fr a n c i sc o S t a t e of C ycling 2008 11
Who is bicycling and whois not?While people of all ages,races and genders bicyclein San Francisco, frequentbicyclists are more likely to bemale, Caucasian and betweenthe ages of 26 and 35 (Figure7 and Table 3). This suggeststhat San Francisco shouldcustomize outreach efforts toaddress the bicycling needs ofthose who are less likely to bebicyclists, i.e., women, minoritygroups and older people.Specific findings from thesurvey include: African Americans makeup seven percent of SanFranciscans but only twopercent of frequent cyclists. Hispanics make up 14percent of San Franciscansbut only 10 percent offrequent cyclists.Table 3: Ethnic and Racial Comparisonof Survey Data to San Francisco mericanOther Women make up 49 percentof San Franciscans, butonly 23 percent of frequentcyclists. Asians make up 32 percentof San Franciscans, butonly 12 percent of ranciscoPercentage(2006 ACS)Margin ofError(2006 ACS)FrequentCyclistsInfrequentCyclists53%32%7% /- 8% /- 4% /- 3%70%12%2%53%25%6%0% /- 2%1% 1%8%n/a11%15%10%80%11%82%14%86%Source: 2006 American Community Survey, 2008 Phone and Intercept SurveysNote: Percentages for the intercept and phone surveys have been recalculated to account for those who did notanswer the question.Figure 8: Reported Gender of Frequent vs. Infrequent CyclistsFrequent CyclistsInfrequent t Know/Decline to Answer72%0.2%Source: Phone and InterceptNote: Frequent cyclists reported bicycling an average of two or more times per week. Infrequent bicyclists reported bicycling and average of one or zero times per week.12 S an Francisc o M u n i c i p a l Tr a n s p o r t a t i o n Ag e n c y
What are the barriers tobicycling?Respondents were askedto rate a list of potentialbarriers to bicycling on a oneto five scale. Respondentsrated nearly all barriers tobicycling at three or lower(Figure 9). Infrequent cyclistsare slightly more likely thanfrequent cyclists to considerbarriers a greater deterrenceto bicycling (Figure 9). Thisis not surprising; however,it is interesting to note thatboth frequent cyclists andinfrequent cyclists identifiedsimilar highest ranked barriersto bicycling, including: “notcomfortable biking with cars,”“too difficult to cross majorstreets” and “not enough bikelanes.”This suggests that whilethe barriers are an issuefor frequent cyclists andinfrequent cyclists alike,frequent cyclists have beenable to overcome the barriersmore easily than infrequentcyclists.Key findings from the surveyinclude: Between 71 and 79 percentof respondents were notcomfortable biking with cars. Between 75 and 80 percentof respondents felt there arenot enough bike lanes. Between 68 and 73 percentof respondents feel that it istoo difficult to cross majorstreets.Figure 9: Ratings of Barriers to BicyclingGreatBarrier 543.032.92.92.52.52.42.42.32.22.121.8Not aBarrier 1Not enoughNotToo difficultbikecomfortable to crosslanesbikingmajorwith carsstreetsSource: Phone and Intercept.Notenoughlight atnightI havethingsto carryPlaces aretoo farawayI needto travelwith smallchildrenHills/Don'twantto getsweatybefore workNotenoughtimefor bikingI amworriedaboutcrimeWork hourschange/are too early/lateS a n Fr a n c i sc o S t a t e of C ycling 2008 13
What predicts if one is afrequent bicyclist?Survey responses wereanalyzed to determine whichfactors might be statisticallysignificant predictors ofwhether someone is afrequent bicyclist or not.Seven factors were shownto be statistically significantpredictors. These aresummarized in the side bar tothe right.Factors Shown to PredictWhether One is a FrequentCyclist or NotYou are more likely to bicycletwo or more times per week if:Your motivation for bicycling is: It’s faster than transit It’s cheaper than driving/transit You identify as a member ofthe bike communityYou feel that: You have enough time forbicycling You are comfortable bikingwith carsYour demographics are: Male Under the age of 56Figure 10: Percentage of Respondents who Identified Each Barrieras a Hindrance to Bicycling (Frequent vs. Infrequent Cyclists)Percentage of Respondentsthat Rated Each Item as a BarrierFrequent CyclistsInfrequent Cyclists71%Not comfortable biking with cars79%68%Too difficult to cross major streets73%80%Not enough bike lanes75%61%Places are too far away64%63%Not enough light at night70%67%I have things to carry64%19%I need to travel with small children34%55%Hills/ don't want to get sweaty before work59%34%Work hours change/ are too early/ late44%010Source: Phone and intercept.14 S an Francisc o M u n i c i p a l Tr a n s p o r t a t i o n Ag e n c y20304050607080
What is the overallawareness of the SFMTA’sbicycling resources?Key findings from the surveyinclude: Frequent cyclists are mostaware of the City’s bicyclemaps (53 percent) and thepublic outreach campaign(43 percent). Infrequent cyclists aremost aware of the publicoutreach campaign (26percent) and the City’sbicycle maps (20 percent). Respondents are leastaware of the City’sresearch and reports(11 percent of frequentcyclists and four percentof infrequent cyclists) andhotline (five percent).Within the generalpopulation, there is not muchfamiliarity with the SFMTA’sbicycling resources (Figure11). The resources that thepublic are most familiarwith are the public outreachcampaigns and the bicyclemaps. Frequent bicyclistsare much more aware of theCity’s bicycling resources,and infrequent bicyclistsare less aware of the City’sresources. Very few peopleare familiar with the City’sresearch, reports and bicyclehotline. The City may want toincrease efforts to advertisethese resources or reevaluate existing outreachefforts.Figure 11: Frequent and In
Bicycle Program conducted its first citywide bicycle count to provide a baseline for future bicycle count comparisons. Thirty-three locations were selected for bicycle counts. In August 2007 and in August 2008, the City conducted follow-up bicycle counts, which were compared to the 2006 counts to determine changes in cycling volumes and patterns.
